2019 International Conference on Computation and Information Sciences (ICCIS 2019) ISBN: 978-1-60595-644-2
Principal Component Analysis Algorithm
Based on Mutual Information Credibility
Suzhi Zhang, Xiaoni Chen and Penghui Li
ABSTRACT
Data dimensionality reduction is the mapping of data sets from high-dimensional feature space to low-dimensional feature space. Traditional principal component analysis (PCA) algorithm is a kind of commonly used data dimensionality reduction algorithm. The computation time of the traditional PCA is usually quite long that it cannot meet the requirement of the classification for real world problems. Through the study of mutual information credibility, a PCA data dimensionality reduction algorithm based on mutual information synthesize credibility is proposed. Firstly, the ideas of mutual information (MI), relative mutual information credibility (MIR) and absolute mutual information credibility (MIA) are introduced. Then the mutual information synthesize credibility (MIS) is solved according to MIA and MIR, and feature selection is carried out by using the mutual information synthesize credibility. Finally, PCA algorithm is used to reduce the dimension of the processed data, and KNN and SVM algorithms are used to classify the data after dimensionality reduction. Compared with traditional PCA and PCA based on information entropy (E-PCA) algorithms, the results indicate that the proposed algorithm can achieve a better effect on the dimensionality reduction result and has improved classification accuracy.
1. INTRODUCTION
In recent years, with the development of information technology, we have gradually entered the era of big data[1]. The mining and analysis of big data can effectively explore and discover the effective information hidden in the data. However, in practical processing, the data we are faced with having a high dimension.
Zhang Suzhi, School of Computer and Communication Engineering, Zhengzhou University of Light Industry, Zhengzhou, China
Chen Xiaoni, School of Computer and Communication Engineering, Zhengzhou University of Light Industry, Zhengzhou, China
Traditional data mining technology needs higher requirements in processing such high-dimensional data, both in terms of resources and timeliness. Therefore, the high-dimensional data needs to be reduced the dimension.
Data dimensionality reduction is an attempt, which is to transform a high dimensional data set into a low-dimensional representation by linear or nonlinear mapping, so as to obtain a meaningful low-dimensional representation of high-dimensional data [2]. At present, data dimensionality reduction is widely used in image processing [3], medicine [4], photovoltaic industry [5] and other fields. Researchers at home and abroad have proposed many methods of dimensionality reduction, among which the most commonly used linear method is the principal component analysis data dimensionality reduction method [6] [7] introduced the principle of PCA algorithm and applied PCA algorithm to user information data, and the experiment proved that this method effectively reduced the data dimension, thus improving the data matching efficiency [8] introduced the idea of information entropy on the basis of PCA and improved the PCA algorithm. When processing data, this method first used information entropy feature screening, and then used PCA algorithm for dimensionality reduction. The result of dimensionality reduction was effectively improved, but the classification accuracy was not very good because the relationship between features and classes was not considered. Based on this, [9] introduced the idea of mutual information. By replacing covariance matrix with mutual information matrix, this algorithm could improve the classification accuracy of dimension reduced data effectively, but the validity of the selected feature subset was not good enough. In view of the above problems, this paper proposes a PCA algorithm based on mutual information comprehensive credibility—MIS-PCA.
2.RELATED WORK
2.1Mutual Information
In information theory, mutual information (MI) is used to indicate the degree of interdependence between two variables [10], and its calculation formula is:
) P (
) | P ( log ) ( P ) ( MutualInfo
i W
C W C
W
i i (1)Among them, i=1, 2,..., M, M is the number of categories. P(Ci) represents the frequency of Ciclasses in the sample data. P(W) is the probability that the sample contains feature W. P(Ci|W) represents the conditional probability of Ciwhen feature W is included in the sample data. It is not difficult to see that when feature W is independent of category Ci, its correlation with the class is 0, and mutual information is 0. The smaller P(W) is, and the larger P(W|Ci) is, the more information feature W provides to category Ci, and the more this feature can represent this class. Conversely, the results are reversed.
2.2Absolute Mutual Information Credibility
the relationship between feature attribute W and information amount provided by various Ci. For example, if the information provides by a certain feature attribute W to a certain category of Ciis much more than that provides by W to other categories of Cj (j=1,2,...,M, and j≠i), then this feature attribute shows a strong ability of class discrimination on Ci. Based on the above, this paper introduces the concept of credibility in reference [11] and introduces absolute mutual information credibility. The specific definitions are shown in formula (2) and formula (3) below:
IF: MutualInfoW s
W MaxMI W MIACredit W MutualInfo ) ( ) ( ) ( , 0 ) ( (2)
ELSE: MIAbCredit(W)0 (3)
Among them, MIACredit stands for absolute mutual information credibility, commonly abbreviated as MIA, MaxMI represents the maximum mutual information value between each feature attribute and category Ci. The specific calculation method of MaxMI is shown in formula (4) below.
2.3 Relative Mutual Information Credibility
Since absolute mutual information credibility only evaluates the maximum mutual information value between feature attribute W and Ci of each category, however, the size of the value's classification significance needs to be further considered whether the value is significantly larger than the mutual information between the feature attribute and other categories. When the mutual information between features attribute W and category Ci is the largest, but the mutual information between this feature attribute and other categories is also very large, the use of absolute mutual information credibility cannot fully explain whether it is suitable for this classification. Therefore, a relative scale, namely relative mutual information credibility, is defined to represent the measure of mutual information between feature attributes and categories. The specific definition is shown in the following formula (5) - (10).
IF: LessMI(W)0 (5)
THEN: ( )
) ( ) ( W LessMaxMI W MaxMI W MIRCredit (6)
IF: MaxMI(W)0, AND LessMI(W)0 (7)
THEN: MIRCredit(W)0 (8)
IF: MaxMI(W)0, AND LessMI(W)0 (9)
THEN: MIRCredit(W) (10)
Where in, LessMI(W) represents the mutual information value between the feature attribute and other categories. LessMax(W) represents the maximum amount of mutual information between the feature attribute and other categories. The definition of MaxMI(W) is the same as formula (4) above, as shown in formula (11) below:
MaxMIW
i MW LessMaxMI W P C W P i
i ( ) , 1,2,...,
log max ) ( ) ( ) | ( (11)
2.4 Synthesize Credibility of Mutual Information
information from different angles. In order to measure credibility more comprehensively, absolute mutual information credibility and relative mutual information credibility should be combined. Therefore, the comprehensive credibility of mutual information is defined in this paper, and the specific calculation is shown in the following formula (12):
) ( )
( )
(W MIACreditW MIRCreditW
MISCredit (12)
3.DATA DIMENSION REDUCTION ALGORITHM BASED ON MUTUAL INFORMATION SYNTHESIZE CREDIBILITY (MIS-PCA)
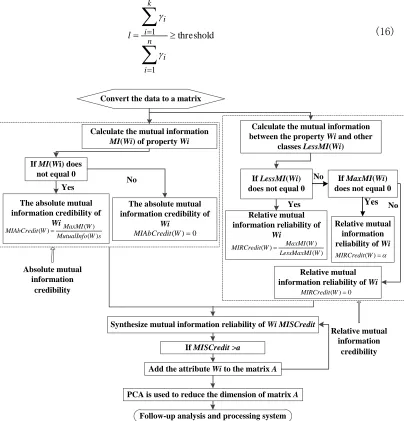
3.1 Process Design
Principal component analysis (PCA) algorithm is a common linear dimensionality reduction method for data [12]. In this paper, an improved PCA algorithm based on mutual information reliability is proposed. The processing flow of the algorithm is shown in Figure 1 below.
3.2 Algorithm Design
The dimensionality reduction algorithm of PCA data based on mutual information synthesize credibility (MIS-PCA) have the same principle as that of PCA. The only difference is that the PCA algorithm is used to do a feature screening before dimension reduction. Set up comprehensive mutual information credibility threshold ɑ, filter out the nearly useless feature attribute of the original data information. The specific steps of MIS-PCA algorithm are shown below.
Input: data matrix Unxm, m represents the number of samples, and n represents the
number of attributes. Mutual information synthesize reliability threshold ɑ, contribution rate l.
Step 1: The MI, MIA, MIR and MIS of each attribute are calculated, and the MIS and mutual information credibility threshold ɑ are compared. The new matrix A is obtained by feature selection.
Step 2: The PCA algorithm is used to reduce the dimension of matrix A. The operation is as follows:
1)The matrix Ynxm is obtained by conducting sample matrix centralization, where:
) , 1 ), 2 , n( repmat(mea
- A m
A
Y (13)
2)Find covariance matrix Cov:
) 1 ) 2 , /(size(
Cov(YYT) Y (14)
3)Find the eigenvalues and eigenvectors of the covariance matrix. 4)Select the transform base.
The largest k eigenvalues are selected, and the corresponding k eigenvectors are taken as column vectors to form the eigenvector matrix Pnxk.
P P
L T (15)
5)Calculate the data matrix after dimension reduction
following formula (16). In addition, in the design of the algorithm, k is not used as the parameter input. In fact, k is selected according to the contribution rate of eigenvalues.
threshold 1 1
n i i k i i l (16)Convert the data to a matrix
Calculate the mutual information MI(Wi) of property Wi If MI(Wi) does
not equal 0
The absolute mutual information credibility of
Wi
The absolute mutual information credibility of
Wi
Yes No
Calculate the mutual information between the property Wi and other
classes LessMI(Wi)
If LessMI(Wi) does not equal 0
Relative mutual information reliability of
Wi
If MaxMI(Wi) does not equal 0 Yes
No
Relative mutual information reliability of Wi
Yes
Synthesize mutual information reliability of Wi MISCredit
If MISCredit >a
Add the attributeWi to the matrix A
PCA is used to reduce the dimension of matrix A Follow-up analysis and processing system
Relative mutual information reliability of Wi
No Relative mutual information credibility Absolute mutual information credibility s W MutualInfo W MaxMI W MIAbCredit ) ( ) ( )
( MIAbCredit(W)0
[image:5.612.96.500.86.507.2]) ( ) ( ) ( W LessMaxMI W MaxMI W MIRCredit ) (W MIRCredit 0 ) (W MIRCredit
Figure 1. Data dimensionality reduction processing flow of PCA method based on mutual information comprehensive reliability.
4. EXPERIMENT AND ANALYSIS
4.1 Experimental Environment and Data
In this paper, the experimental simulation is realized on the server with the help of software MatlabR2014a. The memory of the server is 64GB, the CPU is E5-2609, 8 core, and the main frequency is 1.70Hz.
attributes and 12 category attributes. Among them, 3211 instances are used as training sets and 1196 instances are used as test sets. Sonar data set in UCI machine learning database [14], which consists of 208 instances, 2 category attributes and 60 attributes. Among them, 40 instances are used as the test set and 168 instances are used as the training set.
4.2 Comparison and Analysis of Experimental Results
1) Dimensionality reduction results
The dimensionality reduction methods of PCA, E-PCA and MIS-PCA are used to conduct experiments in MATLAB. Among them, PCA, E-PCA and MIS-PCA determine K value according to the contribution rate l.
The dimensionality reduction results of the first data set are shown in TABLE I. As can be seen from the table, when l=1, K (PCA) =125, K (E-PCA) =104, and K (MIS-PCA) =62. Therefore, in the case of uniform distribution of information, for the data of 2436 dimensions, 129 principal components need to be retained through PCA to maintain the same information as the original data,114 principal components need to be retained after E-PCA, however, only 79 principal components need to be retained after MIS-PCA. TABLE II shows the results of dimensionality reduction processing of PCA, E-PCA and MIS-PCA when l=0.95. From the results of the dimension K, the dimensionality reduction results of MIS-PCA are better than PCA and E-PCA.
TABLE I. RESULTS OF DIMENSION REDUCTION OF THE FIRST DATA SET AFTER PCA, E-PCA AND MIS-PCA.
The rate of contribution l
Dimensionality reduction results K
PCA E-PCA MIS-PCA
a=0 a>0
0.80 51 51 48 43
0.85 59 59 52 45
0.88 68 68 61 47
0.90 72 72 66 50
0.92 80 80 75 56
0.94 84 84 79 59
0.95 95 95 81 62
0.96 103 103 87 64
0.98 114 114 100 68
1 129 129 114 79
TABLE II. RESULTS OF THE FIRST DATA SET PROCESSED BY PCA, E-PCA AND MIS-PCA.
Methods The rate of contribution l Dimensionality reduction results K
PCA 0.95 95
E-PCA a=0 0.95 81
a>0
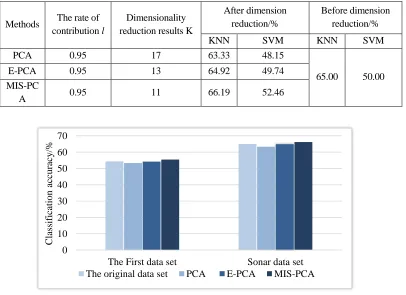
The dimensionality reduction results of Sonar data set are shown in TABLE III. As can be seen from the table, when l=1, K (PCA) =35, K (E-PCA) =28, and K (MIS-PCA) =22. Therefore, for Sonar data, it needs to keep 35 principal components after PCA to keep the same information as the original data, 28 principal components need to be retained after E-PCA, however, and 22 principal components need to be retained after MIS-PCA. TABLE IV shows the results of dimensionality reduction processing of PCA, E-PCA and MIS-PCA when l=0.95, from the result dimension K, the result of MIS-PCA is better than the other two.
TABLE III. RESULTS OF DIMENSION REDUCTION OF THE SONAR DATA SET AFTER PCA, E-PCA AND MIS-PCA.
The rate of contribution l
Dimensionality reduction results K
PCA E-PCA MIS-PCA
a=0 a>0
0.80 7 7 6 3
0.85 9 9 7 5
0.88 11 11 8 6
0.90 12 12 9 7
0.92 13 13 11 9
0.94 16 16 12 10
0.95 17 17 13 11
0.96 19 19 16 15
0.98 24 24 21 17
1 35 35 28 22
TABLE IV. RESULTS OF PCA, E-PCA AND MIS-PCA PROCESSING SONAR DATA SET.
Methods The rate of contribution l Dimensionality reduction results K
PCA 0.95 17
E-PCA a=0 0.95 13
a>0
MIS-PCA 0.95 11
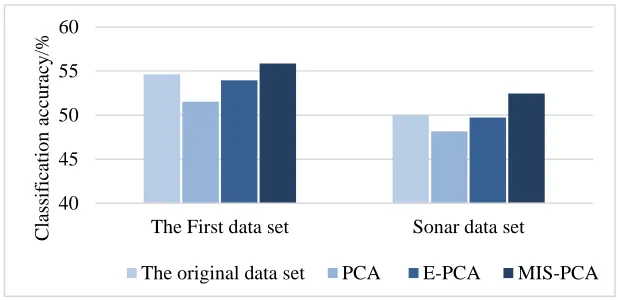
2)Classification accuracy
MIS-PCA is better than PCA and E-PCA in data classification accuracy. It can be clearly seen from Figure 4 and Figure 5 that, although the data classification accuracy after MIS-PCA dimension reduction is better than that after PCA and E-PCA dimension reduction, but compared with the original data, the accuracy of direct classification is only slightly improved, because MIS-PCA algorithm does not consider the distance of intra-class and inter-class too much in the process of dimensionality reduction. Therefore, our next work will fully introduce intra-class distance and inter-class distance into the algorithm, so as to better improve the discrimination ability of data low-dimensional representation.
TABLE V. COMPARISON OF CLASSIFICATION ACCURACY BEFORE AND AFTER DIMENSION REDUCTION OF THE FIRST DATA SET.
Methods The rate of contribution l
Dimensionality reduction results K
After dimension reduction/%
Before dimension reduction/%
KNN SVM KNN SVM
PCA 0.95 95 53.31 51.53
54.32 54.63
E-PCA 0.95 81 54.24 53.95
[image:8.612.102.508.370.665.2]MIS-PCA 0.95 62 55.49 55.84
TABLE VI. COMPARISON OF CLASSIFICATION ACCURACY BEFORE AND AFTER DIMENSION REDUCTION OF SONAR DATA SET.
Methods The rate of contribution l
Dimensionality reduction results K
After dimension reduction/%
Before dimension reduction/%
KNN SVM KNN SVM
PCA 0.95 17 63.33 48.15
65.00 50.00
E-PCA 0.95 13 64.92 49.74
MIS-PC
A 0.95 11 66.19 52.46
Figure 4. Classification accuracy of KNN algorithm before and after dimensionality reduction of two data sets.
0 10 20 30 40 50 60 70
The First data set Sonar data set
C
lass
if
icatio
n
ac
cu
rac
y
/%
Figure 5. Classification accuracy of SVM algorithm before and after dimension reduction of two data sets.
5. CONCLUSIONS
The traditional principal component analysis data dimensionality reduction method processing high dimension data, the time of it taken is too long, the result of dimensionality reduction is not good enough and the data classification accuracy after dimensionality reduction is not high. According to these the paper proposed a dimensionality reduction algorithm of MIS-PCA based on mutual information synthesize credibility. Make the MIS-PCA, PCA and E-PCA algorithms implement in MATLAB, and data classification experiments are carried out using KNN and SVM algorithms. The comparison of experimental results shows that MIS-PCA algorithm has better dimensionality reduction result, and the dimensionality reduction data has higher classification accuracy.
ACKNOWLEDGEMENTS
This work was partly financially supported through grants from The Open Issues of Beijing Key Laboratory of Big Data Technology for Food Safety (No.BKBD-2017KF08) and project of National Natural Science Foundation of China (No.61802353).
REFERENCES
1. Jin X, Wah B W, Cheng X, et al. 2015. “Significance and Challenges of Big Data Research,” Big
Data Research. 2015 (2):59-64.
2. Han L, Wu Z, Zeng K, et al. 2018. “Online multilinear principal component analysi,”
NEUROCOMPUTING.
3. Wen C, Zhu Q. 2010. “Dimension reduction analysis in image-based species classification,” IEEE
International Conference on Intelligent Computing & Intelligent Systems.
40 45 50 55 60
The First data set Sonar data set
C
lass
if
icatio
n
ac
cu
rac
y
/%
4. Tarle B, Jena S. 2017. “Improved artificial neural network for dimension reduction in medical data classification,” International Conference on Computing Communication Control & Automation. 5. Dai Q, Zhang J, Li F, et al. 2016. “Dimension Reduction of Spectral Data Based on Feature Mining,”
Journal of Data Acquisition & Processing.
6. Tonglin Zhang, and Baijian Yang. 2016. “Big data dimension reduction using pca," 2016 IEEE
International Conference on Smart Cloud (SmartCloud).
7. Yu D, Guan J, Wei Q, et al. 2013. “PCA-based dimensionality reduction method for user information in Universal Network,” IEEE International Conference on Cloud Computing &
Intelligent Systems.
8. Xing-Gao H E, Chan-Juan L I, Rui-Jin W, et al. 2018. “Research on Dimensional Reduction of Sparse Matrix Data Based on Information Entropy,” Journal of University of Electronic Science &
Technology of China.
9. Fan X, Feng H, Meng Y. 2012. “PCA based on mutual information for acoustic environment classification,” International Conference on Audio.
10. Tang P S, Tang X L, Tao Z Y, et al. 2014. “Research on feature selection algorithm based on mutual information and genetic algorithm,” International Computer Conference on Wavelet Active
Media Technology & Information Processing.
11. Castillo C, Mendoza M, Poblete B. 2011. “Information credibility on twitter,” International
Conference on World Wide Web.
12. Lei W, Wang X, Wan W, et al. 2010. “Dimension reduction of photolithography data based on PCA,” International Conference on Audio Language & Image Processing.
13. Nanjing. 2011. “A New Local Discriminant Projection Method,” Chinese Journal of Computers,
34(11):2243-2250.