A Monthly Double-Blind Peer Reviewed Refereed Open Access International e-Journal
Website: www.aarf.asia. Email: [email protected] , [email protected]
Page 20
NEED OF MICRO STUDY IN HOUSEHOLD FOOD SECURITY
A CASE FROM NORTH EASTERN INDIA
Dr. Rofique Ahmed Associate Professor Department of Economics Bahona College, Jorhat, Assam, India
ABSTRACT
Household food security is a social issue intertwined with a large number of explanatory
variables having implications of locality differentials. Researchers trying to dig out the major
variables of household food security commonly use logistic probability model taking household
food security itself as a dummy dependent variable. Application of logistic probability model in
four case studies in the countryside of Jorhat district of Assam, a state in North Eastern India
shows that determinants of household food security vary not only with locality, but also with food
security thresholds. Food security here has been estimated as per FAO (1996) definition using
two scales – one being calorie cut off used by Planning Commission of India and other being
required dietary allowance for average Indian given by Indian Council of Medical Science
Research. Identifying significant variables of household food security and mapping them as per
their occurrence score, this paper concludes that, household food security monitoring and
intervention need to be based on the selection of a proper threshold and area specific studies.
A Monthly Double-Blind Peer Reviewed Refereed Open Access International e-Journal
Website: www.aarf.asia. Email: [email protected] , [email protected]
Page 21
1. Introduction
Using a common statistical tool to explore cause and effect relationship in the context of
a social issue in an area stratified with some geo-administrative definition, when the
strata-specific outcomes lack homogeneity is reflective of characteristic difference of
those strata and its components, though not to be noticed at first sight. Household food
security (HFS) is such a social issue intertwined with a large number of explanatory
variables both of its demand and supply sides having implications of locality
differentials. Researchers often try to dig out the major variables having significant
implications on HFS, so that proper policy thrust can be assigned. One of the commonly
used statistical tools here is logistic probability model (Strauss, 1983; Barnum & Squire,
1979; Yotopoulos, 1983, quoted in Kidane et al. 2005; Amaza et al. 2006; Basir et al.
2012). Considering HFS as dummy dependent variable, the application of logistic
probability model in four development blocks of Jorhat district of Assam under a
common eco-climatic zone, shows that, the explanatory variables having significant
implications on HFS vary not only with locality, but also with the difference in food
security thresholds. In India, there is no official food security scale. The poverty scale as
food security scale is still debatable. The poverty scale used by Planning Commission of
India is just a hunger scale for an average Indian. It does not fully cover the cost of
quality living in locality context, so far FAO (1996) food security scale is concerned.
Indian Medical Science Research publishes sex and age specific required daily diet as per
balanced diet norms. An attempt has been made in this paper to measure HFS by
formulating two food security thresholds – one on the basis of calorie cut off scale used
by Planning Commission of India (hereafter PCI scale) and other on the basis of balanced
diet norms defined by Indian Council of Medical Science Research (hereafter ICMR
scale). With an objective to identify demand and supply side lapses of HFS separately
both scales were bifurcated at income and food expenditure threshold. Scaling them in
four rural localities under four development blocks of Jorhat district, in the state of
Assam, the gateway to North-Eastern India, the significant variables behind HFS have
been traced and mapping them as per occurrence score this paper concludes that, if HFS
monitoring and intervention is to perform on the part of any government and
A Monthly Double-Blind Peer Reviewed Refereed Open Access International e-Journal
Website: www.aarf.asia. Email: [email protected] , [email protected]
Page 22
specific studies. HFS monitoring is still an awaiting agenda in India. With recent
performance, emerging in the developing world, India deserves HFS monitoring to
understand both the poverty and achievement in socio-economic front, may be a
substitute of/complimentary to official poverty scale. This paper is a justification to that
need.
2. HFS - Concepts
The concept of food security seems to have an evolutionary change during the last 50
years (Swaminathan, 2001). Its definition and concepts have undergone several rounds
after having special emphasis in World Food Summit 1974. At that time food security
emphasis centered round the supply and storage provisions at national and sub-national
level, but in 80s its focus shifted to the issues of improved access to food at local,
household and even individual level. In the 1990s, improved access was redefined by
taking into account livelihood and subjective considerations. Another round of evolution
took place particularly after the World Food Summit in 1996, when food security at
individual, household, national, regional and global levels was said to be achieved only if
all people, at all times, have physical and economic access to sufficient, safe and
nutritious food to meet their dietary needs and food preferences for an active and healthy
life (FAO, 1996). Currently, a synthesis of these definitions, with the main emphasis on
availability, access, and utilization, serves as working definition. With slight modification
Swaminathan (2008) defined it as - sustainable food security is physical, economic and
social access to the balanced diet and clean drinking water to every child, woman and
man in the country.
Nutritional security is defined as adequate nutritional status in terms of protein, energy,
vitamins and minerals for all household members at all times (Quisumbing, et al., 1995).
Ensuring varied food intakes, containing all essential macro and micronutrients in
sufficient quantities, through a balanced and diversified diet is also essential to support an
active and healthy life. Nutritional security involves the consumption and physiological
use of adequate quantities of safe and nutritious food by every member of the household.
A Monthly Double-Blind Peer Reviewed Refereed Open Access International e-Journal
Website: www.aarf.asia. Email: [email protected] , [email protected]
Page 23
quantities of safe and nutritious food are equitably distributed within households and
among all communities and nations (Nandi 1999). Availability-accessibility is only
primary condition whereas nutritional adequacy is the sufficient condition of food
security. Here proper knowledge on healthy diet as well as healthy living also matters.
3. Objectives
The objectives of this study are –
1. To estimate locality difference of HFS by thresholds.
2. To identify major variables of HFS.
3. To examine the need of area-specific study of HFS.
4. Study Design
Two cut offs – one is calorie cut off of average Indian villager (2400 calorie) given by
Planning Commission of India (PCI), and the other is required dietary allowance
(weighted for both sexes and all age groups) given by Indian Council of Medical Science
Research (ICMR). Both were transformed to cost cut offs at local price and food habits
and it stands for expenditure threshold of HFS. Following the rule international agencies,
it was developed to income threshold of HFS by adding 33 percent of expenditure
threshold as a cost of non-food basic expenditure at local standard. Income threshold is
supply implicated whereas expenditure threshold is demand implicated. Thus, in this
study four HFS cut off were used. They are -
1. Calorie based food expenditure threshold (CBFET).
2. Calorie based income threshold (CBIT).
3. RDA based food expenditure threshold (RBFET)
4. RDA based income threshold (RBIT)
A household lying below the cut off was considered as food insecure and lying above as
food secure. This constituted the dummy dependent variable of the HFS equation given in
(1) below - assigning 0 for food insecure household and 1 for food secure household.
A Monthly Double-Blind Peer Reviewed Refereed Open Access International e-Journal
Website: www.aarf.asia. Email: [email protected] , [email protected]
Page 24
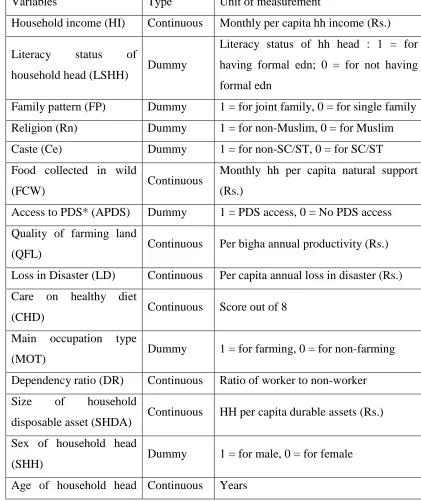
these, variables found common in the study area, unit of their measurement and type as
explanatory variable are shown in table 1.
Table 1: Variables having implications on HFS in the study area – type and unit of
measurement
Variables Type Unit of measurement
Household income (HI) Continuous Monthly per capita hh income (Rs.)
Literacy status of
household head (LSHH) Dummy
Literacy status of hh head : 1 = for
having formal edn; 0 = for not having
formal edn
Family pattern (FP) Dummy 1 = for joint family, 0 = for single family
Religion (Rn) Dummy 1 = for non-Muslim, 0 = for Muslim
Caste (Ce) Dummy 1 = for non-SC/ST, 0 = for SC/ST
Food collected in wild
(FCW) Continuous
Monthly hh per capita natural support
(Rs.)
Access to PDS* (APDS) Dummy 1 = PDS access, 0 = No PDS access
Quality of farming land
(QFL) Continuous Per bigha annual productivity (Rs.)
Loss in Disaster (LD) Continuous Per capita annual loss in disaster (Rs.)
Care on healthy diet
(CHD) Continuous Score out of 8
Main occupation type
(MOT) Dummy 1 = for farming, 0 = for non-farming
Dependency ratio (DR) Continuous Ratio of worker to non-worker
Size of household
disposable asset (SHDA) Continuous HH per capita durable assets (Rs.)
Sex of household head
(SHH) Dummy 1 = for male, 0 = for female
[image:5.612.122.543.202.704.2]A Monthly Double-Blind Peer Reviewed Refereed Open Access International e-Journal
Website: www.aarf.asia. Email: [email protected] , [email protected]
Page 25
(AHH)
Govt. support (GS) Continuous Monthly per capita (Rs.)
Aspired income (AI) Continuous Income expected to be sufficient to fill
FS (Rs.)
Out migration (OM) Continuous HH member living outside the locality
Size of household land
(SHL) Continuous Per capita land holding in Bigha
* PDS = Public Distribution System
For the dummy variables reference categories are -
Variables Reference category Observed category
LSHH : Household head without Household head having
having formal qualification formal qualification
FP Joint family Single family
Religion Non-Muslim Muslim
Caste Non-SC/ST SC/ST
APDS Non access to PDS Access to PDS
OT Non-farming Farming
SHH Female Male
Care on healthy diet was estimated by recording score against 8 questions on general
knowledge regarding healthy diet and healthy living – maximum score 8 and minimum 0
– divided in to two groups – 0 to 3 and 4 to 8. The first group has been taken as reference.
Complicacy arises regarding the selection of FS determinants, because temporal and
spatial factors play major role in this situation. Keeping this point in mind the following
multiple logistic regression model has been applied to trace the major factors which may
have impact on food security status:
ji ji j i
i
u X p
p
0
1
A Monthly Double-Blind Peer Reviewed Refereed Open Access International e-Journal
Website: www.aarf.asia. Email: [email protected] , [email protected]
Page 26
Where,
Xji = Proposed independent variables of HFS as mentioned above
uji = Stochastic variables
Pi = Probability of ith hh being food secured
Significant HFS variables have been identified by using SPSS-17.0, particularly the
backward elimination option of the software. The leading significant variables have been
trace by mapping their locality occurrence score across scales.
In this work, the state Assam, gateway to North-Eastern India (consisting of 7 states
linking the mainland of India only through a narrow corridor of 24 km width) is taken as
the universe, of which the district Jorhat is a representation of the state’s socio-economic,
ethnic and natural hazards compositions. It has neighborhoods of both the mighty
Brahmaputra and the Naga Hills, a branch Himalayan range and its interior rural locality
is affected regularly both by flood and haunt of wild elephants –common issues of rural
living in Assam; first one is perennial and the later is recently emerging. Out of eight
development blocks of this district, with the consideration of better representation of
locality differentials throughout the state, four (Majuli, Dhekorgara, Kaliapani and
Baghsung) were purposively selected to collect primary information from 600 households
randomly selected – 150 in each development block.
Table 2 : Estimated monthly calorie based food expenditure threshold (CBFET) and
calorie based income threshold (CBIT)
Thresholds Development blocks
Majuli Dhekorgara Kaliapani Baghsung
PCI
CBFET 907.20 896.70 904.20 892.20
33% of CBFET 344.74 412.48 352.64 347.96
A Monthly Double-Blind Peer Reviewed Refereed Open Access International e-Journal
Website: www.aarf.asia. Email: [email protected] , [email protected]
[image:8.612.118.499.149.258.2]Page 27
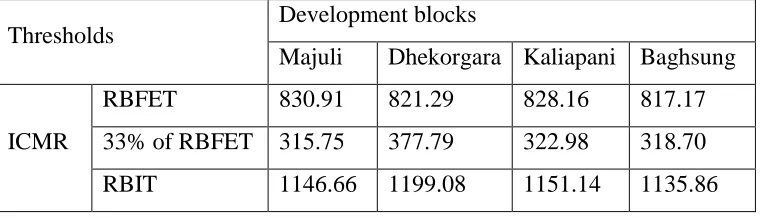
Table 3 : Estimated monthly RDA based food expenditure threshold (RBFET) and RDA
based income threshold (RBIT)
Thresholds Development blocks
Majuli Dhekorgara Kaliapani Baghsung
ICMR
RBFET 830.91 821.29 828.16 817.17
33% of RBFET 315.75 377.79 322.98 318.70
RBIT 1146.66 1199.08 1151.14 1135.86
5. HFS Estimates
Using PCI and ICMR norms regarding food energy intake per person food security
threshold was estimated at local price (2012) and food habit context, as shown in table 4.
Table 4 : Estimated food security thresholds across the localities
Thresholds Development blocks (Rs.)
Majuli Dhekorgara Kaliapani Baghsung
ICMR
RBFET 830.91 821.29 828.16 817.17
NFBE 315.75 377.79 322.98 318.70
RBIT 1146.66 1199.08 1151.14 1135.86
PCI
CBFET 907.20 896.70 904.20 892.20
NFBE 344.74 412.48 352.64 347.96
CBIT 1251.94 1309.18 1256.84 1240.16
Table 5 shows that percentage of food secure household is higher as per ICMR scale than
PCI scale. HFS as per balanced diet norms, given by ICMR is better than as per calorie
in-take cut off used by PCI. But the percentage of food secure household in the study area
is significantly lower. It even goes down to 20 percent in Kaliapani as per both PCI
A Monthly Double-Blind Peer Reviewed Refereed Open Access International e-Journal
Website: www.aarf.asia. Email: [email protected] , [email protected]
Page 28
household above poverty line in Jorhat district is 88. That is, a large number of
households above poverty line in the study area are food insecure irrespective of the
scale.
Of course, percentage of food secure household as per income threshold, in some
localities, being less than that of food expenditure threshold interestingly reflects the
presence redundancy in the measurement of HFS. Logically percentage of food secure
household as per expenditure threshold should be higher than that of income threshold as
because income threshold, by definition, is 33 percent higher than expenditure threshold.
In most of the localities result being contrary to this implies that some of the households
being sufficient in income do not spend in food items as much as required to meet the
norms. Expenditure stands for demand whereas income for supply side of HFS. HFS as
per income threshold being less than that of expenditure threshold ensures that there is
demand side lapse in HFS in some of the localities under study. This lapse is highest in
Dhekorgara as per PCI scale and in Majuli as per ICMR scale. In case of such households
demand side factors of HFS are not so strong to urge the supply side factors to match
them.
Percentage of household as difference between income threshold and expenditure
threshold being negative implies that some households in the study area attains food
security in terms of food expenditure, though income is not sufficient to that. To maintain
food expenditure they forgo some other non-food basic needs. Such households are
present in Baghsung as per PCI scale and in Dhekorgara as per ICMR scale. In case of
these households demand side factors of HFS are stronger than that of supply side
factors.
The distribution of HFS as per both thresholds and scales across localities is not
homogenous. The locality variance is higher in case of income threshold than that of
A Monthly Double-Blind Peer Reviewed Refereed Open Access International e-Journal
Website: www.aarf.asia. Email: [email protected] , [email protected]
Page 29
factors behind the HFS is not homogenous for all localities. It causes the need of
[image:10.612.114.503.214.453.2]identification of the locality specific variables having significant implications on HFS.
Table 5 : Percentage of food secure household across localities
Localities
Food secure
household as per
food
expenditure
threshold
Food secure
household as per
income threshold
Household in
threshold gap
(% HFS IT - % HFS
ET)*
PCI ICMR PCI ICMR PCI ICMR
Pooled data 25.00 47.60 32.40 56.00 7.4 8.4
Majuli 28.85 48.08 30.77 67.31 1.92 19.23
Dhekorgara 24.68 55.84 48.05 53.25 23.37 -2.59
Kaliapani 20.00 35.00 20.00 50.00 0 15
Baghsung 27.87 49.18 26.23 55.74 -1.64 6.56
* IT = Income threshold, ET = Expenditure threshold
6. Identifying Major Variables
Using the logistic probability model stated in section 4 and having solution through SPSS
version 17.0 opting for its backward elimination process, the significant variables
identified in different localities as per different scales are shown in table 6. Of the HFS
variables given in table 1, care on healthy diet, dependency ratio and aspired income are
mainly implicated with demand side elements whereas income, food collected in wild,
government support, quality of farming land, access to PDS, size of household land,
disaster loss, out migration are mainly implicated with of supply side. Literacy status and
age of household heads, caste, religion, size of household disposable asset, family pattern
A Monthly Double-Blind Peer Reviewed Refereed Open Access International e-Journal
Website: www.aarf.asia. Email: [email protected] , [email protected]
Page 30
caste, sex of household age, age of household head, aspired income and out migration
were not found significant in determining household food security in the study area.
[image:11.612.168.448.188.727.2]
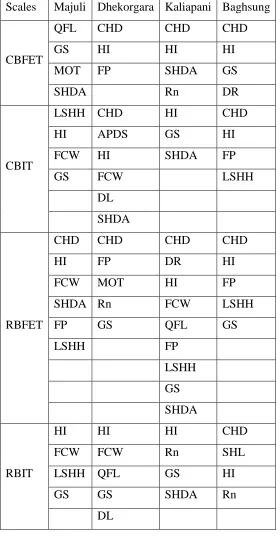
Table 6 : Mapping of significant variables having implications on HFS
Scales Majuli Dhekorgara Kaliapani Baghsung
CBFET
QFL CHD CHD CHD
GS HI HI HI
MOT FP SHDA GS
SHDA Rn DR
CBIT
LSHH CHD HI CHD
HI APDS GS HI
FCW HI SHDA FP
GS FCW LSHH
DL
SHDA
RBFET
CHD CHD CHD CHD
HI FP DR HI
FCW MOT HI FP
SHDA Rn FCW LSHH
FP GS QFL GS
LSHH FP
LSHH
GS
SHDA
RBIT
HI HI HI CHD
FCW FCW Rn SHL
LSHH QFL GS HI
GS GS SHDA Rn
A Monthly Double-Blind Peer Reviewed Refereed Open Access International e-Journal
Website: www.aarf.asia. Email: [email protected] , [email protected]
Page 31
6.1 Mapping the variables as per occurrence score
The significant variables of household food security can be mapped as per its locality
occurrence in the list given in table 6. The maximum locality occurrence score is 4 as
there are four localities under study and minimum is zero implying that in a locality the
variable has not been identified as significant. Table 7 records the locality occurrence
score of the variables as per scales. The more is the column variance the less is the unique
in the occurrence of the variables across localities. No scale shows unique pattern of
occurrence implying that they are not equally important in food security determination in
all localities. The more is the total occurrence score maximum being 16, the more is
equality in the significance of variable in determining HFS and vice versa. Not a single
determinant shows universal occurrence in the localities irrespective of scales. With this
consideration the most equally important significant variable is household income, the
second most ones are govt. support and care on healthy diet. First two are supply side and
the last one is demand side significant determinant of HFS.
Table 7 : Occurrence scores of variables across localities recognized as significant
Variables
Thresholds
Total
score
Expenditure Income
CBF
ET
RBFE
T CBIT
RBI
T
Household income (HI) 3 3 4 4 14
Literacy status of household head (LSHH) 0 3 2 1 6
Family pattern (FP) 1 4 1 0 9
Religion (Rn) 1 1 0 2 4
Food collected in wild (FCW) 0 2 2 2 6
Access to PDS (APDS) 0 0 1 0 1
A Monthly Double-Blind Peer Reviewed Refereed Open Access International e-Journal
Website: www.aarf.asia. Email: [email protected] , [email protected]
Page 32
Disaster Loss (DL) 0 0 1 1 2
Care on healthy diet (CHD) 3 4 2 1 10
Main occupation type (MOT) 1 1 0 0 2
Dependency ratio (DR) 1 1 0 0 2
Size of household disposable asset (SHDA) 2 2 2 1 7
Govt. support (GS) 2 3 2 3 10
Size of household land (SHL) 0 0 0 1 1
8. Conclusion
Household food insecurity is the reverse of household food security. In jorhat district, as
revealed by the four case studies, household food insecurity, as per FAO guideline, is
alarmingly high. But it is still a neglected area of study so far the food security literature
at local context is concerned. No household food security monitoring as per its recent
definition and concept is inherent in government functionary of India. Indian official
poverty scale is a case of debatable for several decades. It is blamed being a hunger scale
than a poverty scale. In a country like India growing per year more than 8 percent on
average, and more than 30 percent household accessing to middle class life style, the
poverty scale in its present formulation demands its sustenance only on political ground,
but to recognize India as a prime world power, this scale needs modification at least
updated as per recent formulation of household food security (such as using FAO scale)
to make it more reflective of societal growth on the ground of justice. Present case study
reveals that, though Jorhat is one of the economically advanced districts of the state of
Assam, of its rural localities, 75 percent households are food insecure as per PCI and
67.60 percent as per ICMR food expenditure cut off. Locality variance in household food
insecurity is in between 71.15 percent and 80 percent as per PCI and in between 51.95
percent and 80 percent as per ICMR food expenditure cut off. This situation improves to
some extent when income cut off is considered. It is 52.40 percent varying in between
43.16 percent and 65 percent as per PCI scale whereas 44 percent varying in between
A Monthly Double-Blind Peer Reviewed Refereed Open Access International e-Journal
Website: www.aarf.asia. Email: [email protected] , [email protected]
Page 33
households are below poverty line, they are actually below hunger line as the critics like
to say, reflecting household food security neither from demand side nor from supply side.
The percentage of food insecure household as per expenditure threshold being higher
than that of income threshold interestingly reflects that a good number of households
being sound in income do not make food expenditure as per balanced diet norms. This is
demand side lapse of household food security. Present study traces household income,
government support and care on healthy diet as three leading significant determinants of
household food security. It shows that households’ own effort to earn and government
support to this effort matter in household food security. Both are supply side
determinants. Care on healthy diet being demand side determinant though matters here
but unnoticed and uncared. The Public Distribution Mechanism now prevalent in India,
even enriched with recent food security bill cares basically the supply side of household
food security. In the study area household food insecurity is as high as 80 percent as per
expenditure cut off. It ensures the presence of food insecurity in middle class families too
not because dearth of income but because lack of proper knowledge on healthy diet and
healthy living. In this situation, the urge for non-food basic expenditures just like costly
mobile hand set, net pack there in just to check social account is expected to erode the
food expenditure below its cut off mark. Separate study is deserved.
Occurrence of significant variable is affected both by locality difference and difference in
the base of the cut off scales. Its locality variation justifies the need of micro or area
specific study of household food security whereas variation in base specific occurrence
justifies consideration of demand and supply side determinants of household food
security separately. It is to note that expenditure thresholds are oriented to demand side
A Monthly Double-Blind Peer Reviewed Refereed Open Access International e-Journal
Website: www.aarf.asia. Email: [email protected] , [email protected]
Page 34
REFERENCES
1. Amaza, P.S., Umeh J.C., Helsen, J., & Adjobi, A.O. (2006). Determinants and
Measurement of Food Security in Nigeria : Some Empirical Policy Guide, IAAE Annual
Meeting, August 12-18, Queensland, Australia.
2. Barnum, H. & Squire, L. (1979). A Model of an Agricultural Household, Occasional Paper
– 27, World Bank, Washington D. C.
3. Basir, M.K., Steven Schilizzi & Ram Pandit (2012). Food Security and Its Determinants at
the Crossroads in Punjab, Pakistan, Working Paper 1206. School of Agricultural and
Resource Economics, http://www.are.uwa.edu.au
4. FAO (1996). World Food Summit Plan of Action, FAO, Rome
5. Kidane, H., Alemu, Z.G. & Kundhlande, G. (2005). Causes of Household Food Insecurity
in Koredegaga Peasant Association, Oromiya Zone, Ethiopia, Agrecon, Vol 44, No 4.
6. Nandi, B.K. (1999). Nutritional Security: Asian Perspective Beyond 2000, RAP WP - 1/1.
7. Quisumbing, A.L., Haddad, L. & Pena, C. (1995). Gender And Poverty: New Evidence
From 10 Developing Countries, FCND DP – 9, IFPRI, Washington D.C.
8. Strauss, J. (1983). Socioeconomic Determinants of Food Consumption and Production in
Rural Sierra Leone: Application of an Agricultural Household Model with Several commodities, MSU International Development Papers, No. 5. Department of Agricultural Economics, East Lansing, Michigan 48824-1039.
9. Swaminathan, M.S. (2001). Food Security and Sustainable Development, Current Science,
81(8): 948-954.