CHAPTER 11
Evolution of the Human Life Cycle
BARRY BOGIN and B. HOLLY SMITH
INTRODUCTION
What Are the Big Questions?
Why should a human biologist study the evolution of the human life cycle? The reason is because, for multicellular organisms, most major evolutionary change proceeds by alterations in life cycles, that is, the patterns of growth, development, and maturation (Bonner 1965). The human species is no exception, which means that the biological and behavioral characteristics of human beings, including those shared with other mammals and those that set our species apart from all others, are derived from the features of our life cycle.
BOX 11.1 CHARLES DARWIN ON THE HUMAN PLACE IN NATURE
The shared features of growth, development, and maturation among mammals are, for the most part, due to a common evolutionary origin. Different species may also share traits due to a process called convergence, an example being convergence toward a streamlined body that minimizes water resistance in both fish and marine mammals. Commonalities in developmental biology and behav-ior were a source of support for Charles Darwin's hypotheses on human evolu -tion. In his book The Descent of Man and Selection in Relation to Sex, Darwin (1871) wrote about growth and development before birth:
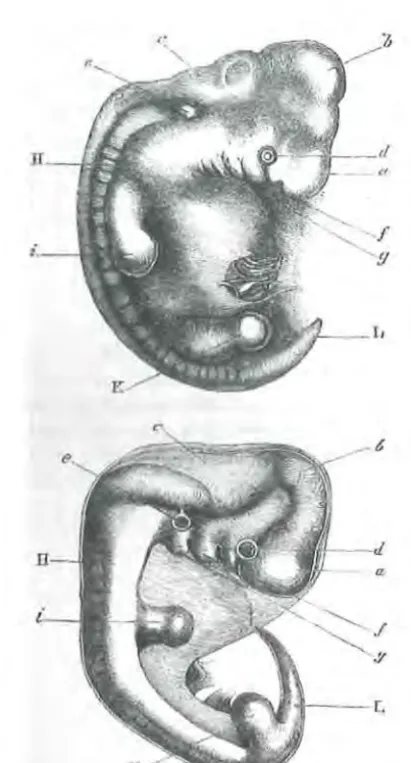
Embryonic Deve/opment.-Man is developed from an ovule, about the 125th of an inch in diameter, which differs in no respect from the ovules of other animals. The embryo itself at a very early period can hardly be distinguished from that of other members of the vertebrate kingdom. At this period the arteries run in arch-like branches, as if to carry the blood to branchia: which are not present in the higher vertebrata, though the slits on the sides of the neck still remain (f, g, fig. 1), marking
(Continued)
Human Biology: An Evolutionary and Biocu/tura/ Perspective, Second Edition. Edited by Sara Stinson, Barry Bogin, Dennis O'Rourke.
© 2012 John Wiley & Sons, Inc. Published 2012 by John Wiley & Sons, Inc.
their former position. At a somewhat later period, when the extremities are devel-oped, "the feet of lizards and mammals," as the illustrious Von Baer remarks, "the wings and feet of birds, no less than the hands and feet of man, all arise from the same fundamental form." It is, says Prof. Huxley,10 "quite in the later stages of development that the young human being presents marked differences from the young ape, while the latter departs as much from the dog in its developments, as the man does. Starling as this last assertion may appear to be, it is demonstrably true."
As some of my readers may never have seen a drawing of an embryo, I have given one of man and another of a dog, at about the same early stage of development. 10 'Man's Place in Nature," 1863, p. 67.
Quote taken from Darwin Online, http://darwin-online.org.uk/
Darwin's figure 1 is reproduced here as our Figure 11.1. Readers may also consult the work of Dr. Gina Kohts (http://www.kohts.ru/ladygina-kohts_n.n./ichc/html/ apes02.html; de Waal 2009), who in the early 20th century carried out detailed comparative studies of growth, development, and behavior between humans and chimpanzees.
Darwin also wrote of some novel features of human development. In his next book, The Expression of Emotions in Man and Animals, Darwin (1872) wrote of "Special Expressions of Man: Suffering and Weeping" (p. 147). Darwin was one of the first scientists to include photographs in his books, and these included photographs of human infants crying and screaming. Based on the information available at the time, Darwin believed that only human infants and children expressed distress via long bouts of screaming and crying. Darwin wrote that this special behavior of people is due to human features of anatomy and cogni-tion, which are not shared by other mammals. Since Darwin's time, it has been confirmed that other species of mammals do scream and cry (http://www. janegoodall.org/chimpanzee-crying, http://carta.anthropogeny.org/moca/topics/ unconsolable-infant-crying). Research by Ronald Barr finds that crying "results in care giving responses that can be positive (e.g. increase caregiver investment, nutrition and caring) or negative (abuse)." Barr adds that the shedding of tears during emotional distress may be unique to, or especially well developed in, humans.
These examples from the work of Darwin to the present are provided to explain that the human place in nature, as viewed by evolutionary biologists, balances the physical and behavioral characteristics that are shared with other species against those that are found only in the human species. In this chapter, we are concerned with both the shared and the "human only" characteristics as these relate to the human life cycle.
INTRODUCTION 517
Figure 11.1 Figure 1 from Darwin (1871) The Descent of Man and Selection in Relation to Sex. Darwin's legend for the figure reads, "Upper figure human embryo, from Ecker. Lower figure that of a dog, from Bischoff. a. Fore-brain, cerebral hemispheres, &c., b. Mid-brain,
corpora quadrigemina., c. Hind-brain, cerebellum, medulla oblongata., d. Eye., e. Ear. ,f. First visceral arch., g. Second visceral arch., H. Vertebral columns and muscles in process of devel-opment., i. Anterior-extremities., K. Posterior, L. Tail or os coccyx."
The major points of this chapter are the following:
(1) Human beings have a relatively long period of gestation and four stages of growth and development between birth and adulthood. These postnatal stages are infancy, childhood, juvenile, and adolescence.
(2) Long gestation relative to body size is a trait shared with the other apes. The infant and juvenile stages are shared with most nonhuman primates, social carnivores, elephants, and many cetaceans (e.g., whales, porpoises). Childhood and adolescence, as defined here, are human species-specific features.
[image:3.527.118.324.59.441.2](3) Human childhood and adolescence evolved because they confer reproduc-tive advantages, increasing the fertility of parents and reducing the mortality of their offspring. This is classic natural selection.
( 4) Adolescence may also have evolved by sexual selection, in which sex-specific features of adolescent girls and boys enhance opportunities for survival and mating. The biology and behavior of human adolescence also promotes an apprenticeship-type system of learning and practice of the wide variety of economic, social, political, and sexual skills needed adulthood and successful reproduction.
HUMAN GROWTH AND HUMAN BIOLOGY
The study of human growth has been a part of anthropology and human biology since the founding of these disciplines. European "anthropology" of the early to mid-19th century was basically a combination of anatomy and anthropometry, the science of human body measurements. American anthropology of the late 19th century incorporated anthropometry into its foundation, and the early practitioners, especially Franz Boas, are known as much for their studies of human growth as for anything else (see Chapter 2 by Johnston and Little).
An interest in human growth is natural for anthropologists and human evolu-tionary biologists for two reasons: (1) the way a human being grows is the product of interactions between the biology of our species, the physical environment in which we live, and the social, economic, and political environment that every human culture creates; and (2) because, alteration in the pattern of growth, develo-pment, and maturation is a major mechanism of evolutionary change. Human growth and development, therefore, reflect the biocultural nature and evolutionary history of our species. The basic pattern of human growth is shared by all people and is the outcome of the 6-7 million-year evolutionary history of the
hominins (the term "hominin" has come to replace the earlier term "hominid" as a category including living human beings and those fossil ancestors showing some degree of bipedal locomotion; see Wood and Lonergan 2008 for terminology and taxonomy).
GROWTH AND EVOLUTION
If there is a "secret" to life, it is hidden in the process that converts a single cell,
with its complement of deoxyribonucleic acid (DNA) into a multicellular organism
composed of hundreds of different tissues, organs, behavioral capabilities, and emo-tions. That process is no less wondrous when it occurs in an earthworm, a whale, or a human being. Because this book is about human biology, in this chapter, we focus on the process of human growth and development; however, the reader must be aware that much of what we know about human growth is derived from research on nonhuman animals, in part due to the ethical limits on the kind of experimental research that may be performed on human beings.
BASIC PRINCIPLES OF HUMAN GROWTH AND DEVELOPMENT 519
et al. 1984). The most common definition of a homeobox is a highly conserved sequence of about 180 DNA base pairs that code for a 60-amino-acid segment of protein that regulates patterns of development. Genes containing homeoboxes are found in all eukaryotic genomes and are associated with cell differentiation and bodily segmentation during embryologic development. Additional evidence for common evolutionary origins was published in 1995 with the identification of PAX6 as a master control gene for eye development (Halder et al. 1995; Callaerts et al. 1997; Gehring 1998) in virtually all organisms that possess one or more eyes. This discovery led to a new hypothesis about the monophyletic origin of the eye in evolu-tion. The PAX6 eye gene is common to species as diverse as marine worms, squid, fruit flies, mice, and humans. In contrast, the unique features of the life cycle of dif-ferent species, such as metamorphosis in insects and amphibians, or childhood in human beings, attest to the ongoing evolution of life on Earth.
Biological evolution is the continuous process of genomic-phenotypic adaptation of organisms to their environments. Natural selection determines the direction of evolutionary change and operates by differential mortality between individual organisms prior to reproductive maturation and by differential fertility of mature organisms. Thus, genetic/genomic and phenotypic adaptations that enhance the sur-vival of individuals to reproductive age and that increase the production of similarly successful offspring will increase in frequency in a population.
BASIC PRINCIPLES OF HUMAN GROWTH AND DEVELOPMENT
Before we explore the evolution of the human life cycle, let us review some of the basic principles of human growth and development. Human beings, like most animals, begin life as a single cell, the fertilized ovum, via sexual reproduction (see the section on "Epigenetics" in this chapter for exceptions). In normal human con-ception and development, the genetic information provided by each parent, the phenotypic environment of the mother's ovum, and the biocultural environment in which the mother lives interact in complex ways to guide the fertilized ovum to divide, grow, differentiate, and develop through many stages, including embryo and fetus, prior to birth.
Although growth and development may occur simultaneously, they are distinct biological processes. Growth may be defined as a quantitative increase in size or mass. Measurements of height or weight indicate how much growth has taken place in a child. Additionally, the growth of a body organ, such as the liver or the brain, may also be described by measuring the number, weight, or size of cells present. Development is defined as a progression of changes, either quantitative or qualita-tive, that lead from an undifferentiated or immature state to a highly organized, specialized, and mature state. Maturity is measured by functional capacity. An example is the development of motor skills from crawling to toddling in an infant, to mature human walking in a juvenile. These different levels of maturity in skills of locomotion are dependent on the development of the skeletal, muscle, and nervous systems and their integration. Even though these definitions are broad, they allow us to consider the growth, development, and maturation of organs (e.g., kidneys), systems (e.g., the reproductive system), and the person.
STAGES IN THE LIFE CYCLE
The life cycle of an organism includes stages of growth, development, and matura-tion from concepmatura-tion to death. Many of the basic principles of human growth, development, and maturation are best presented in terms of the events that take place during the life cycle. One of the many possible orderings of events is given in Table 11.1, in which growth periods are divided into developmentally functional stages. This is only one possible ordering, because declaring that one moment (e.g., fertilization) is the beginning of life is arbitrary in a continuous cycle that passes through fixed stages in each individual person and in generation after generation.
Prenatal Development
The course of pregnancy may be divided into three periods, or trimesters. During the first trimester, one of the major events is the multiplication of a single cell, the fertilized ovum, into tens of thousands of new cells. At first, cell division may produce exact copies of the original parent cell. However, within hours of the first division, distinct groups of cells begin to form. The rate of cell division in the sepa-rate groups is unequal; these cells have begun to differentiate and will eventually form different kinds of tissue (the "germ layers" of endoderm, mesoderm, and ecto-derm) that will constitute the growing embryo. Growth, an increase in cell number, and development (in this case, cellular differentiation) begin almost simultaneously with conception.
Although the human body is composed of dozens of kinds of tissues and organs, their generation and growth during prenatal life, and postnatal life as well, take place through a few ubiquitous processes. Goss (1964, 1978) described two types of cellular growth: hyperplasia and hypertrophy. Hyperplasia involves cell division by mitosis. For instance, epidermal cells of the skin form by the mitotic division of germinative cells, also called stem cells, in the deep layers of the skin. Hypertrophic growth involves the enlargement of already existing cells, as in the case of adipose cells growing by incorporating more lipid (fat) within their cell membranes.
STAGES IN THE LIFE CYCLE 521
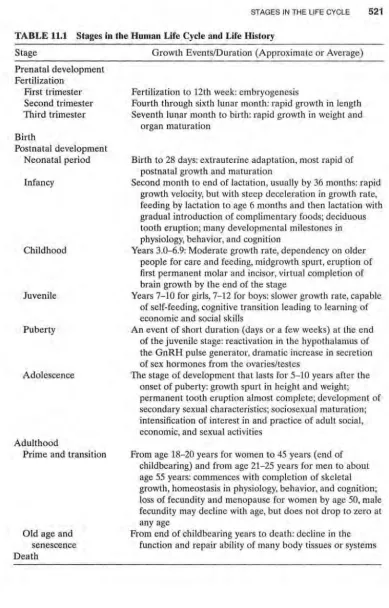
TABLE 11.1 Stages in the Human Life Cycle and Life History Stage
Prenatal development Fertilization
First trimester Second trimester Third trimester
Birth
Postnatal development Neonatal period
Infancy
Childhood
Juvenile
Puberty
Adolescence
Adulthood
Prime and transition
Old age and senescence Death
Growth Events/Duration (Approximate or Average)
Fertilization to 12th week: embryogenesis
Fourth through sixth lunar month: rapid growth in length Seventh lunar month to birth: rapid growth in weight and
organ maturation
Birth to 28 days: extrauterine adaptation, most rapid of postnatal growth and maturation
Second month to end of lactation, usually by 36 months: rapid growth velocity, but with steep deceleration in growth rate, feeding by lactation to age 6 months and then lactation with gradual introduction of complimentary foods; deciduous tooth eruption; many developmental milestones in physiology, behavior, and cognition
Years 3.0-6.9: Moderate growth rate, dependency on older people for care and feeding, midgrowth spurt, eruption of first permanent molar and incisor, virtual completion of brain growth by the end of the stage
Years 7-10 for girls, 7-12 for boys: slower growth rate, capable of self-feeding, cognitive transition leading to learning of economic and social skills
An event of short duration (days or a few weeks) at the end of the juvenile stage: reactivation in the hypothalamus of the GnRH pulse generator, dramatic increase in secretion of sex hormones from the ovaries/testes
The stage of development that lasts for 5-10 years after the onset of puberty: growth spurt in height and weight; permanent tooth eruption almost complete; development of secondary sexual characteristics; sociosexual maturation; intensification of interest in and practice of adult social, economic, and sexual activities
From age 18-20 years for women to 45 years (end of childbearing) and from age 21-25 years for men to about age 55 years: commences with completion of skeletal growth, homeostasis in physiology, behavior, and cognition; loss of fecundity and menopause for women by age 50, male fecundity may decline with age, but does not drop to zero at any age
From end of childbearing years to death: decline in the function and repair ability of many body tissues or systems
522
of static tissues cannot be renewed if damaged or destroyed. The destruction of the central nervous system (CNS) tissue, such as regions of the brain as a result of accident or stroke, often means the permanent loss of the damaged cells and the functions they once performed (although there is evidence that some CNS tissue is renewable or can be induced to renew; Lin et al. 2006). Perhaps as compensation for lack of mitotic ability, many static tissues may live as long as the person survives, unlike renewable tissues that tend to have short lives.
The biological substrate of the individual is not permanent. From embryonic life through adulthood, the human body is in a constant state of decomposition and reorganization. Young adult men renew about 2-3% of their muscle mass each day.
In infancy, when new muscle tissue is forming by hyperplasia, the rate of protein renewal is about 6-9% per day. The magnitude of this metabolic renewal may be appreciated by the fact that much of the basal metabolic rate of the body (which may be measured by the heat that the body produces when at complete rest) is due to protein turnover. A similar turnover of cellular material occurs in other static tissues, such as nerve cells in the body and in the brain, and in expanding tissues. Tanner (1990, pp. 25-26) wrote,
This dynamic state enables us to adapt to a continuously changing environment, which presents now an excess of one type of food, now an excess of another; which demands different levels of activity at different times; and which is apt to damage the organism. But we pay in terms of the energy we must take in to keep the turnover running. Enough food must be taken in to provide this energy, or the organism begins to break up.
During the years and decades of life, the turnover and renewal of the molecular constituents of a human being's cells must take place often enough to recreate the entire body many times over.
The metabolic dynamic of the human organism is most active during the first trimester of prenatal life. The multiplication of millions of cells from the fertilized ovum-and the differentiation of these cells into hundreds of different body parts-makes this earliest period of life highly susceptible to growth pathology caused by either the inheritance of genetic mutations or exposure to harmful environmental agents that disrupt the normal course of development (e.g., certain drugs, smoking,
malnutrition, disease, and psychological trauma that the mother may experience). Due to these causes and others, one study estimated that -10% of human fertiliza-tions fail to implant in the wall of the uterus, and of those that do, -50% are spon-taneously aborted (Werner et al. 1971; see also Chapter 15 of this book by Ellison et al. on "Pregnancy Loss and Female Fecundity"). It is consoling to know, perhaps,
that most of these spontaneous abortions occur so early in pregnancy that the mother is not aware that a conception took place.
STAGES IN THE LIFE CYCLE 523
and by the sixth month, between 356 and 381 mm (-14 in.), which is -70% of average birth length. An educational web site on human prenatal development, maintained by Dr. Mark Hill, found at http://php.med.unsw.edu.au/embryology/ index.php?title=Main_Page, has useful illustrations and animations.
Increases in weight during this same period are much less rapid. Eight weeks after conception, the embryo weighs 2.0-2.7 g (0.08 oz.), and by the sixth month, the fetus weighs only 700 g (1.5 lb ), which is -20% of birth weight. It is during the third trimester of pregnancy that growth in weight takes place at a relatively faster rate. During the third trimester, several physiological systems (e.g., circulatory, respi-ratory, and digestive) also develop and mature, preparing the fetus for the transition to extrauterine life after birth.
The prenatal stage of the mammalian life cycle encompasses greater amounts of growth, development, and maturation than any other stage. The prenatal gestation of all the apes, including the human ape, takes a long period of time com-pared with nonprimate mammals, particularly long for our body size. Compare the average gestation length in days for humans = 266, chimpanzees = 240, goril-las = 240, and the orangutan = 260 with, for example, the African lion = 110, which is less than half that of the apes. Female lions have an adult body mass of about 150 kg, which is more than twice the 68 kg average of female body weight for humans and chimpanzees. Even the longest gestation in mammals, the African elephant = 640 days, is not extremely long given the immense size of a female African elephant, about 5000 kg. In proportion to adult female body weight, human and chimpanzee gestation is about five times longer than that of lions (chimpanzee, 240/68 = 3.5; lion 110/150 = 0.73), and about 27 times longer than that of elephants (640/5000 = 0.13).
Indeed, whether we use simple ratios or more complex equations, it has been well demonstrated that the mother's body weight is secondary to the offspring's brain weight in explaining the length of gestation in broad comparisons across mammals (Sacher and Staffeldt 1974). And Primates, as an order of mammals, have both relatively large brains and long gestations. This reaches its extreme in the apes, but it is still not clear if the large brain size of the apes is one of the consequences, or perhaps the cause, of long gestation (Leigh 2004). Prenatal life is, in fact, the most critical period for the formation of most of the body's anatomical and physiological systems. Critical periods in developmental biology are times during the life cycle when one or more properties of the organism must grow or develop or when this property develops most rapidly (Cameron and Demerath 2002). Due to the restricted time frame for growth or development, and the velocity of development, these criti-cal periods are usually highly susceptible to alteration by the environment. A well-known example of a critical period is imprinting in birds, which for greylag geese is the 13-16 hours after hatching when the chick will become programmed to follow the first moving object seen, usually its parents (Lorenz 1935). Human prenatal life has many critical periods, for example, maternal exposure to "German measles" (rubella) in the first 3 months of pregnancy is associated with a high risk of birth defects.
Developmental Origins of Health and Disease A very active area of research
related to critical periods is the developmental origin of health and disease (Devel-opmental Origins of Health and Disease [DOHaD), http://www.dohadsoc.org/).
As early as 1927, V.P.A. Derrick, A.R. Davidson, and A.R. Reid found that adult mortality in England and Wales depended on years of birth (see Smith and Kuh 2001). A few years later, Kermack et al. (1934) confirmed the association between year of birth and rates of adult mortality for England, Scotland, and Sweden. Even more to the point, Kermack et al. found that "infantile mortality is dependent in large measure on improvement in maternal health (2001 reprint, p. 683). Kermack and colleagues also suggested that the environmental condition up to age 15 years was key to later health and mortality risk. By implication, improvements in maternal health would have to take place before age 15 of the mother to have an impact infant mortality a generation later. Fifty-two years later, Emanuel (1986) formalized these findings into the "intergenerational effects hypothesis" [IEH], defined as "those factors, conditions, exposures and environments experienced by one genera -tion that relate to the health, growth and development of the next generation." Working with British data, Emanuel et al. (1992) found that the birth weight of a woman, her health history during infancy and childhood, and her adult stature (which reflects the total history of her growth and development) are strong predic-tors of the birth weight of her offspring. Many human epidemiological and anthro-pological studies support the IEH (Drake and Walker 2004; Varela-Silva et al. 2009) and experimental studies confirm the power of intergenerational effects (Drake et al. 2007; Benyshek et al. 2008).
Other DOHaD research focuses on the "fetal origins" hypothesis (Barker 1990; Benyshek 2007; Kuzawa 2007; Gluckman et al. 2009) to explain the origins of several adult chronic illnesses such as coronary heart disease and diabetes. As stated by Kuzawa (2004, p.194), "The fetal origins hypothesis proposes that intrauterine nutri-tion influences the development of various hormonal systems and organs, with lasting effects on adult risk for cardiovascular disease." The hypothesis has been expanded to other adult diseases, such as diabetes and obesity. Postnatal environ-ments during infancy and childhood are also proving to be important for the devel-opment of health or the risks for disease in later life (Bailey and Schell 2007; Bogin and Varela-Silva 2010; McDade et al. 2010). Human biologists and biological anthro-pologists are at the forefront of this research, due to their cross-cultural and
evolu-tionary perspectives. 1
I
Epigenetics Interactions between the environment and genome of the mother
I
and her embryo/fetus are now known to influence both the risks for disease (Kuzawa and Sweet 2009) and the normal range of growth, including development of adipose tissue (Mostyn and Symonds 2009) and muscle tissue (Du et al. 2010). Epigenetics refers to changes in gene expression caused by mechanisms other than changes in the underlying DNA sequence. Epigenetic mechanisms such as DNA methylation, histone acetylation, and micro RNA interference (Fig. 11.2) can affect gene activa-tion and inactivaactiva-tion; methylation, for example, inactivates or represses gene expres-sion. Epigenetic mechanisms may be activated by exposure to temperature extremes,
exposure to disease, excess or lack of dietary factors, and many behavioral practices \
including physical activity, smoking, and alcohol consumption. Segars and
Aagaard-Tillery (2009, p. 349) wrote that epigenetic mechanisms "are increasingly understood \
EPIGENETIC MECHANISMS
are affected by these factors and processes: • Development (In utero, childhood) • Environmental chemicals • Drugs/Pharmaceuticals •Aging
• Diet
CHROMOSOME
STAGES IN THE LIFE CYCLE 525
HEALTH ENDPOINTS • Cancer
• Autoimmune disease
• Mental disorders
• Diabetes
Histone modification
EPIGENETIC FACTOR
The binding of epigenetic factors to histone Histones are proteins around which "tails" alters the extent to which DNA is
DNA can wind for compaction and L-~-~~~~~~~~~ wrapped around histones and the availability
gene regulation. of genes in the DNA to be activated.
Figure 11.2 Two epigenetic mechanisms: DNA methylation and histone acetylation (Image:
http://nihroadmap.nih.gov/EPIGENOMICS/epigeneticmechanisms.asp ). See color insert.
Epigenetic expression in the phenotype may be a heritable change in biology or behavior, but a change that does not alter DNA sequence. In this sense, epigenetic biology is a departure from the traditional genetic dogma of
DNA~ amino acid ~polypeptide chain~ protein.
The flow of information in epigenetic biology may begin with a social factor, such as the decision of families to migrate from a poorer country to a richer country or the choice by a woman to deliver an infant via Caesarian section (C-section). In the first case, second-generation Bangladeshi women, that is, the daughters of women who migrated to the United Kingdom, have higher levels of salivary progesterone and higher ovarian function than first-generation migrants. The difference in pro-gesterone level is in part due to greater methylation of the progesterone receptor protein in the first-generation migrants, who grew up in Bangladesh (O'Connor et al. 2009). Why this is so, is not known, but a consequence of elevated progesterone levels is greater risk for breast cancer in the second-generation women (Nufiez-De La Mora et al. 2008). In the second case, women giving birth by C-section deliver infants with greater DNA methylation in general (Schlinzig et al. 2009). Why this is so, and how it influences later health is unknown, but infants delivered by C-section have an, "increased risk for allergy, diabetes and leukaemia" (Schlinzig et al. 2009, p. 1096). In a more general sense, the traditional "gene-to-protein" dogma is chang-ing to a perspective of greater environmental control of genomic programming and DNA expression. Several nutrients, such as vitamins A, C, niacin, and D are known
[image:11.524.32.416.46.327.2]to regulate DNA activity and be related to diseases such as diabetes, atherosclerosis,
and cancer (Kato et al. 2007; McGrane 2007). A socioeconomic factor such as poverty can influence the availability of vitamin D due to limited food choices. Vitamin D is found in a small number of foods, such as expensive oily fish, for example, salmon, in liver, and in eggs, which poor families may not eat on a regular basis. Low socioeconomic status (SES) may also lead to a lack of exposure to sun-light due to the need to work at low-paid indoor jobs. Humans get most of their vitamin D from sunlight (ultraviolet radiation) striking the skin and converting cholesterol-based substances into precursors of vitamin D (see Chapter 6).
In this case, the flow of epigenetic information is as follows:
Social-economic-political forces producing poverty
~inability to purchase vitamin-D-containing foods I low sunlight exposure
~low bioavailability of vitamin D ~low transactivation of DNA expression
~ low amino acid production~ insufficient protein~ possible harm to health.
An important human example is risk for the disease multiple sclerosis (MS). Many studies show that people living at northern latitudes, with low exposure to sunlight, low vitamin D intake, and with a specific genetic variant of the major histocompat-ibility complex (MHC) on chromosome 6, are at greater risk toMS (Ramagopalan et al. 2009). People with the same MHC genetic variant but with adequate vitamin D bioavailability have significantly lower risk for MS.
Other nutrients such as methionine and vitamins B6, B12, and folate are known
to be related to DNA methylation, and the availability of these nutrients during fetal development may influence susceptibility to complex diseases, such as diabetes and obesity (Chmurzynska 2010). Via this nutrient route, there is a connection between intergenerational effects, developmental origins, and epigenetic events.
Another epigenetic mechanism is genomic imprinting, a process that restricts gene expression to only the allele inherited from the mother or the father (also called parental imprinting). Earlier in this chapter, we discussed the sexual nature of most animal reproduction. Among vertebrates, some fish and a few reptiles may reproduce via parthenogenesis, the development of an unfertilized ovum into a
sexually mature adult female. In nature, successful parthenogenesis is prevented in
I
mammals, probably via the process of genomic imprinting. Most genes arenonim-printed and have biallelic expression (Lobo 2008). Healthy mammalian develop-ment seems to require allele expression from both the maternal and paternal alleles,
although a parthenogenic mouse has been produced in the laboratory (Kono 2006). 1 Some human examples of the deleterious effects of genomic imprinting are the I congenital conditions Prader-Willi and Angelman syndromes. Remarkably, both I are metabolic disorders due to the same DNA deletions in chromosome 15 (Knoll
STAGES IN THE LIFE CYCLE 527
two syndromes arise from the same DNA sequence, modified by two different epigenetic pathways of gene expression. More detail on these syndromes and other aspects of human epigenetics may be found at http://embryology.med.unsw.edu. au/MolDev/epigenetic.htm, an educational web site on the epigenetics of human development.
Birth
Birth is a critical transition between life in utero and life independent of the support systems provided by the uterine environment. The neonate moves from a fluid to a gaseous environment, from a nearly constant external temperature to one with potentially great volatility. The newborn is also removed from a supply of oxygen and nutrients (provided by the mother's blood and passed through the placenta, which also handles the elimination of fetal waste products) to reliance on his or her own systems for digestion, respiration, and elimination.
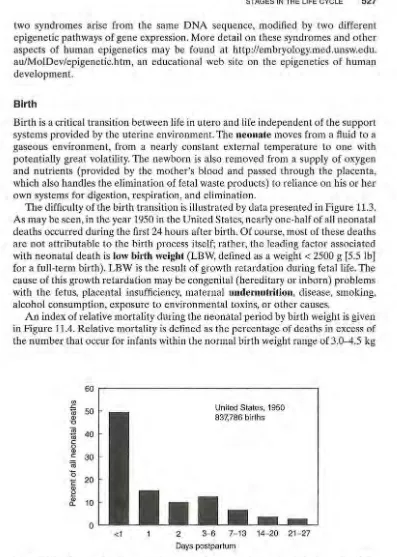
The difficulty of the birth transition is illustrated by data presented in Figure 11.3.
As may be seen, in the year 1950 in the United States, nearly one-half of all neonatal deaths occurred during the first 24 hours after birth. Of course, most of these deaths are not attributable to the birth process itself; rather, the leading factor associated with neonatal death is low birth weight (LBW, defined as a weight< 2500 g [5.5 lb] for a full-term birth). LBW is the result of growth retardation during fetal life. The cause of this growth retardation may be congenital (hereditary or inborn) problems with the fetus, placental insufficiency, maternal undernutrition, disease, smoking, alcohol consumption, exposure to environmental toxins, or other causes.
An index of relative mortality during the neonatal period by birth weight is given in Figure 11.4. Relative mortality is defined as the percentage of deaths in excess of the number that occur for infants within the normal birth weight range of 3.0-4.5 kg
(/)
.s:::
-ro
w '0
~
c0 w c (ij 0
E w ~
rf
60
50
40
30
20
10
0 <1
United States, 1950 837,786 births
2 3-6 7-13 14-20 21-27
Days postpartum
Figure 11.3 Percent of deaths occurring during the neonatal period (birth to day 28). Data from the United States, all registered births for 1950. These data are presented in lieu of more recent data because the technology for extraordinary neonatal medical care in existence today reduces neonatal deaths.
[image:13.524.28.425.44.601.2]£ -ro t::: 0 E Q) > · ~ Qj
a:
100
90
80
70
60
50
40
30
20
10
0
86.1
United States, 1950 837,786 births
1.0-1.49 1.5-1.99 2.0-2.49 2.5-2.99 3.0-4.49 4.5+
[image:14.517.102.411.45.244.2]Birth weight (kg)
Figure 11.4 Index of relative mortality by birth weight during the neonatal period. Data
from the United States, all registered births for 1950. Relative mortality is calculated as the
risk of death for an infant born at a given weight. Infants of normal birth weight, 3.0-4.5 kg (6.5-10 lb ), have a relative mortality of 1.0. Infants born at 2.5-3.0 kg (5.5-6.5 lb) have twice
the risk of death as infants with normal birth weights and so on. Data for the year 1950 are
displayed here because the mortality rates for more recent data may be influenced by medical technologies that can sustain the life of newborns with conditions that are eventually lethal.
(6.5-10 lb). These data are for infants at all gestational ages. Prematurity, defined
as birth before 37 weeks' gestation (full term is 40 weeks), may cause additional complications that increase the chances of neonatal death. However, an infant small for gestational age-that is, of LBW-is usually at greater risk of death than a pre-mature infant of the expected weight for gestational age.
There is also a strong relationship between LBW, with or without prematurity,
and SES. SES is a concept devised by the social sciences to measure some aspects
of education, occupation, and social prestige of a person or social group. In the year 2000, the incidence of LBW in the wealthy, higher-SES, developed nations was 7%
of all live births; in the poor, lower-SES, developing nations, the incidence was 19%, but as high as 27% in South-Central Asia (UNICEF 2004). Even in the United
States, the socioeconomic relationship with birth weight is strong. When educational attainment is used to estimate general SES, researchers found that 10.1% of births to women with less than 12 years of schooling had LBW, compared with 6.8% of births to women with 12 years and 5.5% to those with 13 or more years of formal
education (Taffel 1980). African-Americans show consistently lower average birth
weights and a greater percentage of LBW full-term newborns compared with European-Americans. In the year 2005, the mean birth weight and percent of LBW for U.S. blacks was 3105 g and 11.9%. For U.S. whites, these statistics were 3364 g and 5.32% (Jasienska 2009). Part of this difference is due to the lower SES of the blacks. However, when white and black women are matched for age, education, and
SES, black women still give birth to a higher percentage of LBW infants.
Some researchers suggest that ethnic or genetic factors determine the mean
dif-ference in birth weight. However, evidence shows that the lower birth weight of the
I I I
I
II
I
I
STAGES IN THE LIFE CYCLE 529
black infants is more likely due to the effects of slavery and several generations of discrimination in the postslavery period. Emanuel et al. (1992, 2004) and Jasienska (2009) made use of the IEH, which we discussed above. The researchers explained that SES matching for the current generation of adult black and white women ignores the social and biological history of the United States, Great Britain, and other nations that practiced slavery. The mothers and grandmothers of these black and white women were less likely to be equally matched for SES. The IEH predicts that the poor growth and development of women from older generations will have a lasting effect on the current generation.
Experimental research with rats shows that protein deficiency in the first genera-tion has harmful effects on glucose metabolism for at least the following two gen-erations, even when the daughters and granddaughters are adequately fed (Benyshek et al. 2006). Closer to home in an evolutionary sense, Price and Coe (2000) analyzed the birth weight of rhesus monkeys descended from small-for-date (i.e., weight rela-tive to gestation length) and large-for-date birth weight matrilines. Newborn males and females descended from the large-for-date mothers showed greater than normal birth weight. Females, but not males, descended from small-for-date mothers had lower than average birth weight. Price and Coe also found that the lower birth weight female newborns "were at higher risk of poor reproductive outcomes in adulthood, and they perpetuated the matrilineal birth weight pattern by selectively constraining the fetal development of their daughters" (p. 452). From these results, they conclude that (1) "female family members overwhelmingly account for the intergenerational transmission of birth weight in monkeys" (p. 456), and (2) "one pregnancy should not be viewed as an independent event, but as a manifestation of the reproductive health of the female's lineage overall" (p. 456). These conclusions for monkeys are also found for human beings in many studies (Jasienska 2009).
It is clear that birth weight is influenced by many factors. Several lines of research estimate the statistical variance in birth weight due to fetal genotype to be 10-31%, the variance due to maternal genotype to be 22-24%, and the variance due to non-genetic maternal and environmental factors to be 47-66% of the total variance (Robson 1978; Lunde et al. 2007). Because of the predominance of nongenetic factors, public health workers often use birth weight statistics as one indication of the well-being of a population.
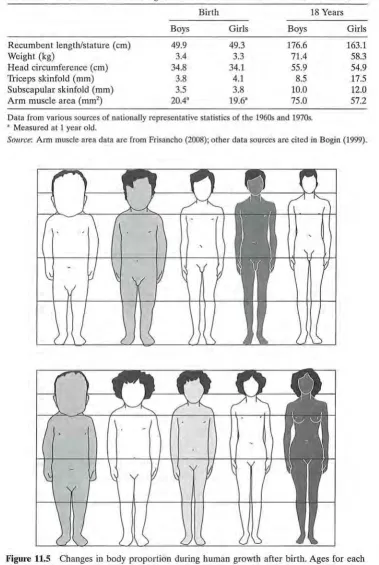
Weight at birth is only one measurement that is commonly taken to indicate the amount of growth that took place during prenatal life. Recumbent length (length of the body when lying down); circumference of the head, arm, and chest; and skin-folds are other measurements. Circumferences measure the contribution made by various tissues to the size of different body parts. For example, head circumference measures the maximum girth of the skull, which includes bone and, more impor-tantly, the size of the brain. Some representative data on size at birth and at 18 years of age for several measures are given in Table 11.2. At birth, sexual dimorphism (a difference in appearance or behavior between males and females) in size is biologi-cally insignificant. At 18 years of age, however, there is considerable dimorphism between the sexes in average stature, body weight, and fatness as measured by triceps and subscapular skinfolds.
From birth to adulthood, humans experience many changes in body size, shape, composition (e.g., fat, muscle, and water content), proportions, and skeletal forma-tion (Figs. 11.5 and 11.6). The importance of studying these contrasts between early
Birth 18 Years
Boys Girls Boys
Recumbent length/stature (em) 49.9 49.3 176.6
Weight (kg) 3.4 3.3 71.4
Head circumference (em) 34.8 34.1 55.9
Triceps skinfold (mm) 3.8 4.1 8.5
Subscapular skinfold (mm) 3.5 3.8 10.0
Arm muscle area (mm2
) 20.43 19.6" 75.0
Data from various sources of nationally representative statistics of the 1960s and 1970s. • Measured at 1 year old.
Girls
163.1 58.3 54.9 17.5 12.0 57.2
Source: Arm muscle area data are from Frisancho (2008); other data sources are cited in Bogin (1999).
I Figure 11.5 Changes in body proportion during human growth after birth. Ages for each \
profile are, from left to right, newborn, 2 years, 6 years, 12 years, 25 years. Leg length increases relative to total stature relatively more rapidly from birth to age 12 years and then more slowly to adulthood. The hair style and shading of the cartoon silhouettes are for artistic purposes and is not meant to imply any ethnic or eco-geographical phenotypic characteristics of the human species. Courtesy of Dr. J. V. Basmajian.
I I I
I
I
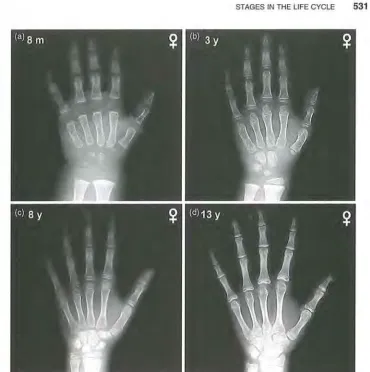
[image:16.517.79.458.55.620.2]STAGES IN THE LIFE CYCLE 531
Figure 11.6 Radiographs of the hand and wrist at different skeletal ages, illustrating the sequence of bone maturation events. All radiographs from healthy girls. (a) At 8 months after birth, most wrist bones and the growing ends of the finger bones (called epiphyses) are formed of cartilage. At certain X-ray exposures, this cartilage is "invisible." The image shows few centers of ossification (i.e., places where bone is present) in the wrist and few visible epiphyses. (b) At 3 years old, some wrist ossification centers are present, epiphyses of the radius are present, and most epiphyses of the hand are calcified (i.e., forming bone). (c) At 8 years old, all ossification centers are calcified. (d) At 13 years old, all bones have assumed final shape, but growth in size remains to be completed. Source: Gilsanz and Ratib (2005), with kind permission from Springer Science+ Business Media and the authors.
and later life is twofold. First, they allow clinicians and researchers to assess a child's
stage of biological maturation for different organs, tissues, or the body as a whole
independent of chronological age. Biological maturation is used to help determine whether a child is developing too slowly or too quickly, either of which may indicate the presence of some disorder. Second, the contrasts between early and later life
are also conceptually important. They show that the infant may take one of several
different paths for growth, maturation, and functional development.
[image:17.529.43.413.39.411.2]Plasticity refers to the ability of an organism to modify its biology or behavior to respond to changes in the environment, particularly stressful changes (Lasker 1969; Frisancho 1993). Adult human morphology, physiology, and behavior are plastic and in no way rigidly predetermined. Of course, people cannot sprout wings or breathe under water, but the sizes, shapes, colors, emotions, and intellectual abili-ties of people can be significantly altered by environmental stress, training, and
experience. When the biology and behavior of people are considered together (i.e.,
in a biocultural perspective), it seems that human beings are, perhaps, the most plastic of all mammalian species, hence one of the most variable and adaptable.
Postnatal Development
Life after birth can be divided into distinct periods in many ways. In this chapter,
as explained earlier, we use a four-stage model of human postnatal growth and
development-infant, child, juvenile, adolescent-between birth and adulthood (outlined in Table 11.1). The rationale for this model begins with an analysis of the
amount and rate of growth from birth to adulthood (more detailed explanation for
the four-stage model is found in Bogin 1999).
To visualize the amount and rate of growth that takes place during each of these
[image:18.517.135.396.383.574.2]stages, the growth in height (or length) for normal boys and girls is depicted in
Figure 11.7; growth in weight follows very similar curves. In Figure 11.7, the distance curve of growth, that is, the amount of growth achieved from year to year, is labeled on the right y-axis. The velocity curve, which represents the rate of growth during any 1 year, is labeled on the left y-axis. Below the velocity curve are symbols that
20 200
18
180 ~ 16
Q) 160
<-
14 E _£.12 140
E"
~ _£.
'(3
10 120 .E
0
Qi Ol
> 8 '(ii
.E 100 I
Ol
'(ii 6
I 80
4
2 M 60
0 40
0 2 4 6 8 10 12 14 16 18 20 22 Age (years)
Figure 11.7 Idealized mean velocity and distance curves of growth in height for healthy girls (dashed lines) and boys (solid lines) showing the postnatal stages of the pattern of human growth. Note the spurts in growth rate at mid-childhood and adolescence for both girls and boys. The postnatal stages: I, infancy; C, childhood; J, juvenile; A, adolescence; M, mature
adult; -W-, range of age for human weaning. Source: Data from Prader (1984) and Bock and
Thissen (1980).
I
STAGES IN THE LIFE CYCLE 533
indicate the average duration of each stage of development. Clearly, changes in growth rate are associated with each stage of development. Each stage may also be defined by characteristics of the dentition, changes related to methods of feeding, physical and mental competencies, or maturation of the reproductive system and sexual behavior.
Infancy Infancy is characterized not only by the most rapid velocity of growth of
any of the postnatal stages, but also by a steep decline in velocity, a deceleration. The infant's changing growth velocity continues the fetal pattern, in which growth rate in length peaks in the second trimester and then begins a deceleration that lasts until childhood (Fig. 11.8). As for all mammals, human infancy is the period when the mother provides all or some nourishment to her offspring via lactation or some culturally derived imitation of lactation. During infancy, the deciduous dentition (the so-called milk teeth) erupts through the gums. Human infancy ends when the child is weaned from the breast, which in preindustrialized societies occurs between 24 and 36 months of age (Sellen 2006). By this age, all the deciduous teeth have erupted, even for very late maturing infants.
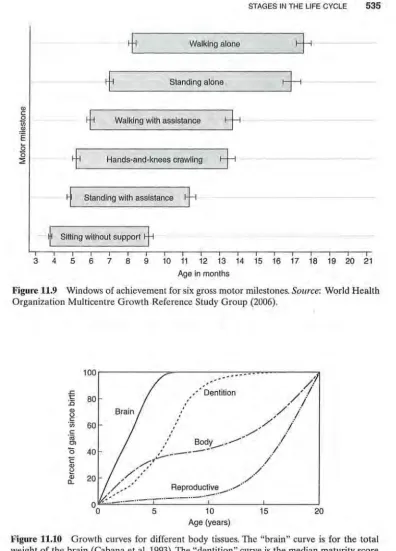
Motor skills (i.e., what a baby can do physically) develop rapidly during infancy. At birth, states of wakefulness and sleep are not sharply differentiated, and motor coordination is variable and transient. By 1 month, the infant can lift its chin when prone, and by 2 months, lift its chest by pushing up with the hands and arms. Developmental milestones for sitting, standing, and walking are shown in Figure 11.9. These motor development milestones are averages for human infants. Some infants may skip a stage, such as "hands-and-knees crawling," all of the stages overlap, and each stage is quite variable in duration. On average, by 3 years of age, the end of infancy, the youngster can run short distances, pour water from a pitcher, and manipulate small objects, such as blocks, well enough to control them. There is a similar progression of changes in the problem solving, or cognitive, abilities of the infant.
Accounting for all of these motor and cognitive advancements is the develop-ment of the skeletal, muscular, and nervous systems, especially brain growth and development. The human brain grows rapidly during infancy, much more rapidly than almost any other tissue or organ of the body (Fig. 11.10). All parts of the brain seem to take part in this fast pace of infant growth and maturation, including the hypothalamus, a center of neurological and endocrine control (Fig. 11.11). During fetal life and early infancy, the hypothalamus produces relatively high levels of gonadotropin-releasing hormone (GnRH). This hormone causes the release of luteinizing hormone (LH) and follicle-stimulating hormone (FSH) from the pitu-itary gland. These hormones, in turn, travel via the bloodstream to their sites of action, which include the developing ovaries or testes.
The endocrine system interacts in complex ways with the environment and the genome to direct the course of growth, development, and maturation by release of hormones. In addition, changes in the operation of the endocrine system seem to play a primary role in the evolution of life cycles (Finch and Rose 1995). The opera-tion of the primate hypothalamic system is a case in point. In 1975, Grumbach and colleagues reported that GnRH has an on-off-on pattern of activity during post-natal development in humans. Nonprimate mammals, such as rodents, do not show this pattern; instead, these animals have a progressive and uninterrupted increase
(a)
Boys 70
60
E'
50-2-.c 40 0,
c Q)
30 _J
I I
(.) 20
10
10 20 30 40 10 20 30 40 50
Post menstrual Postnatal
Age (weeks)
(b)
10
9
8 Cil ~
7 Q) Q) ;;:
6 ~
E 5
-2-c
4·c::;
0 ~ 3
I
2
I
(.)
Birth
1 0 20 30 40 1 0 20 30 40 50
Postmenstrual Postnatal
[image:20.517.160.382.67.502.2]Age (weeks)
Figure 11.8 Distance (a) and velocity (b) curves for growth in body length during human
prenatal and postnatal life. The graphs are diagrammatic, because they are based on several
sources of data. Dashed lines depict the predicted curve of growth if no uterine restriction
takes place. In fact, such restriction does take place toward the end of pregnancy and may
impede the flow of oxygen or nutrients to the fetus. Growth rate slows but rebounds after
birth and returns the infant to the size he or she would be without any restriction. C-H, crown-heel. Source: Tanner (1990).
I
I
\
STAGES IN THE LIFE CYCLE 535
-
+
Walking alone+
--~-
+
Standing alone+
!
-Q)
~
---
+
..9!
-Walking with assistance
+
.E
i
----
+
Hands-and-knees crawling+
-~
Standing with assistance+
---~-
f
Sitting without support+
-3 4 5 6 7 8 9 10 11 12 13 14 15 16 17 18 19 20 21
Age in months
Figure 11.9 Windows of achievement for six gross motor milestones. Source: World Health Organization Multicentre Growth Reference Study Group (2006).
100
.c t 80 :0
Q) u
c ·u; 60
c
"iii
Ol
0 40
c
Q) ~ Q) c...
00
[image:21.526.32.428.42.593.2]' '
...
•• --·Dentition
,/;~
/ :
, I
/ :
'
' / , : I , I
' , /
/
:' Body_ • ...- :
, - - - I
,.:.----
/
/ -
.
, ' / "
,/,,,' ,,, ..
,..
/.--· Reproductive ..• /
, , .-··,.,.,..
;~":.::._ ..
-··
-
··-
·
·-··-
··-
··
5 10 15
Age (years)
20
Figure 11.10 Growth curves for different body tissues. The "brain" curve is for the total weight of the brain (Cabana eta!. 1993). The "dentition" curve is the median maturity score
for girls based on the seven left mandibular teeth (11, 12, C, PM1, PM2, M1, and M2)
(Demirjian 1986). The "body" curve represents growth in stature or total body weight, and the ''reproductive" curve represents the weight of the gonads and primary reproductive
organs (Scammon 1930).
(a)
400 70
60
300 50
::1 ::1
~
40 -a, E.s
200.s
::r::: 30 ::r:::
(/) ...J
LL 20
100
10
- - - -
03 6 9 13 16 19 22 25 28 31 34 38 Age (months)
FSH- - LH
-(b) 500
400
::1
E 300
"'CI c ~ 200
...J
100
0
19 20 21 22 23 24 2
Time (hours)
[image:22.522.163.393.67.402.2]--- 25.1 mo - -25.5 mo - .. 25.8 mo - 30.4 mo
Figure 11.11 (a) Pattern of secretion of FSH and LH in a male rhesus monkey (genus
Macaca). The testes of the monkey were removed surgically at birth. The curves for FSH and
LH indicate the production and release of GnRH from the hypothalamus. After age 3 months (i.e., during infancy), the hypothalamus is inactivated. Puberty takes place at -27 months, and the hypothalamus is reactivated. (b) Development of hypothalamic release of GnRH during puberty in a male rhesus monkey with testes surgically removed. At 25.1 months (mo) of age, the hypothalamus remains inactivated. At 25.5 and 25.8 months, modest hypothalamic activity is observed, indicating the onset of puberty. By 30.4 months, the adult pattern of LH release is nearly achieved. This pattern shows increases in both the number of pulses of release and the amplitude of release. In human beings, a very similar pattern of infant inactivation and late juvenile reactivation of the hypothalamus takes place. Source: Adapted, with some sim-plification, from Plant (1994).
in GnRH production from birth to sexual maturation. Since 1975, much research has been focused on the mechanisms that control this on-off-on pattern (Fig.ll.ll). The current understanding is that one, or perhaps a few, centers of the brain change their pattern of neurological and endocrinological activity, and their influence on the hypothalamus. The hypothalamus becomes, basically, inactive in terms of sexual development by about age 2-3 years. The "inhibitor" has not been identified but
I
!
'
I
STAGES IN THE LIFE CYCLE 537
likely is located in the brain and certainly not in the gonads. Human children born without gonads, as well as rhesus monkeys and other primates whose gonads have been surgically removed at birth, still undergo both GnRH inhibition in infancy and hypothalamus reactivation at age when puberty would occur normally (Plant 2008; Plant and Ramaswamy 2009).
It is accepted that the GnRH on-off-on pattern has a regulatory effect on pitu-itary LH and FSH production and release. In turn, LH and FSH regulate body growth and sexual maturation. Released from the pituitary, LH and FSH travel in the bloodstream to the gonads (ovaries or testes), where they stimulate the produc-tion and release of estrogen or androgen hormones (Fig. 11.12). These gonadal hormones are, in part, responsible for the rapid rate of growth during early infancy. By late infancy, however, the hypothalamus is inhibited. GnRH secretion almost stops, and the levels of the sex hormones fall, which seems to relegate body growth to a steady 5-6 em/year and suspends reproductive maturation (Fig. 11.10, "repro-ductive" curve). The hypothalamus is reactivated just before puberty, the event of development that marks the onset of sexual maturation. The age at which this acti-vation takes places varies between primate species, and this variation is part of the control of the transition between stages of the life cycle.
Childhood The childhood stage follows infancy, encompassing the ages of about
3.0-6.9 years. Childhood is a period of postweaning dependency on adults that may also be defined by its own pattern of growth, feeding behavior, and motor and cog-nitive development. In humans, the rapid growth deceleration of infancy begins to moderate as childhood begins. Growth rate declines from about 7-8 em/year at age 3 years to -5-6 em/year by age 6 years and then levels off. This moderation of growth rate decline and the leveling off in growth rate are unusual for mammals, because almost all other species continue a pattern of relatively rapid deceleration after infancy (look ahead to Figs. 11.18 and 11.19).
This slower and steady rate of growth maintains a relatively small-sized body during the childhood years. In terms of feeding, children are weaned from the breast or bottle but still depend on older people for food and protection. In contrast, most mammalian species move from infancy, and its association with dependence on nursing, to a stage of independent feeding. Some months of postweaning depen-dency is a characteristic of the social carnivores (such as lions, wild dogs, and hyenas) and a few species of primates, such as marmosets and tamarins (Ewer 1973; Goldizen 1987).
Given this, postweaning dependency is, by itself, not a sufficient criterion to dis-tinguish human childhood. Dental traits, digestive systems, and brains add to the features of human childhood. Human children require specially prepared foods because of the immaturity of their dentition, the small size of their stomachs and intestines, and the rapid growth of their brain (Fig.11.10). Again, we emphasize that the human brain is especially important. The newborn uses 87% of its resting meta-bolic rate (RMR) energy for brain growth and function. By the age of 5 years, the percent RMR usage is still high at 44%, and higher than any other mammal, whereas in the adult human, the figure is between 20% and 25% of RMR. At comparable stages of development, the chimpanzee devotes about 45%, 20%, and 9%, respec-tively, of its RMR to brain growth (Leonard and Robertson 1994). Chimpanzee energy needs are lower than those for humans for three reasons: (1) smaller size of
0
Skin andCNS
Prolactin
Hypothalamus
GnRH
TRH PIF
CRF GHRH GHRIH
Vasopressin
Figure 11.12 Diagram of the location of the hypothalamus and pituitary within the brain, and a schematic illustration of the target organs and tissues of the pituitary hormones. GnRH,
gonadotropin-releasing hormone; TRH, thyrotropin-releasing hormone; PIF, prolactin-release inhibiting factor; CRF, adrenocorticotropin-releasing factor; GHRH, growth hormone-releasing hormone; GHRIH, growth hormone release-inhibiting hormone; GH, growth hormone; TSH, thyroid stimulating hormone; ACTH, adrenocorticotropic hormone; FSH, follicle-stimulating hormone; LH, luteinizing hormone; MSH, melanocyte-stimulating hormone. Source: Redrawn from Schally eta!. (1977).
the brain at all ages and (2) slower rate of growth of the brain after birth, and (3) the brain stops growing about 2 years earlier in chimpanzees than in humans (Leigh 2004; Fig. 11.13).
The constraints of immature dentition and small digestive system mean that human children need a diet that is easy to chew and swallow and low in total volume.
The child's relatively large and active brain, almost three times the size of an adult
I
STAGES IN THE LIFE CYCLE 539
0 5 10 15 20 25 30
Age (Years)
Figure 11.13 Brain-mass growth data for humans (Homo sapiens) and chimpanzees (Pan
troglodytes). Brain mass increases during the postnatal period in both species. Lines represent
best-fit Lowess regressions through the data points. M, males; F, females; U, sex unidentified (Vrba 1998). The human regressions separate into male (upper) and female (lower) curves. The inset shows brain-mass growth for each species during the first postnatal year (repro-duced from Leigh 2004, with kind permission of the author).
chimpanzee's brain, requires that the low-volume diet be dense in energy, lipids, and proteins. Children do not yet have the motor and cognitive skills to prepare such a diet for themselves. Children are also especially vulnerable to predation and disease and thus require protection. Children will not survive in any society if deprived of the care provided by older individuals. The so-called wolf children and even street children, who are sometimes alleged to have lived on their own, are either myths or not children at all. A search of the literature finds no case of a child (i.e., a young-ster under the age of 6 years) living alone, either in the wild or on urban streets (Panter-Brick et al. 1996; Bogin 2006).
Two of the important physical developmental milestones of childhood are the eruption of the first permanent teeth, replacement of the deciduous teeth, and completion of brain growth (in weight). First molar eruption takes place, on average, between the ages of 5.5 and 6.5 years in most human populations. Eruption of the central incisor quickly follows, or sometimes precedes, the eruption of the first molar. By the end of childhood, usually at the age of 7 years, most children have erupted the four first molars, and permanent incisors have begun to replace "milk" incisors. Along with growth in size and strength of the jaws and the muscles for chewing, these new teeth provide sufficient capabilities to eat a diet similar to that of adults.
A close association between human dental development and other aspects of growth and maturation was noted in the early 20th century by anatomists and anthropologists. More recently, Smith (1991) analyzed data from humans and 20 other primate species and found that age of eruption of the first molar is highly associated with brain weight (correlation coefficient, r = 0.98, where 1.00 is a perfect
[image:25.527.99.404.45.249.2]correlation) and a host of other growth and maturation variables. Other research, based on direct measurements of victims of accidents and disease, shows that human brain growth in weight is virtually complete at a mean age of 7.0 years (Cabana et al.1993; Fig.11.13). Thus, at this stage of development, not only is the child capable dentally of processing an adult-type diet, but the nutrient requirements for brain growth also diminish. Moreover, cognitive and emotional capacities mature to new levels of self-sufficiency. Language and symbolic thinking skills mature rapidly, social interaction in play and learning become common, and the 7-year-old indi-vidual can perform many basic tasks, including food preparation with little or no supervision (Locke and Bogin 2006).
Another feature of the childhood phase of growth associated with these physical and mental changes is the modest acceleration in growth velocity at about 6-8 years, called the midgrowth spurt (shown in Fig. 11.7). Some studies note the presence of the midgrowth spurt in the velocity curve of boys but not girls, while other studies find that up to two-thirds of boys and girls have midgrowth spurts. The midgrowth spurt is linked with an endocrine event called adrenarche, defined as the postnatal onset of secretion of the androgen hormones dehydroepiandrosterone (DHEA) and DHEA sulfate (DHEA-S) from the adrenal gland. Among the primates, these hormones are produced in a novel histological region called the zona reticularis. In humans and chimpanzees, adrenarche occurs between the ages of 6-10 years. In some other primates, such as the rhesus monkey, the upregulation of DHEA and DHEA-S begins perinatally (Bogin and Campbell, http://carta.anthropogeny.org/ moca/topics/adrenarche). It is unclear, however, if adrenal androgens produce the midgrowth spurt in height, but these androgens seem to cause the appearance of a small amount of axillary and pubic hair.
Adrenal androgens also seem to regulate the development of body fatness and fat distribution, and in humans, adrenarche has been related to the "adiposity rebound" at the transition between the childhood and juvenile stages of the life cycle. The adiposity rebound describes the increase in the body fatness that takes place between the ages of 5 and 7 years. The adiposity rebound is usually measured as the body mass index (BMI), which is calculated as [weight in kilograms/height in square meters]. In many human populations, the BMI is a reasonable proxy measure of body fatness. From late infancy through childhood, there is usually a decline in BMI, but then in late childhood, fatness begins to increase (Cole 2004; Hochberg 2009).
STAGES IN THE LIFE CYCLE 541
In summary, human childhood is defined by the following traits: (1) a slower rate of growth than during infancy and relatively small body size; (2) a large, fast-growing brain; (3) higher brain RMRs than any other mammalian species; (4) immature dentition; (5) motor immaturity; (6) cognitive immaturity; and (7) adrenarche, the midgrowth spurt, and adiposity rebound. We know of no other mammalian species with this entire suite of features.
Juvenile Stage Juvenile mammals may be defined as "prepubertal individuals that are no longer dependent on their mothers (parents) for survival" (Pereira and Altmann 1985, p. 236). This definition is derived from ethological research with social mammals, especially nonhuman primates, but applies to the human species as well. The phrase "no longer dependent on their mothers" means that the young are weaned from feeding by lactation. However, some juvenile mammals are, to a greater or lesser extent, dependent on their parents (see above). Even so, the major difference between infant and juvenile mammals is that it is possible for the juve-niles to survive the death of their adult caretakers. Human infants and children cannot survive without assistance from older people. Ethnographic research shows that juvenile humans have the physical and cognitive abilities to provide much of their own food and to protect themselves from predation and disease. The so-called street children mentioned above are in fact street juveniles!
The human juvenile stage begins at about 7.0 years of age. In girls, the juvenile period ends, on average, at about the age of 10 years, 2 years before it usually ends in boys, the difference reflecting the earlier onset of adolescence in girls. The juvenile stage is characterized by the slowest rate of growth since birth.
The evolution of the juvenile stage of primates is associated with both social complexity, especially larger social groups, and diet complexity, including foraging for fruits and seeds (Walker et al. 2006a). Studies of juvenile primates and human juveniles in many cultures indicate that much social learning takes place during this stage, and a "learning hypothesis" has often been proposed to account for the evolution of the juvenile stage. It has also been argued that the primary reason for the evolution of juvenility appears to be a strategy to avoid death from compe-tition with older individuals while living in a social group (Janson and van Schaik 1993).
Adolescence Human adolescence is the stage of life when social and sexual
maturation takes place. Adolescence begins with puberty, or more technically with gonadarche, which is the final "on" of the on-off-on pattern of the GnRH pulse generator of the hypothalamus (Fig. 11.11a). The transition from juvenile to adoles-cent stages requires not only the renewed production of GnRH but also its secretion from the hypothalamus in a specific frequency and amplitude of pulses (Fig.11.11b). None of these hormonal changes can be seen without sophisticated technology,
but the effects of gonadarche can be noted easily as visible and audible signs of sexual maturation. One such sign is a sudden increase