by
Mallory Stankovich
A thesis submitted in partial fulfillment of the requirements for the degree of
Master of Science (Psychology)
in the University of Michigan-Dearborn 2018
Master’s Thesis Committee:
To everyone who supported me through this process, thank you.
Table of Contents
Dedication ... i
List of Tables ... ii
List of Appendices ... iii
Abstract ... iv
Chapter I: Introduction and Literature Review ...1
Video Games ...1
Sleep ...2
Violent Video Games ...6
Physiological Arousal ...7
Motivations and Personality ...8
Personality and Sleep Quality ...9
Chapter II: Hypotheses ...11
Chapter III: Method ...14
Chapter IV: Procedure ...16
Chapter V: Measures ...18
Chapter VI: Results ...22
Chapter VII: Discussion ...28
List of Tables
Table 1: Average Level of Video Game Violence ...40 Table 2: Three Stage Hierarchical Regression Analysis between Gamer Type, Average Change in Arousal, Personality, and Sleep Quality ...41 Table 3: Correlation Analyses between Overall Sleep Quality, Gamer Type, and Average Change in Arousal...42 Table 4: Correlation Analyses between Overall Sleep Quality and Video Game Playing Motivations ...43 Table 5: Correlation Analyses between Overall Sleep Quality and Personality Factors ...44
1
List of Appendices
Appendix A: List of Favorite / Most Played ...45 Appendix B: Demographic Questionnaire...46 Appendix C: Diary ...48
1 Abstract
Video games have become exponentially popular over the past few decades. Because they have become a societal staple, research has explored possible ways in which video games could affect one’s health. In particular, video games may impact sleep, leading to poor sleep quality (Adam, Snell, & Pendry, 2007), later sleep on-set (King et al., 2013), and increased daytime sleepiness (Van den Bulck, 2004b). Other factors, including type of video game, physiological arousal, personality, and game playing motivations may also affect overall sleep quality. In this study, 101 adult video game players wore a Fitbit for 48 hours and played console or PC video games as they normally would. A two-way ANOVA, a hierarchical regression, and correlation analyses were conducted and suggest some relationships may exist among these variables. Although some analyses were nonsignificant, that could suggest adults are not playing video games in such an unhealthy manner that their sleep quality is negatively affected. Future research could examine this further.
Keywords: video games, sleep quality, arousal, personality, motivation.
1
Chapter I: Introduction and Literature Review
Video games have garnered popularity around the world over the past few decades. Within the United States, citizens of all ages have either played video games or know someone who has played them. According to the Entertainment Software Association (ESA), 155 million people in the United States play video games. Gamers who play most frequently play an average of 6.5 hours per week with other players online and 5 hours per week with others in person (ESA, 2015). Regular gamers have progressively spent more time playing video games over the past three years than other activities, including watching television, going out to see a movie, and watching a movie at home (ESA, 2015). Due to the volume of players, the gaming industry has become lucrative. In 2014, the gaming industry earned $22.41 billion in total video game sales in the United States. Video games may be played on a variety of platforms. They may be played on cell phones or tablets in the form of applications, or “apps”. They could also be played on
consoles, such as XBox, PlayStation, or Nintendo Wii, as well as on a PC or Mac. Because of the increasing amount of ways to play video games, as well as the financial success of the industry, video game playing behaviors have become a viable area of research.
2
2008). As a result, this may suggest that education may slightly moderate video game playing. Because of the vast number of players and the age range in which video game players may be at risk for certain health issues, research has been conducted to examine the ways in which video games may physically affect those individuals.
Sleep
Video game playing may affect various aspects of physiological health, such as sleep. Sleep is a vital and essential part of health and has important functions, such as maintaining physical and mental health, as well as providing the ability to perform daily functions including concentration, coordination, and learning (National Institute of Health, 2012). Sleep disturbance is a substantial problem in the United States. According to the National Sleep Foundation, at least “40 million Americans suffer from over 70 different sleep disorders and 60 percent of adults report having sleep problems a few nights a week or more,” (National Sleep Foundation, 1999-2004).
3
proinflammatory cytokines such as interleukin-6 and tumor necrosis factor alpha (Vgontzas et al., 2003). The influx of these proteins can have a negative effect on the body, and their results express how these proteins may have significant physical effects moderate sleep deprivation may have on the body. Consistent with this research, severe sleep deprivation can also have
significant effects on the body.
Sleep quality is one factor that may be related to sleep deprivation. Sleep quality is a characteristic of insomnia that may lead a person to have trouble falling asleep or staying asleep (American Psychiatric Association, 2013). Various definitions have been used to attempt
accurately depicting what constitutes sleep quality. In a study conducted by Harvey et al. (2008), participants defined sleep quality by feelings of tiredness upon waking and throughout the day, feelings of restfulness upon waking, and amount of times one has awoken throughout the night. With this definition in place, sleep quality’s effect on physiological and psychological health could be explored. The ways in which video games could affect sleep quality could be an important area of research, which is what this study aimed to examine.
4
study, researchers examined the ways in which adolescents used various forms of media as a sleep aid. The forms of media included television, music, and computer games, and the use of these forms of media were compared to reading a book to help participants fall asleep. The study consisted of 2,546 middle and high school students across 15 different schools. The results suggest 36.7% of participants watched television to help them fall asleep. Music was used by 60.2% of participants to aid in falling asleep. Additionally, 28.2% of male participants and 14.7% of female participants reported playing computer games to help them fall asleep. The results further suggest that participants who used media to fall asleep reported higher levels of tiredness, later bedtimes throughout the week, and fewer hours of sleep per week than
participants who read books to help them fall asleep or participants did not use any form of media as a sleep aid (Eggermont & Van den Bulck, 2006). Participants who played computer games or used other media were more likely to get fewer hours of sleep and feel more tired than those who did not utilize those media before bed. These results further suggest a possible negative relationship between using media, such as video games, and sleep quality.
5
play violent video games, especially before bedtime, may have poorer sleep quality, later sleep onset, and shorter overall time asleep than those who do not play violent video games, which may negatively impact sleep quality.
In addition to later sleep-onset frequency, Van den Bulck (2004b) suggests late night video game playing may be related to daytime sleepiness. In a sample of 2,546 children from 15 different elementary schools in Flanders, Belgium, participants completed
questionnaires that assessed what types of media were present in their bedrooms, hours of television watched, computer game playing, video game playing, internet use, average bedtime and waking time on weekdays and weekends, and general sleepiness throughout the day. According to the results, children who had a computer in their rooms and who played computer games more than watched television had later bedtimes on weekdays and weekends, woke up later on weekends, spent less time in bed on weekdays, and reported high levels of daytime sleepiness (Van den Bulck, 2004b). This suggests playing video games on a computer may negatively impact sleep quality and positively affect daytime sleepiness.
Although the possible relationship between poor sleep quality and video games has been researched in children and adolescents, the literature on this topic for adults is sparse. Because children and adolescents are typically considered the target audience for video games, most research has been focused on the effects of video games within this population. A study
6
often video games were played on weekdays and weekends. The results suggest video game volume was a significant predictor of sleep quality, fatigue, insomnia, bedtime, and rise time (Exelmans & Van den Bulck, 2014). Additionally, gaming volume appeared to predict sleep latency, sleep efficiency, and the use of sleep aid medication (Exelmans & Van den Bulck, 2014). As the results suggest, video games may also affect sleep quality in adults.
Violent Video Games
One type of video games that may affect sleep quality is violent video games. These types of games have been studied extensively in child and adolescent populations. The majority of the research focuses on how violent video games may lead to aggressive behavior, especially in boys (Willenz, 2002). Exposure to violent video games may also predispose one to the possibility of developing conduct disorder (Paturel, 2014) and entice them to imitate behaviors they view in the games (Herpertz et al., 2005).
Although the literature is not as extensive for violent video games’ effect on sleep as the literature for their effect on aggressive behavior, a few studies have explored this possible relationship. In a study conducted by King, Gradisar, Drummond, Lovato, Wessel, Micic,
7
games and sleep quality, with violent video games negatively affecting various aspects of sleep quality.
Physiological Arousal
In addition to sleep quality, violent video games may also affect physiological arousal. Anderson and Bushman (2001) conducted a meta-analysis of video game research in PsychINFO through the year 2000 that examined the effect of violent video game playing on state arousal and prosocial behavior. Their criteria included searching for the following terms: (video* or arcade or computer) and (game*) and (attack* or fight* or violen* or hostil* or ang* or arous* or prosocial or help*). The researchers included 35 studies with 54 independent samples for a total of 4,262 participants. The results of the meta-analysis suggested that video games may be linked to higher levels of arousal, as displayed through increased heart rate, systolic blood pressure, and diastolic blood pressure (Anderson & Bushman, 2001). These results support their hypotheses, suggesting violent video games could have an effect on one’s physical health. Arriaga, Esteves, Carniero, and Monteiro (2006) also found similar results in their study in which participants between 18 and 25 years old had heart rate and skin conductance measured while they played violent video games. Their results suggest playing violent video games may increase the player’s heart rate (Arriaga et al., 2006). Although these two studies examined if violent video games increase physiological arousal, they did not explore why this may have occurred.
8
participant’s nondominant arm. A baseline reading was taken before the game and a final measure was taken immediately upon completion of the game. In addition, heart rate was measured at baseline and upon completion using an automatic electro-sphygmomanometer. As the results suggest, the more violence present in a video game, the higher their cardiovascular reactivity may be (Ballard & Wiest, 1996). Participants who played the billiards game had the lowest systolic blood pressure, diastolic blood pressure, and heart rate compared to both levels of the Mortal Kombat game. The more violent version of Mortal Kombat had the highest systolic blood pressure, diastolic blood pressure, and heart rate compared to the less violent version of Mortal Kombat and the billiards game (Ballard & Wiest, 1996). Ballard and Wiest (1996) suggest that violent video games may increase a player’s arousal due to the active participation required for the game. They also propose this increase in physiological arousal may not be limited to violent video games but may also be applicable to action-related games.
Motivations and Personality
Past research has also analyzed possible motivations for video game playing. Sherry, Greenberg, Lucas, and Lachlan (2006) identified six dimensions for video game play: Arousal, Challenge, Competition, Diversion, Fantasy, and Social Interaction. Three focus groups (Video Game Player, Non-Video Game Player, and Mixed or Non-Player) completed surveys and interviews which examined their primary reasons for playing video games. Analyses of their responses yielded these previous six categories mentioned, providing a possible framework for understanding and identifying motivations for playing video games.
9
video game preference seems to be associated with participants who are high in openness and low in agreeableness, as well as participants high in openness and extraversion but low in agreeableness and neuroticism. Otzturk, Bektas, Ayar, Ozguven Oztornaci, and Yagci (2015) also found that participants high in openness and extraversion were more likely to play video games online and have internet addiction than participants low in these personality factors.
Graham and Gosling (2013) and Worth and Book (2014) have found links between extraversion and video game play, with extraverted individuals focusing on the social and communication elements of game play. In addition, social motivation for video game playing, particularly in online role playing games, may be linked to high agreeableness, neuroticism, and openness (Graham & Gosling, 2013). Openness was also found to be high in regular gamers (Teng, 2008; Tuten and Bosnjak, 2001; Witt et al, 2011), violent video game players (Chory & Goodboy, 2011), and in role-playing gamers (Graham and Gosling, 2013). Chory and Goodboy (2011) suggest violent video game players were low in agreeableness. Research has also
suggested that conscientiousness may be positively linked to video game play (Teng, 2008), but the research is not concrete. Because the research is mixed, additional research may be valuable to illuminate possible relationships between personality, motivational factors, and violent video game play.
Personality and Sleep Quality
10
personality trait significantly correlated with sleep quality, suggesting neuroticism may be the most significant personality trait tied to sleep quality. Huang, Peck, Mallya, Lupien, and Fiocco (2016) also examined a possible link between sleep quality and personality traits. In their study, researchers also used the PSQI and NEO-Five Factor Inventory to examine personality traits and their possible relationship to sleep quality. Their research suggests high neuroticism and low conscientiousness may be significantly linked to poor sleep quality (Huang et al., 2016).
In a study examining a possible link between personality traits and sleep quality in young Korean women, Kim et al. (2015) also suggest a link between neuroticism, conscientiousness, and poor sleep quality. Their research suggests neuroticism significantly contributes to the overall sleep quality score of the PSQI, possibly linking high neuroticism to poor sleep quality (Kim et al., 2015). Their results also suggest participants high in conscientiousness may be less likely to have poor sleep quality, possibly allowing high conscientiousness to be a protective factor against poor sleep quality (Kim et al., 2015).
11
Chapter II: Hypotheses
In this study, the hypotheses expected to replicate findings from previous research
conducted with children and adolescents in an adult population. Additionally, this study intended to explore new findings, as presented in hypothesis four, examining the combined effects of the three main variables on sleep quality in adult video game players.
Hypothesis One
The first hypothesis the study aimed to test was that sleep is related to video game play. Participants who play violent video games were expected to have poorer sleep quality than participants who play nonviolent video games.
Hypothesis Two
In addition, this study hypothesized that sleep was related to arousal. Participants who had a high change in arousal were expected to have poorer sleep quality than participants who had low change in arousal.
Hypothesis Three
Additionally, video game playing may have been related to arousal. Participants who preferred violent video games were expected to have higher change in arousal than participants who had a preference for nonviolent video games.
Hypothesis Four
12
have poorer sleep quality than participants with low change in arousal and played nonviolent video games.
Hypothesis Five
Personality was also expected to have an effect on sleep, change in arousal, game type, and motivations.
1. Neuroticism
It was expected that participants high in neuroticism would have higher change in arousal than participants low in neuroticism, play violent video games more often than nonviolent video games, were motivated to play video games for competition and fantasy-arousal elements, and have poorer sleep quality than participants low in neuroticism.
2. Extraversion
Participants high in extraversion were expected to have higher change in arousal than participants low in extraversion, play violent video games more often than nonviolent video games, were motivated to play video games competition and social interaction, and have poorer sleep quality than participants low in extraversion.
3. Openness
Participants high in openness were expected to have higher change in arousal than participants low in openness, play violent video games more often than nonviolent video games, were motivated to play video games for diversion and fantasy-arousal elements, and have poorer sleep quality than participants low in openness.
4. Agreeableness
13
games, were motivated to play video games for motivation and challenge, and have poorer sleep quality than participants high in agreeableness.
5. Conscientiousness
14
Chapter III: Method Participants
Participants were 82 males and 19 females ages 18 and older. The participants were recruited from the Introductory Psychology subject pool via SONA at the University of Michigan-Dearborn, throughout the campus, and from social media sites, including Facebook. There were 74 participants from the subject pool and 27 from outside of subject pool. For the subject pool participants, the study was posted to the homepage of SONA, the psychology subject pool website, in which Introductory Psychology student participants read the description and decided whether or not to participate. From that point, students read about the study and if they signed up, they chose a time to come into Dr. Arlo Clark-Foos' lab to complete the
questionnaires and receive the activity tracker and diary. Any Introductory Psychology student 18 years and older who needed to complete a study during the Winter, Summer, or Fall semester of 2017 had the opportunity to participate. Students in Subject Pool who signed up for the study received two research credit through the Subject Pool Administrator.
15
email the PI, not “like” or “comment” on the post. Non-subject pool participants emailed the PI, who were asked if they play PC or console video games at least once per week. If they answered "yes," they were provided available times to come into the lab to participate in the study. If they answered "no," they were thanked for their interest, but were not able to participate in the study.
16
Chapter IV: Procedure
For subject pool participants, this study was available through SONA. Before signing up for the study, participants answered one prescreen question, which was, "Do you play video games at least once per week?" If the participant answered "no," he or she will be directed to an exit screen. If the participant answered "yes," he or she was directed to sign up for an available time slot. Non-subject pool participants were asked the same question via email before they were provided a list of available time slots.
Upon arrival to the lab, participants were provided a consent form. The participants read the consent document which contains all aspects of informed consent including what was asked of them should they choose to participate in the study. The researchers went over the information within the consent form with the participants and answered any questions. If they wished to continue, they signed the consent form and were provided the questionnaires. Those who did not wish to participate were thanked for their time and exited the lab.
Each participant selected two time slots: one to complete the consent form,
questionnaires, and receive study materials and another time to return materials, complete demographic information, and receive the debriefing form. If participants withdrew from the research prior to completing the study, they would receive credit for the amount of days in which they participated. For example, if a participant stayed in the study for one day before
17
to the researcher or returned to either of the faculty advisors. They could also contact the Behavioral Sciences office to return their materials to either of the faculty advisors' mailboxes.
Participants arrived at the lab at their first scheduled time. Upon arrival, participants completed a consent form with pen or pencil with their name, professor, and course number in order to assign credit. Those who did not wish to participate will be allowed to exit the study. Once informed consent is received, participants completed the Big Five Inventory-10, PSQI, Motivations for Game Use Scale, and List of Favorite Games / Most Played Games with pen or pencil. Participants were then be instructed on how to use the Fitbit Charge HR, including care such as not submerging the activity tracker in water. Participants were also provided with the paper arousal diary to log video game playing over the course of 48 hours with pen or pencil.
18
Chapter V: Measures Big Five Inventory-10
Participants completed the Big Five Inventory-10. The Big Five Inventory-10 (BFI-10; Rammstedt & John, 2007) is a shortened version of the Big Five Inventory-44. This 10-item inventory measures the Big Five personality dimensions using a 5-point Likert scale ranging from 1 (disagree strongly) to 5 (agree strongly). There are two questions on the measure that pertain to each personality dimension. Participants were asked to respond to each question as to how strongly they agree with the statement provided, with participants who agree strongly with items pertaining to certain personality factors suggesting the participant was likely to have that personality type. The alphas for each personality factor are as follows: extraversion: .85,
agreeableness: .74, conscientiousness: .83, neuroticism: .79, and openness: .74. The mean alpha for this scale is .79.
Pittsburgh Sleep Quality Index
19 Motivations for Video Game Use Scale
Participants were then asked to complete the Motivations for Video Game Use Scale (Nije Bijvank, Konijn, & Bushman, 2012). This scale examines motivations for playing one’s preferred video games. This scale begins with the statement “I play my favorite game
because…” and follows with 22 items that complete the statement. Participants were asked to rate on a 7-point Likert scale how strongly they agree with the statements, ranging from 1 (disagree completely) to 7 (agree completely). Answers were summed and examined how heavily they load onto seven possible factors: Social Interaction, Competition, Escape,
Excitement, Unwind, Challenge, and Diversion. Participants whose responses loaded highly onto one or more of these dimensions may have indicated possible reasons for playing certain games. The alpha for this measure for this study is .79.
List of Favorite Games / Most Played
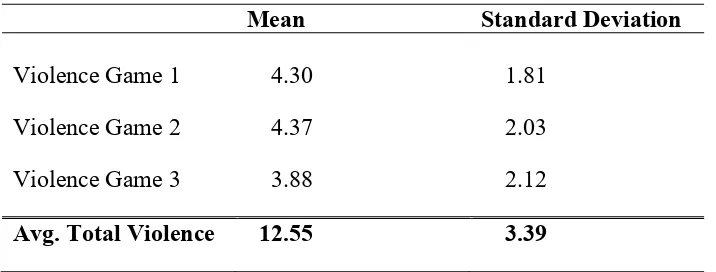
Upon completion of the previous scale, participants were asked a brief series of questions based on their favorite games. Participants listed their top three favorite games and indicated the level of violence of each game on a 7-point Likert scale ranging from 1 (no violence) to 7 (extreme violence) (see Appendix A). As seen in Table 1 in the Appendix, an average of the level of violence for all three games was summed and used to determine whether the participant preferred violent or nonviolent games. Scores ranged from 3 to 21, with scores between 3 and 11 indicating “nonviolent game preference” and scores between 12 and 21 indicating “violent game preference”. This measure was modeled after a similar measure in Anderson and Dill’s (2000) study and was created for this study.
20
Participants were asked a series of demographic questions. These included stating one’s age, gender, education level (High School Degree, Associate’s Degree, Bachelor’s Degree, Master’s Degree, Doctorate, Other), race, and video game play information, including where one plays video games, how often one plays video game (days per week), whether one plays alone or with others, whether one plays with others alone or online, and where one typically plays video games (see Appendix B).
Diary
Each participant was provided an eight-page diary to keep track of video game play, which contained information regarding video games played and subjective state arousal.
Participants provided the title of the game played, start time, and indicated their arousal level by circling a number, one through nine, that corresponds to one of five faces on the SAM arousal scale (Bradley & Lange, 1994), ranging from low arousal to high arousal, before beginning the game. They indicated the time in which they stopped playing the game and the level of arousal they felt upon ending the game (see Appendix C). Participants completed this process each time they played a console or computer-based game over the course of 48 hours. At the end of the 48 hours, participants returned the diary to the researcher.
Activity Tracker
21
assigned. For example, the first participant with Fitbit 1 was assigned the number 101. The first participant with Fitbit 2 was assigned the number 201, etc. Each numbered Fitbit had its own free online account that was accessed through the Fitbit home web page, which was only be
accessible to the researcher. The data for each participant was downloaded into an Excel file. Additionally, the Fitbit data was linked to each participant based on their numbered Fitbit and the days in which they completed the study. For example, if the first participant who had Fitbit 1 completed the study 2/1-2/3, that data set was linked to participant number 101, which will also be written on their questionnaires for the first day of the study as well as the last questionnaire on the last day of their participation. Because each numbered Fitbit was assigned to one person at a time, we were able to easily connect the data for each participant across the two days. Credit was assigned to participants who had returned their Fitbit. The number of the Fitbit that each
22
Chapter VI: Results
Participants were 82 males (81.2%) and 19 females, aged between 18 and 32. Of these
participants, 66 (65.3%) were violent video game players while 35 (34.7%) were nonviolent
video game players. Overall sleep quality results suggested the majority of the sample had poor
sleep quality, with 55 participants (54.5%) indicating they had poor sleep quality while 46
participants expressed they had good sleep quality. In terms of education, 80 participants
(79.2%) had a high school diploma or GED. Additionally, 9 participants (8.9%) had an
Associate’s degree, 10 participants (9.9%) had a Bachelor’s degree, and 2 participants (2.0%)
had other education that was not listed. Of these participants, slightly over half (54.5%) were
Caucasian. The remaining half identified as Arabic or Middle Easterner (17.8%), African
American / Black (9.9%), Asian or Pacific Islander (7.9%), Hispanic (3.0%), Indian (3.0%)
Native American / American Indian (1.0%), and other (3.0%).
Regarding video game playing, 49 participants (48.5%) play video games with others, 28
participants (27.7%) play alone, and 24 participants play both alone and with others. In terms of
gameplay, 36 participants (35.6%) play video games online, 31 participants (30.7%) play with
others in person, 18 participants (17.8%) play with others both in person and online, 9
participants (8.9%) play alone, and 7 participants play video games alone, in person with others,
and online with others. In addition, 21.8% of participants play video games four days per week,
20.8% play three days per week, 17.8% play seven days per week, 9.9% play six days per week,
23
played video games suggest the top five favorite or most played video games are: League of
Legends, Overwatch, NBA 2K17, Grand Theft Auto V, and Rocket League.
Results from the Big Five Inventory-10 suggest the majority of the sample was high in
agreeableness, with 95 participants (94%) identifying as such. In terms of extraversion, 62
participants (61.4%) identified as high in extraversion while 39 participants identified as low in
extraversion. For conscientiousness, 40 participants (39.6%) were high in conscientiousness
while 61 participants were low in conscientiousness. In regard to neuroticism, 67 participants
(66.3%) identified as high in neuroticism while 34 participants identified as low in neuroticism.
Finally, 37 participants (36.6%) were high in openness and 64 participants were low in openness.
Hypothesis One
A two-way ANOVA was conducted to examine the influence of gamer type on overall
sleep quality. Gamer type consisted of two levels (violent video game player, nonviolent video
game player), and sleep quality was continuous. This analysis was utilized to compare the main
effect of gamer type on overall sleep quality. Contrary to predictions, the main effect for gamer
type was not statistically significant, F(2,90) = 1.082, p = ns.
Hypothesis Two
A two-way ANOVA was conducted to examine the influence of average arousal change
on overall sleep quality. Average arousal change consisted of three levels (positive change,
negative change, no change), and sleep quality was continuous. This analysis was utilized to
compare the main effect of average arousal change on overall sleep quality. Contrary to
predictions, the main effect for average arousal change was also not significant, F(2,90) = .408, p
24 Hypothesis Three
A correlation analysis, as seen in Table 3, was conducted to examine the influence of
gamer type on average arousal change. Gamer type consisted of two levels (violent video game
player, nonviolent video game player), and average arousal change consisted of three levels
(positive change, negative change, no change). This analysis was utilized to compare the main
effect of gamer type on average arousal change. Contrary to predictions, the main effect for
gamer type on arousal change was not statistically significant, (r = -.029, p = ns).
Hypothesis Four
A two-way ANOVA was conducted to examine the influence of two independent
variables (gamer type, average arousal change) on overall sleep quality. Gamer type consisted of
two levels (violent video game player, nonviolent video game player), average arousal change
consisted of three levels (positive change, negative change, no change), and sleep quality was
continuous. This analysis was utilized to compare the interaction between gamer type and
average arousal change on overall sleep quality. Contrary to predictions, the interaction between
gamer type and average arousal change was not significant, F(1,90) = .970, p = ns.
Hypothesis Five
A three-stage hierarchical regression was conducted with sleep quality as the dependent
variable. Gamer type was entered at stage one, average change in arousal was entered at stage
two, and personality variables (extraversion, neuroticism, openness, agreeableness, and
conscientiousness) were added at stage three. As seen in Table 2 in the Appendix, the
hierarchical regression revealed that at stage one, gamer type accounted for .8% of the variance
of overall sleep quality, but not significantly contribute to the regression model, R² = .008,
25
.5% of the variance, but was not significant, R² = .005, F(2,93) = .479, p = ns. In stage three, the
five personality factors together explained an additional 12% of the variance of overall sleep
quality and was significant, R² = .120, F(7,88) = 2.428, p <.05. Within this stage, neuroticism
was a significant individual predictor of overall sleep quality, t = -2.793, p < .05.
Conscientiousness was a marginally significant individual predictor of overall sleep quality, t =
-1.809, p = .074. Once all the variables were included in stage three of the regression model, the
overall model was marginally significant, F(7,88) = 1.921, p = .076. Together, the variables
accounted for 13.3% of the variance in overall sleep quality.
Correlation analyses were also utilized to examine relationships between overall sleep
quality with the following variables: gamer type (violent or nonviolent) and average change in
arousal in Table 3, personality (openness, agreeableness, neuroticism, extraversion,
conscientiousness) in Table 4, and video game playing motivation (social interaction,
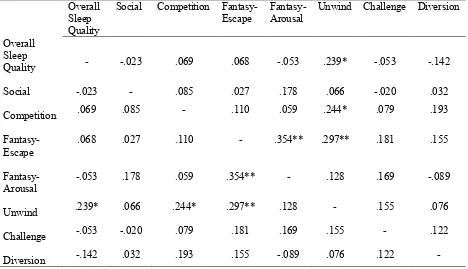
competition, challenge, fantasy-arousal, fantasy-escape, to unwind, and diversion) in Table 5 in
the Appendix. Sleep quality was significantly and negatively correlated with neuroticism, (r =
-.214, p <.05). Participants who were high in neuroticism were more likely to have poor sleep
quality. Additionally, sleep quality was significantly and positively correlated with unwind
motivation, (r = .239, p < .05). Participants who had good sleep quality were more likely to be
motivated to play video games to unwind.
Average change in arousal was also significantly correlated to a personality and
motivation factor. Average change in arousal was significantly and negatively correlated with
conscientiousness, (r = -.212, p < .05). Participants who were highly conscientious had low
change in arousal. The participants’ average change in arousal was also significantly and
26
arousal were more likely to play video games for fun than participants with low change in
arousal.
Various personality factors also had significant correlations. Agreeableness was
significantly and positively correlated with neuroticism, (r = .231, p < .05). Participants who
were high in agreeableness were likely to be high in neuroticism. Agreeableness was also
significantly and positively correlated with fantasy-arousal motivation, (r = .201, p < .05).
Participants who were high in agreeableness were likely to have high fantasy-arousal motivation.
Conscientiousness was significantly and positively correlated with diversion motivation,
(r = .327, p < .05). Those who were highly conscientious were more likely to play video games
for fun than those who were not highly conscientious. In addition, conscientiousness was
significantly and negatively correlated with neuroticism, (r = -.237, p < .05). Participants high in
conscientiousness were likely to be low in neuroticism.
In addition to personality factors, motivational factors resulted in a multitude of
significant correlations. Competition motivation was significantly and positively correlated with
unwind motivation, (r = .244, p < .05). Participants who were highly competitively motivated
were likely to be highly motivated to play video games to unwind.
Fantasy-arousal motivation was significantly and negatively correlated with openness, (r
= -.231, p < .05). Participants who were highly motivated to play video games for
fantasy-arousal were not likely to be high in openness. Additionally, fantasy-fantasy-arousal was positively and
significantly correlated with fantasy-escape motivation, (r = .354, p < .001). Participants who are
highly motivated to play video games for fantasy-arousal were also likely to be motivated to play
27
Finally, fantasy-escape motivation was significantly and positively correlated with
unwind motivation, (r = .297, p < .05). Participants who were highly motivated to play video
games for fantasy-escape elements were also likely to be highly motivated to play video games
to unwind. Fantasy-escape motivation was also significantly and negatively correlated with
neuroticism, (r = -.267, p < .05). Those who were motivated to play video games for
fantasy-escape were less likely to be high in neuroticism than those who were not motivated to play
video games for that motivation. Fantasy-escape motivation was significantly and negatively
correlated with extraversion, (r = -.207, p < .05). Participants who were highly motivated to play
28
Chapter VII: Discussion
Video games have a substantial presence in the United States. Over the past few decades,
they have exponentially grown in popularity, which continues to grow with new games,
improved graphics, and technological advances with each new console. Because of this, research
has examined ways in which video games may affect one’s health. One significant way in which video games could affect a person’s health is sleep. This is an important area of research because sleep affects health in various ways, including increased sleepiness throughout the day,
decreased psychomotor skills, and an increase of proinflammatory cytokines (Vgontzas et al., 2003), which could lead to serious health issues later in life. The majority of past research
regarding video games and sleep quality has been limited to children and adolescents, leaving the literature for adult video game players sparse. Similar to the research conducted by Exelmans and Van den Bulck (2014), this study aimed to add to that literature by examining adult video game players.
29
(Sherry et al., 2006). As a result, this study aimed to examine the individual and combined effects of gamer type, change in arousal, and personality on sleep quality in an adult population.
A multiple regression analysis suggested there was a marginally significant finding for
predicting the combined effects for all four variables: gamer type, average change in arousal,
personality, and video game motivation on sleep quality. This finding somewhat matches this
study’s hypothesis and past research, suggesting gamer type, average change in arousal,
personality, and video game motivation have a marginal effect on overall sleep quality. Contrary
to the hypothesis, the individual contributions of gamer type in stage one, average change in
arousal in stage two, and video game motivation in stage four were not significant. On the other
hand, the addition of personality in stage three was significant, suggesting personality had a
significant contribution on sleep quality, with neuroticism significantly contributing to predicting
overall sleep quality. This suggests all five of the Big Five personality traits may have an
additive effect on sleep quality, with neuroticism possibly having a significant individual
contribution in affecting sleep quality.
In addition to the regression analysis, correlation analyses were utilized to examine
effects between the main five variables (overall sleep quality, gamer type, average change in
arousal, personality, and video game playing motivation). Results suggest some correlation
analyses between these variables were statistically significant. In terms of sleep quality,
participants high in neuroticism were more likely to have poor sleep quality than participants
with low neuroticism, which was consistent with this study’s hypothesis and past research
(Kanno et al., 2014). Additionally, sleep quality was significantly correlated with unwind motivation, suggesting participants with good sleep quality were also motivated to play video
30
sleep. Although this finding was not hypothesized, future research may be able to explore this
possible relationship.
Along with sleep quality, average change in arousal was significantly correlated with a
personality factor and a video game motivational factor. Conscientiousness was correlated
negatively with average arousal change, suggesting participants who were highly conscientious
were likely to have low change in arousal. This finding was not hypothesized, but future research
could explore this relationship. Average change in arousal was also significantly correlated with
diversion motivation. Participants who had high change in arousal were less likely to play video
games for fun than participants with low change in arousal. This finding was also not
hypothesized but may be examined in future research.
Significant correlations were also present within various personality factors.
Agreeableness was significantly and positively correlated with fantasy-arousal motivation,
suggesting participants who were highly agreeable were also likely to be motivated to play video
games for fantasy-arousal elements, such as “it is exciting to be somewhere else,” and, “it is exciting to be someone else.” Agreeableness was also significantly and positively correlated with
extraversion, suggesting participants who were highly agreeable were likely to be highly
extroverted. These findings were not hypothesized, but could be explored in future research.
Like agreeableness, conscientiousness had significant correlations. Conscientiousness
was significantly and negatively correlated with neuroticism. Highly conscientious participants
were likely to be low in neuroticism. Conscientiousness was also significantly correlated with
diversion motivation, suggesting participants high in conscientiousness were likely to be highly
motivated to play video games for fun. These findings were not in the original hypotheses, but
31
In addition to personality, motivational factors also expressed significant correlations.
Fantasy-arousal motivation was negatively correlated with openness, suggesting participants
highly motivated to play video games for fantasy-arousal elements were likely to be low in
openness. Fantasy-arousal motivation was also correlated with fantasy-escape motivation. This
relationship suggests participants who played video games for fantasy-arousal were likely to play
video games for fantasy-escape as well. Additionally, fantasy-escape motivation was
significantly and negatively correlated with extraversion. Participants who were motivated to
play video games to escape reality were more likely to be introverted than extroverted.
Fantasy-escape motivation was also negatively correlated with neuroticism, suggesting participants who
were highly motivated to play video games to escape into a fantasy world were likely to be low
in neuroticism. Fantasy-escape motivation was positively correlated with unwind motivation.
This result suggests participants who were highly motivated to play video games as an escape
were likely to play video games to unwind, which further research could examine the extent to
which escaping reality through video games could be a form of relaxation. Unwind motivation
was also positively correlated with competition motivation. Participants who we were likely to
play video games to unwind were likely to be motivated to play video games for competition.
Although these findings were not hypothesized, further research could analyze these possible
relationships.
Throughout the present study, a few limitations became apparent. The size of the sample
was one limitation, which was relatively small compared to the number of participants that were
needed. A larger sample could greatly impact the significance of the results, allowing the
possibility for significant results to emerge. Because factors within the multiple regression model
32
these variables but a larger sample size may be necessary to reveal this. Additionally,
noncompliance with wearing the Fitbit for a full 48 hours was another limitation. Missing Fitbit
data during the 48 hours in which a participant had the Fitbit shows noncompliance was an issue.
Although participants were instructed to wear the Fitbit nonstop, except when showering, there
was no possible manner to enforce this once the participants left the lab. Because of this, heart
rate change data were affected, obscuring a clear physiological profile of the participants.
In addition to these limitations, participants presented various limitations upon
completion of Part 2 of this study. The reason for participants having poor sleep quality may not
be due to video games, but rather homework and studying during the semester may lead to poor
sleep quality. Because this study utilized subject pool, most of participation occurred during the
spring and fall semesters. During this time, students may stay awake later and be unable to sleep
well due to stress related to class work and studying for exams. In addition, subject pool
participants were scheduled during the week, not over the weekend. Multiple participants
expressed that they typically do not play as many games during the week as they do on the
weekend, possibly affecting sleep quality and arousal data. Additionally, participants were
unable to wear the Fitbit for more than two days due to time constraints. Although each Fitbit
was calibrated prior to data collection, an ideal amount of time for each person to wear the Fitbit
for improved accuracy would be one week. This was a limitation since loaning Fitbits for this
length of time was not feasible. Providing Fitbits for an extended period of time in future
research may improve accuracy of the data.
33
the 1990s and early 2000s, but that may have changed within this decade. A multitude of video games now contain at least some violence, which may have lessened their effect on the current generation compared to the previous generation. The difference in game content is apparent since Mortal Kombat was the violent game of the time of Ballard and Wiest’s (1996) study, whereas Call of Duty or Resident Evil are popular games in this decade, games in which violence and gore are the norm. An age shift may have also affected the data. The video games that may be more popular with the current young adults may be more violent than video games that were popular with young adults in previous research. Again, this may allow for desensitization for violent aspects of video games, which may not have had an effect on sleep quality. This may also be an explanation as to why neuroticism was not as strongly correlated with violent video game playing and overall sleep quality. People with personality traits other than neuroticism may choose to play violent video games, further suggesting a shift may have taken place among the current young adult population. Because more people may choose to play violent video games, the relationship between neuroticism and violent video games may have weakened. Additionally, regional differences may account for findings that were not aligned with this study’s hypotheses. This study was conducted in Southeast Michigan, and the video game preferences in this area may be different than in other parts of the country, if not other parts of the world. Online gaming provides the opportunity to connect with people in other regions and play the same games, but not all players in this study played online or with others. Because these preferences may have been specific to this area, which may have differed from preferences for participants in other regions found in the existing literature.
34
children and adolescents, leaving adult video game research sparse. Adults in this study were college students and adults in the surrounding area. Because of this, participants could have been living alone and had been balancing classes, studying, and work, forcing them to be
self-motivated more than children or adolescents. This may not have provided them ample time to play video games as they would have been able to during middle or high school. They would need to schedule playing games around classes and their workload, and they may not have had time to play like they would be able to during breaks or the summer, depending on their schedules. This could have prevented participants from staying up late to play video games, affecting their sleep quality.
Along with the difference between adolescent and adult data, the lack of playing video games in an unhealthy manner may be a reason for the lack of significance in the relationship between violent video game playing and overall sleep quality. In this age group, video game players may be playing games in a healthy manner, playing for fun and in a controlled manner. They may not be staying up as late or playing as long as children and adolescents. These adults may have adjusted their gaming to accommodate their schedules and responsibilities, possibly learning to play in a moderated and healthy manner. The lack of an effect between videogames and sleep quality may be an indication that video games are becoming less of a negative influence on one’s health. In this instance, not finding an effect may not have been inherently bad.
For future research, utilizing a large, diverse sample, in terms of age, and possibly
gender, could be beneficial. This may allow the data to present a more accurate profile of the
general population. One may also benefit from conducting research over weekends or during the
35
better picture of general playing habits when participants have more time to play than during the
week or during the fall and winter semesters. In addition, future research should aim to improve
compliance with the Fitbits and wearing them for a longer period of time, providing the
opportunity for improved accuracy of the data and overall physiological profile of each
participant. Finally, future research may benefit from analyzing video game motivation
relationships with personality and sleep quality. The data in this study revealed relationships
between these variables that was not hypothesized, suggesting possible relationships may be
present and able to be explored in the future.
The results of this study could be used for educational purposes. This may provide better
insight as to whether violent or nonviolent video games have a positive or negative effect on
sleep quality. This could be particularly useful within a college or university setting, since a large
portion of video game players are over the age of 18. This research may also aid in reducing poor
sleep quality by examining further relationships between these variables and using the findings
to apply interventions to video game players who would like to improve sleep quality. This could be completed through development of treatments for insomnia or other types of sleep disorders. Additionally, this study could be used as a starting point for future research, focusing on whether or not adults do play video games in a healthy manner. Future research in this field may present possibilities for video games to aid in improving sleep quality, rather than reducing sleep quality as presented in previous research. Video games may be able to improve one’s health and
36
Chapter VIII: References
Adam, E.K., Snell, E.K., and Pendry, P. (2007). Sleep timing and quantity in ecological and family context: a nationally representative time-diary study. Journal of Family Psychology, 21(1), 4-19. doi:10.1037/0893-3200.21.1.4.
American Psychiatric Association. (2013). Sleep-wake disorders. In Diagnostic and statistical manual of mental disorders (5th ed.). Washington, DC.
Anderson, C., and Bushman, B. (2001). Effects of Violent Video Games on Aggressive
Behavior, Aggressive Cognition, Aggressive Affect, Physiological Arousal, and Prosocial Behavior: A Meta-Analytic Review of the Scientific Literature. Psychological Science, 12(5), 353-359.
Anderson, C., and Dill, K. (2000). Video games and aggressive thoughts, feelings, and behavior in the laboratory and in life. Journal of Personality and Social Psychology, 78(4), 772-790. doi:10.1037//0022-3514.78.4.772.
Arriaga, P., Esteves, F., Carniero, P., and Monteiro, M.B. (2006). Violent computer games and their effects on state hostility and physiological arousal. Aggressive Behavior, 32, 358-371.
Ballard, M., and Wiest, J. R. (1996). Mortal Kombat (™): the effects of violent video game play on males’ hostility and cardiovascular responding. Journal of Applied Social Psychology, 26(8), 717-730. doi:10.1111/j.1559-1816.1996.tb02740.x.
Bosnjak, M. and Tuten, T. L. (2001). Classifying Response Behaviors in Web-based Surveys. Journal of Computer-Mediated Communication, 6.
doi:10.1111/j.1083-6101.2001.tb00124.x
Bradley, M. M., & Lang, P. J. (1994). Measuring emotion: the self-assessment manikin and the semantic differential. Journal of behavior therapy and experimental psychiatry, 25(1), 49-59.
Buysse, D. J., Reynolds, C. F., Monk, T. H., Berman, S. R., & Kupfer, D. J. (1989). The Pittsburgh Sleep Quality Index: a new instrument for psychiatric practice and research. Psychiatry research, 28(2), 193-213.
37
Eggermont, S. and Van den Bulck, J. (2006). Nodding off or switching off? The use of popular media as a sleep aid in secondary-school children. Journal of Paediatrics and Child Health, 42, 428–433. doi:10.1111/j.1440-1754.2006.00892.x.
Entertainment Software Association. (2015, April). Essential facts about the computer and video game industry. Retrieved June 12, 2016, from
http://www.theesa.com/wp-content/uploads/2015/04/ESA-Essential-Facts-2015.pdf .
Exelmans, L. and Van den Bulck, J. (2014). Sleep quality is negatively related to video gaming volume in adults. Journal of Sleep Research, 24, 189–196. doi:10.1111/jsr.12255. Graham, L. T. and Gosling, S. D. (2013). Personality Profiles Associated with Different
Motivations for Playing World of Warcraft. Cyberpsychology, Behavior, and Social Networking, 16(3). doi: 10.1089/cyber.2012.0090.
Harvey, A.G., Stinson, K., Whitaker, K.L., Moskovitz, D., and Virk, H. (2008). The subjective meaning of sleep quality: a comparison of individuals with and without insomnia. Sleep, 31(3), 383-393. doi:10.1093/sleep/31.3.383.
Herpertz, S. C., Mueller, B., Mutaz, Q., Lichterfeld, C., Konrad, K., & Herpertz-Dahlmann, B. (2005). Response to emotional stimuli in boys with conduct disorder. American
Journal of Psychiatry, 162, 1100-1107.
Huang, V., Peck, K., Mallya, S., Lupien, S., and Fiocco, A. (2016). Subjective sleep quality as a possible mediator in the relationship between personality traits and depressive symptoms in middle-aged adults. PLoS ONE, 11(6), e0157238. doi: 10.1371/journal.pone.0157238. Kanno, Y., Tsugawa, R., and Yoda, A. (2014). The relationship between subjective sleep quality,
depression, and personality traits. International Journal of Psychophysiology, 94(2), 224-225. doi:10.1016/j.ijpsycho.2014.08.885
Kim, H., Cho, J., Chang, Y., Ryu, S., Shin, H., and Kim, H. (2015). Association between
personality traits and sleep quality in young korean women. PLoS ONE, 10(6), e0129599. doi:10.1371/journal.pone.0129599.
King, D. L., Gradisar, M., Drummond, A., Lovato, N., Wessel, J., Micic, G., Douglas, P. and Delfabbro, P. (2013). The impact of prolonged violent video-gaming on adolescent sleep: an experimental study. Journal of Sleep Research, 22, 137–143. doi:10.1111/j.1365-2869.2012.01060.x.
Lenhart, A., S. Jones and Macgill, A.R.(2008). ‘Video Games: Adults Are Players Too, Pew Internet & American Life Project, URL (retrieved 4 October 2016): http://pewresearch. org/pubs/1048/video-games-adults-are-players-too.
38
the National Institute of Health: http://www.nhlbi.nih.gov/health/health-topics/topics/sdd/why.html.
National Sleep Foundation. (1999-2004) Retrieved November 20, 2014 from the National Sleep Foundation: http://sleepfoundation.org/.
Nije Bijvank, M., Konijn, E. A., & Bushman, B. J. (2012). Motivations for Video Game Use Scale. PsycTests, doi:10.1037/t26478-000
Öztürk, C., Bektas, M., Ayar, D., Özgüven Öztornaci, B., Yağci, D.(2015). Association of Personality Traits and Risk of Internet Addiction in Adolescents. Asian Nursing Research, 9(2), 120-124.
Paturel, A. (2014). Game theory: how do video games affect the developing brains of children and teens? Neurology Now, 10(3), 32-36.
Rammstedt, B., & John, O. P. (2007). Measuring personality in one minute or less: A 10-item short version of the Big Five Inventory in English and German. Journal of research in Personality, 41(1), 203-212.
Sherry, J.L., Greenberg, B.S., Lucas, K, and Lachlan, K.A. (2006). Video game uses and gratifications as predictors of use and game preference. International Journal of Sports Marketing and Sponsorship, Chapter 15.
Teng, C. (2008). Personality differences between online game players and
non players in a student sample. Cyberpsychology & Behavior, 11(2), 232–234. Van den Bulck, J. (2004b). Television viewing, computer game playing, and Internet use and
self-reported time to bed and time out of bed in secondary-school children. Sleep, 27(1), 101-104.
Vgontzas, A. N., Zoumakis, E., Bixler, E. O., Lin, H. M., Follett, H., Kales, A., & Chrousos, G.P. (2003). Adverse Effects of Modest Sleep Restriction on Sleepiness, Performance, and Inflammatory Cytokines. The Journal of Clinical Endocrinology & Metabolism, 89(5), 2119-2126 doi: http://dx.doi.org/10.1210/jc.2003-031562.
Willenz, P. (2002). Violent video games can increase aggression. Washington, DC: American Psychological Association.
Witt, E. A., Massman, A. J, and Jackson, L. A. (2011). Trends in youth’s videogame playing, overall computer use, and communication technology use: the impact of self-esteem and the Big Five personality factors. Computers in Human Behavior, 27(2), 763-769.
doi:10.1016/j.chb.2010.10.025.
39
role-playing game. Computers in Human Behavior, 38, 322–330. doi:10.1016/j.chb.2014.06.009.
Yee, N., Ducheneaut, N., and Nelson, L. (2012). Online gaming motivations scale:
40 Table 1
Average Level of Video Game Violence
Mean Standard Deviation
Violence Game 1 4.30 1.81
Violence Game 2 4.37 2.03
Violence Game 3 3.88 2.12
41
Table 2
Three Stage Hierarchical Regression Analysis between Gamer Type, Average Change in Arousal, Personality, and Sleep Quality
Stage 1 Stage 2 Stage 3
Variable B SE B β B SE B β B SE B β
Gamer Type .000 .051 -.088 .000 .001 -.082 .000 .000 -.064 Average Arousal
Change (HR) -.064 .092 -.072 -.046 .094 -.052
Extraversion .173 .111 .169
Agreeableness -.250 .230 -.112
Conscientiousness -.190 .105 -.187*
Neuroticism -.307 .110 -.290**
Openness .078 .104 .077
42 Table 3
Correlation Analyses between Overall Sleep Quality, Gamer Type, and Average Change in Arousal
Overall Sleep Quality Gamer Type Average Change in Arousal
Overall Sleep Quality - -.088 .151
Gamer Type -.088 - -.029
Average Change in
Arousal .151 -.029 -
43 Table 4
Correlation Analyses between Overall Sleep Quality and Video Game Playing Motivations Overall
Sleep Quality
Social Competition
Fantasy-Escape Fantasy-Arousal Unwind Challenge Diversion
Overall Sleep
Quality - -.023 .069 .068 -.053 .239* -.053 -.142
Social -.023 - .085 .027 .178 .066 -.020 .032
Competition .069 .085 - .110 .059 .244* .079 .193
Fantasy-Escape .068 .027 .110 - .354** .297** .181 .155
Fantasy-Arousal
-.053 .178 .059 .354** - .128 .169 -.089
Unwind .239* .066 .244* .297** .128 - .155 .076
Challenge -.053 -.020 .079 .181 .169 .155 - .122
44 Table 5
Correlation Analyses between Overall Sleep Quality and Personality Factors Overall
Sleep Quality
Extraversion Agreeableness Conscientiousness Neuroticism Openness
Overall Sleep
Quality - .147 -.082 -.121 -.214* .052
Extraversion .147 - .231* .019 .124 .139
Agreeableness -.082 .231* - .032 -.002 .017
Conscientiousness -.121 .019 .032 - -.237* -.027
Neuroticism -.214* .124 -.002 -.237* - .150
Openness .052 .139 .017 -.027 .150 -
45 Appendix A: List of Favorite Games / Most Played
Participant Number: .
Please list your top three / three favorite video games. These may be either PC or console games. Using a 7-Point Likert scale, please circle how much violence each game contains, with 1 meaning no violence and 7 meaning extreme violence.
Game 1:
1 2 3 4 5 6 7
Game 2:
1 2 3 4 5 6 7
Game 3:
1 2 3 4 5 6 7
1 2 3 4 5 6 7
No Violence
Little Violence
Some Violence
Violence Moderate Violence
Strong Violence
46 Appendix B: Demographic Questionnaire
Please answer the following general background questions. Please try to answer all
questions. Circle the letter that corresponds with your response or fill in the blank.
1. What is your age?
Age: .
2. What is your gender?
a. Male
b. Female
c. Other
3. What is your highest completed education?
a. High School Diploma / GED
b. Associate’s Degree
c. Bachelor’s Degree
d. Master’s Degree
e. Doctorate
f. Other (please describe)
4. What is your race?
a. African American/Black
b. Arabic or Middle Easterner
47 d. Caucasian/White
e. Hispanic
f. Native American/American Indian
g. Indian
h. Other (please describe)
5. How often do you play video games?
. Days per Week
6. Do you play video games alone or with others?
a. Alone
b. With Others
7. Do you play video games with others in person or online?
a. In person
b. Online
c. I play video games alone
8. Where do you typically play video games? Please list as many as necessary.
48 Appendix C: Diary
Video Game Playing Behaviors Diary
Participant Number:
.Please complete the following information each time you play a video
game.
Please return to the researcher, Mallory Stankovich, at the end of 48
hours at your scheduled time.
Contact MStankov@umich.edu with any questions.
Video Game Name:
Time Start:
49 Time End:
Please circle the number that indicates your level of arousal (feeling calm or excited) after playing the game.
Video Game Name:
Time Start:
Please circle the number that indicates your level of arousal (feeling calm or excited) before playing the game.
50
Please circle the number that indicates your level of arousal (feeling calm or excited) after playing the game.
Video Game Name:
Time Start:
Please circle the number that indicates your level of arousal (feeling calm or excited) before playing the game.
Time End:
51 Video Game Name:
Time Start:
Please circle the number that indicates your level of arousal (feeling calm or excited) before playing the game.
Time End:
Please circle the number that indicates your level of arousal (feeling calm or excited) after playing the game.
52 Time Start:
Please circle the number that indicates your level of arousal (feeling calm or excited) before playing the game.
Time End:
Please circle the number that indicates your level of arousal (feeling calm or excited) after playing the game.
Video Game Name:
53
Please circle the number that indicates your level of arousal (feeling calm or excited) before playing the game.
Time End:
Please circle the number that indicates your level of arousal (feeling calm or excited) after playing the game.
Video Game Name:
Time Start:
54 Time End:
Please circle the number that indicates your level of arousal (feeling calm or excited) after playing the game.
Video Game Name:
Time Start:
Please circle the number that indicates your level of arousal (feeling calm or excited) before playing the game.
Time End: