Tsoularis, A (2018) A Stochastic Differential Equation Inventory Model. International Journal of
Ap-plied and Computational Mathematics, 5 (1). ISSN 2349-5103 DOI:
https://doi.org/10.1007/s40819-018-0594-7
Link to Leeds Beckett Repository record:
http://eprints.leedsbeckett.ac.uk/5785/
Document Version:
Article
Creative Commons: Attribution 4.0
The aim of the Leeds Beckett Repository is to provide open access to our research, as required by
funder policies and permitted by publishers and copyright law.
The Leeds Beckett repository holds a wide range of publications, each of which has been
checked for copyright and the relevant embargo period has been applied by the Research Services
team.
We operate on a standard take-down policy.
If you are the author or publisher of an output
and you would like it removed from the repository, please
contact us
and we will investigate on a
case-by-case basis.
https://doi.org/10.1007/s40819-018-0594-7 ORIGINAL PAPER
A Stochastic Differential Equation Inventory Model
A. Tsoularis1
Published online: 22 December 2018 © The Author(s) 2018
Abstract
Inventory for an item is being replenished at a constant rate whilst simultaneously being depleted by demand growing randomly and in relation to the inventory level. A stochastic differential equation is put forward to model this situation with solutions to it derived when analytically possible. Probabilities of reaching designated a priori inventory levels from some initial level are considered. Finally, the existence of stable inventory states is investigated by solving the Fokker–Planck equation for the diffusion process at the steady state. Investigation of the stability properties of the Fokker–Planck equation reveals that a judicious choice of control strategy allows the inventory level to remain in a stable regime.
Keywords Diffusion process·Itô solution·Fokker–Planck equation·Time-dependent Ornstein–Uhlenbeck process
Introduction
It has been recognized for some time that the demand for some items may be proportional to the inventory on display. Baker and Urban [1] argued that the demand rate of an item is of a polynomial functional form, dependent on the inventory level. A thorough review of such demand models has been carried out by Urban [2]. In his 2005 article Urban stated that two distinct functional models for the demand rate were dominant, Type I Models, where the demand rate advanced on the initial inventory alone, and Type II Models, where the demand rate was a continuous (predominantly a power) function of the inventory level. Tsoularis [3] used the type of demand function in this article to solve an optimal inventory control problem but no deep analysis of the stochastic differential equation was undertaken.
In this work we propose that the demand growth rate,d, is a continuous function of the inventory level,x, assuming the quadratic form:
d(x)d1x−d2x2 (1)
whered1andd2are both positive constants that establish the concavity (d(x)<0) of the
function (1). The growth in demand is at its most rapid for small inventory levels, governed primarily by the coefficientd1, rising gradually at a decreasing rate (d(x)>0, d(x)<0),
B
A. Tsoularisdue to the influence of the coefficientd2, until the inventory reaches the level,x 2dd12(d(x)
0), where the demand rate is at its peak value, d21
4d2. This behaviour of the demand rate is a feature of the Type II Models reviewed by Urban [2]. However, when the inventory exceeds
d1
2d2, the growth in demand declines rapidly (d
(x)< 0, d(x)<0) and ceases altogether
(d(x)0) whenx d1
d2. This constitutes a departure from Type II Models and allows the realistic possibility of saturation in demand when the product inventory reaches a sufficiently high level.
We introduce next an element of stochasticity in the demand growth Eq. (1) by allowing the dominant growth parameter,d1, to be a random variable that evolves according to
d1(t) ¯d1−σ η(t) (2)
whered¯1is the mean value,η(t) is the continuous time Gaussian white noise andσis the
diffusion coefficient measuring the intensity of the disturbance. In discrete time, white noise is a sequence of independent uncorrelated random variables. In continuous time, however, the autocorrelation is the Dirac delta function,E[η(t)η(t+s)]δ(s). The white noise, although not an actual physical process, is a useful approximation to physical situations where noise is inherently present in the dynamics of a process [4].
The stochastic equivalent of the demand growth form (1) is
d(x)d¯1x−d2x2
−σxη(t) (3)
The change in the actual demand induced byd(x) in an infinitesimal interval,dt, is
d(x)dt d¯1x−d2x2
dt−σxdw (4)
whereη(t) is symbolically written as the derivative of Brownian motion,w(t),as the Wiener process is nowhere differentiable.
In a small time interval,dt, demand grows byd(x)dtand the inventory is replenished at a rateudt, so the infinitesimal inventory change is (u-d(x))dt. Using (4) we can formulate the following stochastic differential equation (SDE):
d x(u−d(x))dtu−(d¯1x−d2x2)
dt+σxdw (5)
with drift,u−(d¯1x−d2x2), and diffusion coefficient,σx.
The Stochastic Differential Inventory Equation
By making the notational substitutions,α ¯d1andD dd¯12, we may rewrite (5) as the SDE:
d x
u−αx
1− x
D
dt+σxdw (6)
so that the mean demand growth,d¯1x −d2x2, adopts the more familiar logistic form,αx
1− Dx. We shall assume an initial inventory,x0 ∈ [0,D) and that the control variable, u, assumes a constant value throughout some interval [0,t]. Moreover (6) will be valid for
x ∈[0,D) only, that is, the inventory will obey (6) so long asxis bounded form above byD, and (6) will be no longer valid forx ≥D. The mean value of the random parameterd1,α,
occur at small values thenD→ ∞and demand grows linearly with inventory, which in this case evolves thus:
d x(u−αx)dt+σxdw (7)
Strong and weak solutions to SDEs are subject to certain conditions. In strong solutions, the Brownian motions are given on a given probability space whereas in weak solutions the Brownian motion is chosen. The existence and uniqueness of a continuous path strong solution to SDE (6) is subject to the following two conditions [5]:
(i) The Lipschitz condition:
u−αx1
1− x1
D
−u−αx2
1− x2
D
+|σx
1−σx2| ≤L|x1−x2|
for some constant independent of timet,L, in some time interval, [0,T] andx1,x2 ∈
[x0,D]. This is essentially a smoothness condition which is fulfilled in the sufficient as
the functions,u−αx1− Dxandσx, are continuously differentiable. (ii) The growth condition:
u−αx
1− x
D
2
+|σx|2≤L2(1 +|x|2)
in some finite time interval, [0,T]. This condition is imposed to prevent the solution to (6) becoming infinite in [0,T], which is always the case whenuandσ are bounded from above byL.
Provided these existence and uniqueness conditions are met, for an initial condition,
x(0)x0, with finite variance,E[x20]<∞, a strong solution to (6) exists as a continuous
path. The Itô solution is a Markov process given by the integral equation
x(t)x0+
t
0
u−αx
1− x
D
dt+
t
0
σxdw (8)
The first integral in (8) is a standard Riemann integral and the second is an Itô integral, whose convergence is interpreted in the mean square sense (L2), li m
n→∞E n
i1σx(ti−1)(w(ti)−w(ti−1))−
t
0σxdw
2 0.
Solution to SDE (
6
)
In this section a solution to the temporally homogeneous process (6) is presented for two distinct cases: (i) when the order rate,u, is a nonzero constant, and (ii) whenu0.
Solution to SDE (6) withu0
First introduce the integrating factor:
F(t)exp
σ2t
2 −σ w(t)
Definey(t)x(t)F(t),with y(0)x0,and proceed to derive the random differential
d y dt F
u−αx
1− x
D
F
u−αy F
1− y
F D
F u−αy
1− y
F D
,
or
d y dt +αy−
α F Dy
2F u (9)
This is a Riccati equation with a random coefficient,−F Dα , of the nonlinear term, and a random forcing function,Fu. We shall not make any further attempt to solve Eq. (9) in this article.
Directly from (6) we obtain a differential equation for the mean inventory,E[x(t)]:
d
dtE[x(t)]u−αE[x(t)] + α DE[x
2(t)] (10)
To derive the equation for the variance of the solution to (6) we use Itô’s formula:
d(x2(t))2xd x+ (d x)22xd x+σ2x2dt
2ux+ (σ2−2α)x2+ 2αx
3
D
dt+ 2σx2dw
Hence,
d dtE[x
2(t)]2u E[x(t)] + (σ2−2α)E[x2(t)] + 2α DE[x
3(t)] (11)
(10) and (11) are the first two differential equations in a recursive scheme of differential equations involving higher moments,E[xn(t)],n≥3,obtained by repeated application of Itô’s formula ond(xn(t)).
Solution to SDE (6) when the Noiseis Small
In many practical applications, the diffusion parameter, σ, is small. In such cases, it is reasonable to assume that the solution to the SDE will be a stochastic perturbation of the deterministic solution asσ →0. We assume a solution to (6) of the form
x(t)y(t) +
∞
n1 σnx
n (12)
wherey(t) is the solution to the deterministic differential equation
d y
dt u−αy
1− y
D
, y(0)x0
which can be obtained by separation of variables.
The drift term,u−αx1− Dx, can be expanded via a Taylor series around the solution
y(t):
u−αx
1− x
D
u−αy
1− y
D
+
2αy D −α
∞
n1 σnxn
+2α
D
∞
n1 σnxn
2
(13)
The diffusion term,σx, can also be expanded as a power series:
σx σy+
∞
n1 σn+1x
We substitute next the expansions (13) and (14) in (6) and equate coefficients of like powers ofσto obtain an infinite set of stochastic differential equations. We write below only the first two which are often adequate in practice:
d y(t)
u−αy
1− y
D
dt (15)
d x1(t)
2αy
D −α
x1+ydw (16)
SDE (16) is a time-dependent Ornstein–Uhlenbeck process whose solution is the first order linearization of (6) around the deterministic solution found directly from (15). The solution to (16) with the obvious initial condition,x1(0)0,is
x1(t)
t
0
y(τ) exp
⎛ ⎝
t
τ
2αy(s)
D −α
ds
⎞
⎠dw(τ) (17)
The Itô integral solution (17) is a Gaussian random variable, and as such it can assume any value with finite probability. The validity of the series expansion is investigated in [6] where it is shown that it is asymptotic,x(t)−y(t)− nm1σnxn ∼σm+1.
Solution to SDE (6) withu0
Whenu0, (6) is a Bernoulli equation which is transformed via the substitutionz 1y to the standard form
d z
dt −αz − α F D
with solution
z(t) 1
x0
eαt−αe αt
D
t
0
exp
−
α+σ
2
2
τ+σ w(τ)
dτ
and finally, by virtue ofx(t) z(t)1F(t),
x(t)
exp
−α+σ22
t+σ w(t)
1
x0 −
α
D
t
0exp
−α+σ22
τ+σ w(τ)
dτ
(18)
The solution is not a Gaussian process as the Wiener process,w(t), appears in the exponent.
Solution to SDE (
7
)
Solution to SDE (7) withu0
As in “Solution to SDE (6) withu0” section, first introduce the integrating factor,F(t) exp
σ2t
2 −σ w(t)
, then proceed along the same lines as before we arrive at the final solution:
x(t)x0exp
σ w(t)− σ
2t
2 −αt
+u
t
0
exp
σ (w(t)−w(τ))+
σ2
2 +α
(τ−t)
dτ
(19)
The expected value of exp(σ(w(t)−w(τ)), whereσ(w(t)−w(τ)) is a Gaussian variable with zero mean, is given byE[σ(w(t)−w(τ))]exp
σ2
2 (t−τ)
,sincew(t)−w(τ) is
nor-mally distributed,N~ (0,t−τ), and the standard formula,E[eZ]expE[Z] +12V ar(Z) [6], for a normally distributed random variableZ, is applicable here. The expected value of
x(t) is then given by the following formula, which is independent ofσ:
E[x(t)] u
α +
x0− u α
e−αt (20)
Ast→ ∞,,
li m
t→∞E[x(t)]
u
α (21)
The average inventory will be increasing in time ifx0< αu, decreasing ifx0> uα, and remain
static atx0ifx0 uα.
The variance can be found by first solving the differential equation
d dtE[x
2(t)]−(σ2−2α)E[x2(t)] 2u2 α + 2u
x0− u α
e−αt
forE[x2(t)] using the integrating factor,e
2α−σ2t. The solution is then
Ex2(t)x02eσ2−2αt+2u
2
α
1−eσ2−2αt
2α−σ2 + 2u
x0− u α
e−αt−eσ2−2αt
α−σ2 (22)
Solution to SDE (7) withu0
Whenu0 (7) reduces to:
d xx(−αdt+σdw), x(0)x0, w(0)0 (23)
a geometric Brownian motion with the well-known solution, x(t) x0exp
σ w(t)−αt−σ22t
, mean, E[x(t)] x0e−αt, and variance,V ar[x(t)] x02e−2αt
eσ2t−1
.
The Boundary at
x
0
The inventory,x=0, is an intrinsic boundary of the diffusion process (6) because the diffusion coefficient,σx, vanishes there. Its classification is dependent on the integrability of the scale function,S(ξ)x0
s(ξ)exp
⎛ ⎜ ⎝−
ξ
2u−αz1−Dz
σ2z2 d z
⎞ ⎟
⎠forξ ∈(0,x0)
Nows(ξ)ξσ2α2 exp
2u
σ2ξ − D2σα2ξ
,and the value of the scale function is
S(0)
x0
0
ξσ2α2 exp
2u σ2ξ −
2α
Dσ2ξ
dξ ∞
As the scale function is divergent atx 0,x0 is a natural boundary according to the Russian literature classification scheme [7]. According to another classification scheme proposed by Feller [5,8], one classifies the point,x0, based on the convergence of the integral
x
0
⎛ ⎜ ⎝
x0
ξ s(z)d z
⎞ ⎟ ⎠σ2ξ12
s(ξ)dξ
The above integral is convergent, and according to Feller,x0 is an entrance boundary. An entrance boundary cannot be reached from the interior of the state space, that is the inventory cannot vanish in finite time from some initial value,x00. The inventory however, can start
fromx00 and quickly build up to nonzero values.
In the absence of any orders,u0, and
s(ξ)ξ2ασ2 exp
− 2α Dσ2ξ
The scale function
S(0)
x0
0
ξσ2α2 exp
− 2α Dσ2ξ
dξ <∞
converges in the vicinity ofx0. The boundary,x0, is attracting and the inventory never attains the boundary zero in finite time.
When D → ∞, then s(ξ) ξσ2α2 exp
2u
σ2ξ
, and the scale function, S(0)
x0
0 ξ
2α σ2 exp
2u
σ2ξ
dξ ∞. The integral,0xx0
ξ s(z)d z
1
σ2ξ2s(ξ)dξ <∞, and the bound-ary,x0, is a natural boundary under the Russian classification scheme and an entrance
boundary in the sense of Feller. Foru0,S(0)
x0
0
ξ2ασ2dξ <∞, andx0 is an attracting
boundary.
First Passage Times and Probabilities of Exit Through Absorbing
Barriers
In this section we look at how long the inventory, initially atx0at timet0, remains in the
interval (xl, xr), which is assumed to containx0,xl<x0<xr. By erecting artificial absorbing
barriers atxl andxr we investigate the probability that the inventory crosses over either
πlprobability of exit throughxl,
πr probability of exit throughxr,
Passage Probabilities for SDE (
6
) with
D
<
∞
The solution to the ordinary differential equation
σ2x2
2
d2π d x2 +
u−αx
1− x
D
dπ
d x 0 (24)
yields the probabilities of exit through eitherxlorxr, starting fromx0, with the boundary
conditions:
πl(xl)1, πr(xr)0, if the exit is through,xl,
πl(xl)0, πr(xr)1, if the exit is through,xr,
πl(x0) +πr(x0)1.
The probabilities are given by
πl(x0)
xr
x0
x2ασ2 exp
2u σ2x −
2α
Dσ2x
d x
xr
xl
x2ασ2 exp
2u σ2x −
2α
Dσ2x
d x
(25)
πr(x0)1−πl(x0)
x0
xl
xσ2α2 exp
2u σ2x −
2α
Dσ2x
d x
xr
xl
x2ασ2 exp
2u σ2x −
2α
Dσ2x
d x
(26)
The definite integrals in (25) and (26) can be evaluated in the following manner. First expand exp
2u
σ2x
as a power series:
b
a
xσ2α2 exp
2u σ2x −
2α
Dσ2x
d x b a exp
− 2α Dσ2x
⎛ ⎜ ⎝
∞
n0
2u
σ2
n
xσ2α2−n
n!
⎞ ⎟ ⎠d x
Then introduce the transformation,z D2σα2x, so that a series of upper incomplete Gamma functions arises [9]:
b
a
xσ2α2 exp
2u σ2x −
2α
Dσ2x
d x 2αb Dσ2 2αa Dσ2
e−z ∞
n0
2u
σ2
n Dσ2
2α
2α σ2+1−n
zσ2α2−n
n! d z
∞
n0
Dσ2
2α
2α σ2+1−n2u
σ2 n n! 2αb Dσ2 2αa Dσ2
e−zzσ2α2−nd z
∞
n0
Dσ2
2α
2α σ2+1−n2u
σ2 n n! Γ 2α
σ2 + 1−n,
2α
Dσ2a
−Γ
2α
σ2 + 1−n,
2α
Dσ2b
Mean Passage Times Through Boundaries withD<∞
The solution to the following ordinary differential equation
σ2x2
2
d2T d x2 +
u−αx
1− x
D
d T
d x −1 (28)
with the boundary conditions
T(xl)T(xr)0
yields the mean first passage times through eitherxlorxr. The solution to (28) with integration
constantsk1,k2is
T(x)
xr
x
⎛ ⎜ ⎝k1− ∫
x xl
2
σ2y
−2
1+σα2
ex p
−2u
yσ2 +D2σα2y
d y
z−σ2α2ex p
−2u zσ2 +
2α
Dσ2z
⎞ ⎟
⎠d z+k2 (29)
Passage Probabilities for SDE (7) withD ∞
The solution to the ordinary differential equation, with the same boundary conditions as in the last section,
σ2x2
2
d2π
d x2 + (u−αx) dπ
d x 0 (30)
gives the exit probabilities
πl(x0)
xr
x0 x 2α σ2eσ2u2xd x
xr
xl x 2α σ2eσ2u2xd x
, πr(x0)1−πl(x0)
x0
xl x 2α σ2e
2u σ2xd x
xr
xl x 2α σ2eσ2u2xd x
(31)
The integrand,x2ασ2eσ2u2x, in (34) can be expressed as the power series, ∞
n0
2u
σ2
n
xσ2α2−n, which can then be integrated term by term. Ifσ2u2 is a large quantity however, on account of the order,u, being several orders of magnitude larger thanσ2, the integrals in (31) behave like
Laplace integrals [9] of the form,abxσ2α2eσ2u2xd x. As the functions,xσ2α2 and d
d x
1
x
−1
x2, vanish nowhere in the interval (a,b), an asymptotic expression for the Laplace integral is possible:
b
a
x2ασ2e 2u
σ2xd x∼ σ
2
2u
a2ασ2+2e 2u
σ2a −bσ2α2+2e 2u σ2b
, 2u
σ2 → ∞ (32)
Mean Passage Times Through Boundaries withD ∞
The differential equation is in this case
σ2x2
2
d2T
d x2 +(u−αx) d T
d x −1 (33)
with the boundary conditions
and solution
T(x)
xr
x
⎛ ⎜ ⎝k1− ∫
x xl
2
σ2y
−21+α
σ2
ex p
−2u yσ2
d y
z−σ2α2ex p
−2u zσ2
⎞ ⎟
⎠d z+k2 (34)
Stationary Solution of the Fokker–Planck Equation and Existence
of Stable States
The Kolmogorov forward equation of Fokker–Planck equation governs the evolution of the transition probability density, f(x(t)|x0x(0)), henceforth denoted byf.
Stationary Solution to the Fokker–Planck Equation for SDE (6)
For (6) the Fokker–Planck equation reads
∂f ∂t −
∂u−αx1−Dxf
∂x +
σ2
2
∂2f x2
∂x2 (35)
If ast→ ∞the system attains a probability density,f∗(x), independent of time, the sys-tem exhibits stationary behaviour. In this case (35) becomes an ordinary differential equation with solution
f∗(x) N
x2exp
⎛ ⎝
x
2u−αz1− Dz
σ2z2 d z
⎞
⎠N x−2ασ2−2exp
− 2u σ2x +
2α
Dσ2x
(36)
whereNis the integration (normalization) constant.
To qualify as a probability density, (36) must be normalizable, that is,
1
N
D
0
1
x2exp
⎛ ⎝
x
2u−αz1− Dz
σ2z2 d z
⎞
⎠d x <∞ (37)
Integrating (37) yields the definite integral
1
N
D
0
x−σ2α2−2exp
− 2u σ2x +
2α
Dσ2x
d x (38)
The variable substitution,z σ22ux, in (38) leads to the following series representation:
1
N ∞
n0
2α
Dσ2
n
2u
σ2
n−1−2α
σ2
n! Γ
2α
σ2 + 1−n,
2u σ2D
(39)
Stationary Solution to the Fokker–Planck Equation for SDE (7)
The Fokker–Planck equation now reads
∂f ∂t −
∂((u−αx)f)
∂x +
σ2
2
∂2f x2
∂x2 (40)
and the stationary density reads
f∗(x) N
x2 exp
⎛ ⎝
x
2(u−αz)
σ2z2 d z
⎞
⎠N x−σ2α2−2e−σ2u2x (41)
where the normalization constant,N, is now furnished by the much simpler expression:
1
N
σ2
2u
2α σ2+1
Γ
2α
σ2 + 1
(42)
Extrema of Stationary Densities
The qualitative behaviour of the inventory process is determined by the extrema of the sta-tionary density [10]. For (36) the extrema are supplied by the two roots of the quadratic equation:
u−αx
1− x
D
−σ2x0 (43)
given by
x∗1 D(α+σ
2)−D2(α+σ2)2−4αDu
2α
x∗2 D(α+σ
2) +D2(α+σ2)2−4αDu
2α (44)
Both roots are real if Du ≤ (α+4σα2)2. For Du (α+4σα2)2, we have a double root, which is an inflection point atx∗1 x2∗ α2u
+σ2. If the condition, Du <
(α+σ2)2
4α , holds, the stable root,x1∗,
falls belowDwhen eitherσ2≤α,orσ2>maxα,Du.
Differentiation of (43) with respect toxreveals thatx1∗is a relative maximum andx2∗>x1∗
is a relative minimum. The inventory tends to move away from the relative minimum,x2∗, towards the relative maximum,x1∗, which represents the stable inventory state of the diffusion process.
Probabilistic Potentials
Use the exponent in (37) to define the following function:
φ(x) −
x
2u−2αz1− Dz
σ2z2 d z
2u σ2x −
2αx σ2D +
2αlnx
σ2 (45)
ξ1
Dα−√D2α2−4Duα
2α
ξ2 Dα
+√D2α2−4Duα
2α (46)
If Du α4 thenφD2φD20 andφD2<0, sox D2 is an inflection point. If
u
D > α4 however,φ(x)<0, andφ(x) is uniformly decreasing so no global minimum exists,
as the order rate,u, always exceeds demand growth (constantly positive drift).
The probabilistic potential,φ(x), is analogous to the potential (Lyapunov) function in Classical Mechanics. The rootξ1 is a stable minimum and the second root,ξ2 > ξ1, is an
unstable maximum. The inventory will tend to drift towards levels that minimizeφ(x) and maximize f∗(x). But the maximum, x1∗, of f∗(x) does not in general coincide with the minimum,ξ1, ofφ(x), unless the diffusion term is just an additive constant, independent of x. In practice, stable inventory values will be those that fall within the valley ofφ(x) and the peak off∗(x). Ifφ(x) does not have a minimum but f∗(x) still has a maximum, then there is a non-negligible probability that the inventory will fall anywhere in the range, [0,D), which is clearly an undesirable consequence whenDis large in relation to the existing stock.
The density (41) has a unique maximum at
x∗ u
α+σ2 (47)
and the associated probabilistic potential function,φ(x) σ22u
x +
2αlnx
σ2 , a unique minimum at
ξ∗ u
α (48)
Approximation of the Stationary Density by a Normal Density in the Vicinity of Its Extremum
The probability density function (36),f∗(x)N x−σ2α2−2exp
−2u
σ2x + D2σα2x
, is reasonably symmetric atx x1∗. Its second derivative atx x1∗is
(f∗)(x∗1)
− 4u
σ2(x∗ 1)3
+ 2 (x1∗)2
α
σ2 + 1
f∗(x1∗) −c f∗(x1∗)
wherec
4u
σ2(x∗ 1)3 −
2 (x∗1)2
α σ2 + 1
>0.
We can approximate f∗(x) by a Gaussian density,g(x), in the neighbourhood ofx1∗[10]. The Gaussian density must have the form
g(x) f∗(x1∗) exp
−c
x−x1∗2
2
(49)
so thatg(x1∗)0 andg(x1∗) −c f∗(x1∗)(f∗)(x∗1). The area,A, under the Gaussian function,g(x), is given by
A f∗(x∗1)
D
0
exp
−c(x−x1∗)2
2
d x f∗(x1∗)
π
2c
erf
(D−x1∗)
c 2
−erf
−x∗1
c 2
where erf(x) is the well known error function, erf(x) √2 π
x
0 e−t
2
dt [11]. The effective width,ε, of the peak of the Gaussian function,g(x), is the width of the rectangle that has the same height as its peak, f∗(x1∗), and the same area,A. So
ε A
f∗(x1∗)
π
2c
erf
(D−x1∗)
c 2
−erf
−x∗ 1
c 2
(50)
The probability density (41), f∗(x) N x−2ασ2−2exp
− 2u
σ2x
, can also be approximated by the normal density
g(x) f∗(x∗) exp
−c(x−x∗)2
2
(51)
wherec(x2∗)2
α σ2 + 1
>0.
The effective width for (51) is similarly given by
ε
π
2c
erf
(D−x∗)
c 2
−erf
−x∗
c 2
(52)
The effective width is useful in practice as it designates the range of approximately stable inventory levels located within±ε2the theoretically obtained stable steady states,x1∗(D<∞) andx∗(D ∞).
The Gaussian density,g(x), is a credible approximation to f∗(x) when bothφ(x) and
f∗(x) possess extreme values in [0,D), so that the effective width forg(x) represents the basin of stability.
A Numerical Example
We close the paper by a simple numerical demonstration of the key findings. Letx05,u
5,D400, α0.2, σ0.3.
Figure1below shows 5 sample path realizations and the evolution of the mean inventory level.
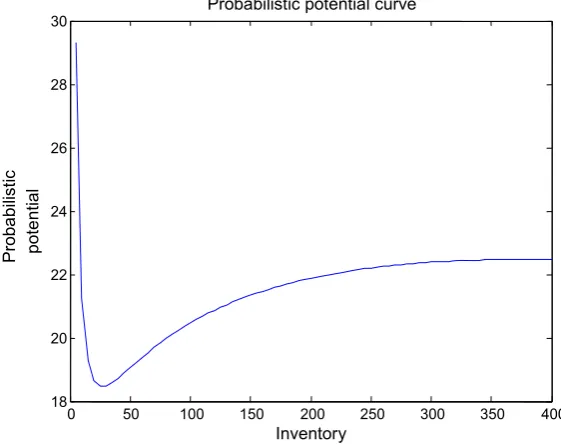
Figure2below displays the stationary probability density,f∗(x), and its Gaussian approx-imation,g(x). The maximum density inventory isx1∗≈18 from (44) and the effective width isε ≈ 18 from (50), hence the range of stable inventory values is approximately [9,27]. Finally, Fig.3illustrates the probabilistic potential,φ(x), maximized atξ1≈27 from (46).
Finally, suppose the inventory planner wants to estimate for instance, the probability that the inventory, starting fromx0 5 will either double toxr 10 or drop toxl 4, when
the replenishment rate isu5 andα0.2, σ 0.3,D 400. From (25), (26) and (27) we obtain the probability estimates,π(xl 4) 0.0177 andπ(xr 10) 0.9823. If
the replenishment rate drops tou2 for instance, the probabilities become roughly equal,
π(xl 4)0.5089 andπ(xr 10)0.4911.
Discussion
0 0.1 0.2 0.3 0.4 0.5 0.6 0.7 0.8 0.9 1 4.5
5 5.5 6 6.5 7 7.5 8 8.5 9
t
x(
t)
Evolution of inventory
Mean
Fig. 1Simulation ofx(t) and E[x(t)]
0 50 100 150 200 250 300 350 400
0 0.005 0.01 0.015 0.02 0.025 0.03 0.035 0.04 0.045
Inventory
ytil
i
b
a
b
or
P
s
eiti
s
n
e
d
Stationary density and Gaussian approximation curves
Gaussian density Stationary
density
Fig. 2Plots off∗(x) andg(x)
[image:15.439.81.361.57.295.2] [image:15.439.77.362.323.550.2]0 50 100 150 200 250 300 350 400 18
20 22 24 26 28 30
Inventory
Proba
b
ilis
tic
pote
ntial
Probabilistic potential curve
Fig. 3Plot of probabilistic potential,φ(x)
possible. To assess the direction the inventory is likely to take, theoretical estimates of the probabilities of attaining arbitrary inventory levels from some current inventory state under a fixed replenishment scheme are explicitly determined in “First Passage Times and Proba-bilities of Exit Through Absorbing Barriers” section. Finally, in “Stationary Solution of the Fokker–Planck Equation and Existence of Stable States” section the issue of long term stable stock levels is thoroughly addressed and the constraint on the replenishment rate,u, for a stable inventory regime is explicitly obtained. The size of the stable regime derived from the approximation of the probability density to a Gaussian density, will depend on the magnitude of the diffusion parameter,σ. The probabilities of reaching prescribed inventory levels and the determination of the stability regime are useful practical parameters for the inventory planner.
Open Access This article is distributed under the terms of the Creative Commons Attribution 4.0 International License (http://creativecommons.org/licenses/by/4.0/), which permits unrestricted use, distribution, and repro-duction in any medium, provided you give appropriate credit to the original author(s) and the source, provide a link to the Creative Commons license, and indicate if changes were made.
References
1. Baker, R.C., Urban, T.L.: A deterministic inventory system with an inventory level-dependent demand rate. J. Oper. Res. Soc.39(9), 823–831 (1988)
2. Urban, T.L.: Inventory models with inventory-level dependent demand: a comprehensive review and unifying theory. Eur. J. Oper. Res.162, 792–804 (2005)
3. Tsoularis, A.: Deterministic and stochastic optimal inventory control with logistic stock-dependent demand rate. Int. J. Math. Oper. Res.6(1), 41–69 (2014)
[image:16.439.78.359.58.280.2]6. Gardiner, C.W.: Handbook of Stochastic Methods. Springer, Berlin (2002) 7. Horsthemke, W., Lefever, R.: Noise-Induced Transitions. Springer, Berlin (1984)
8. Feller, W.: Diffusion processes in one dimension. Trans. Am. Math. Soc.77(1), 1–31 (1954)
9. Bender, C.M., Orszag, S.A.: Advanced Mathematical Methods for Scientists and Engineers. Springer, Berlin (1999)
10. Gillespie, D.T.: Markov Processes. Academic Press, New York (1992)
11. Bell, W.W.: Special Functions for Scientists and Engineers. Dover, Mineola (2004)
![Fig. 1 Simulation of x(t) and E[x(t)]](https://thumb-us.123doks.com/thumbv2/123dok_us/11973.1001305/15.439.77.362.323.550/fig-simulation-of-x-t-and-e-x.webp)