Citation:
Matu, J and Gonzalez, JT and Ispoglou, T and Duckworth, L and Deighton, K (2018) The effects of hypoxia on hunger perceptions, appetite-related hormone concentrations, and energy intake: a systematic review and meta-analysis. Appetite, 125 (1). pp. 98-108. ISSN 1095-8304 DOI: https://doi.org/10.1016/j.appet.2018.01.015
Link to Leeds Beckett Repository record:
http://eprints.leedsbeckett.ac.uk/4643/
Document Version: Article
Creative Commons: Attribution-Noncommercial-No Derivative Works 4.0
The aim of the Leeds Beckett Repository is to provide open access to our research, as required by funder policies and permitted by publishers and copyright law.
The Leeds Beckett repository holds a wide range of publications, each of which has been checked for copyright and the relevant embargo period has been applied by the Research Services team.
We operate on a standard take-down policy. If you are the author or publisher of an output and you would like it removed from the repository, please contact us and we will investigate on a case-by-case basis.
1 Title: The effects of hypoxia on hunger perceptions, appetite-related hormone concentrations, 1
and energy intake: a systematic review and meta-analysis 2
Authors names: Jamie Matu,1 Javier T. Gonzalez,2 Theocharis Ispoglou,1 Lauren 3
Duckworth1 and Kevin Deighton1 4
Department and institution: 5
1Institute for Sport Physical Activity & Leisure, Leeds Beckett University, Leeds, United 6
Kingdom 7
2Department for Health, University of Bath, Bath, UK 8
Corresponding author: Dr Kevin Deighton, Institute for Sport Physical Activity & Leisure, 9
Leeds Beckett University, Leeds, LS6 3QS, United Kingdom (email: 10
[email protected], telephone number: +44 (0)113 8123582). 11
Shortened title: Effects of hypoxia on appetite 12
Keywords: Appetite; altitude; ghrelin; insulin 13
14
2 Abstract
16
Exposure to hypoxia appears to depress appetite and energy intake, however the mechanisms 17
are not fully understood. The aim of this review was to determine the magnitude of changes in 18
hunger and energy intake in hypoxic compared with normoxic environments, and establish any 19
alterations in appetite-related hormone concentrations. PubMed and The Cochrane Library as 20
well as MEDLINE, SPORTDiscus, PsycINFO and CINAHL, via EBSCOhost, were searched 21
through 1st April 2017 for studies that evaluated hunger, energy intake and/or appetite-related 22
hormones in normoxia and during hypoxic exposure in a within-measures design. A total of 28 23
studies (comprising 54 fasted and 22 postprandial comparisons) were included. A random-24
effects meta-analysis was performed to establish standardised mean difference (SMD) with 25
95% confidence intervals. Hypoxic exposure resulted in a trivial but significant decrease in 26
postprandial hunger scores (SMD: -0.15, 95% CI: -0.29 to -0.01; n=14; p=0.043) and a 27
moderate decrease in energy intake (SMD: -0.50, 95% CI: -0.85 to -0.15; n=8; p=0.006). 28
Hypoxic exposure resulted in a decrease (albeit trivial) in postprandial acylated ghrelin 29
concentrations (SMD: -0.16, 95% CI: -0.25 to -0.08; n=7; p<0.0005), and a moderate increase 30
in fasted insulin concentrations (SMD: 0.41, 95% CI: 0.17 to 0.65; n=34; p=0.001). Meta-31
regression revealed a decrease in postprandial acylated ghrelin concentrations (p=0.010) and 32
an increase in fasted insulin concentrations (p=0.020) as hypoxic severity increased. Hypoxic 33
exposure reduces hunger and energy intake, which may be mediated by decreased circulating 34
concentrations of acylated ghrelin and elevated insulin concentrations. PROSPERO 35
registration number: CRD42015017231. 36
37
3 Introduction
39
Chronic exposure to hypoxia is associated with a decrease in body mass (Pulfrey & Jones, 40
1996; Rose et al., 1988; Sergi et al., 2010; Zaccagni et al., 2014), with as much as 67% of body 41
mass losses coming from reductions in fat-free mass (Rose et al., 1988). Such losses of lean 42
mass at altitude are likely to have deleterious consequences for altitude sojourners by impairing 43
physical capabilities (Sergi et al., 2010) and suppressing immune function (Mazzeo, 2005). 44
These changes in body mass and composition appear to be the result of a chronic negative 45
energy balance due to reductions in appetite and ad-libitum energy intake (Aeberli et al., 2013; 46
Matu et al., 2017a; Wasse et al., 2012), in combination with potential increases in resting 47
energy expenditure (Butterfield et al., 1992; Matu et al., 2017a), compared with sea level. 48
Developing a better understanding of the changes in appetite and energy intake that occur 49
during hypoxic exposure is vital in designing interventions to minimise energy deficits. 50
Despite a substantial amount of recent research (Debevec, 2017), the mechanisms 51
underlying reductions in appetite during hypoxic exposure are not well understood. 52
Historically, studies have attributed the loss of appetite to acute mountain sickness (AMS), 53
however this is unlikely to be the sole cause, as symptoms of anorexia persist when AMS has 54
subsided (Tschop & Morrison, 2001), and others have found appetite suppression in individuals 55
without symptoms of AMS (Matu et al., 2017a). Appetite is regulated, in part, by the 56
neuroendocrine system (Murphy & Bloom, 2006), and multiple hormones have been 57
implicated as mediators of hunger and satiety in hypoxia (Bailey et al., 2015; Debevec et al., 58
2014a; Debevec et al., 2016; Matu et al., 2017a; Sierra-Johnson et al., 2008; Shulka et al., 2005; 59
Tschop et al., 1998). Acylated ghrelin has been hypothesized to act physiologically to signal 60
hunger and initiate eating, and has received growing attention in hypoxic research during recent 61
years (Bailey et al., 2015; Matu et al., 2017a; Morishima & Goto, 2016; Wasse et al., 2012). 62
Current evidence suggests that appetite and acylated ghrelin are concomitantly suppressed 63
during exposure to high, but not moderate, simulated altitude, which suggests a potential 64
mediating role of this hormone in altitude-induced anorexia (Matu et al., 2017a). However, due 65
to the complex chemical preparation required for accurate acylated ghrelin measurements 66
(Hosoda et al., 2004), total ghrelin concentrations have been more commonly measured in 67
response to hypoxic exposure and the findings remain equivocal (Benso et al., 2007; Debevec 68
et al., 2014a; Debevec et al., 2016; Mekjavic et al., 2016; Riedl et al., 2012; Riepl et al., 2012; 69
4
The role of circulating leptin concentrations as a mediator of appetite and energy intake 71
changes at altitude has been a topic of great interest and controversy. Leptin is an adipocytokine 72
that has been proposed to expresses regulatory physiological effects on appetite and 73
metabolism (Klok et al., 2007). It is well known that exposure to altitude stimulates hypoxia-74
inducible factor 1 (HIF-1) (Semenza, 2012). HIF-1 can transactivate the human leptin gene 75
promoter, potentially increasing circulating leptin concentrations (Grosfeld et al., 2002). On 76
the contrary, altitude exposure is often associated with a significant loss of adiposity due to 77
increased energy expenditure and/or decreased energy intake (Rose et al., 1988; Zaccagni et 78
al., 2014). This would therefore reduce leptin expression in adipose tissue. Consequently, the 79
effects of hypoxic exposure on leptin concentrations remain ambiguous (Sierra-Johnson et al., 80
2008), and several confounding factors may regulate leptin concentrations in hypoxia, such as 81
the completion of varying amounts of physical activity (Yu et al., 2017), as well as the duration 82
and severity of hypoxic exposure. Other hormones which have been investigated in relation to 83
appetite suppression during hypoxic exposure include glucagon-like peptide-1 (GLP-1) (Bailey 84
et al., 2004; Bailey et al., 2015; Debevec et al., 2014a; Debevec et al., 2016; Matu et al., 2017a; 85
Mekjavic et al., 2016; Morishima & Goto, 2016; Snyder et al., 2008), pancreatic polypeptide 86
(PP) (Matu et al., 2017a; Riepl et al., 2012), peptide YY (PYY) (Bailey et al., 2015; Debevec 87
et al., 2014a; Debevec et al., 2016; Mekjavic et al., 2016; Wasse et al., 2012), cholecystokinin 88
(CCK) (Aeberli et al., 2013; Riepl et al., 2012) and insulin (Debevec et al., 2014a; Matu et al., 89
2017a; Mekjavic et al., 2016). The results of these studies are equivocal, possibly due to a wide 90
variety of methodologies employed. 91
A clear understanding of the dose-response and underlying regulation of hypoxia-92
induced appetite suppression in humans requires the equivocal results of previous studies to be 93
explained. In an attempt to resolve these discrepancies, our objective was to conduct a 94
systematic review and meta-analysis of within-measures studies which have investigated the 95
effect of hypoxia on hunger, energy intake and/or hormone concentrations implicated in 96
appetite regulation. Using post-hoc subgroup analyses and meta-regression, we also aimed to 97
identify any study characteristics which could help to explain the observed results. 98
99
Methods
100
This systematic review and meta-analysis was performed in accordance with the PRISMA 101
5
al., 2009) and was prospectively registered with the PROSPERO database 103
(CRD42015017231). 104
105
Literature Search 106
PubMed and The Cochrane Library as well as MEDLINE, SPORTDiscus, PsycINFO and 107
CINAHL, via EBSCOhost, were searched from 3rd March 2015 through 1st April 2017. 108
Keyword searchers were performed for: ‘altitude’, ‘hypoxia’, ‘hypoxic’, ‘mountaineering’, 109
‘appetite’, ‘appetite hormones’, ‘ghrelin’, ‘acylated ghrelin’, ‘glp-1’, ‘glucagon like peptide-110
1’, ‘peptide YY’, ‘PYY’, ‘leptin’, ‘pancreatic polypeptide’, ‘insulin’, ‘hunger’, ‘satiety’, 111
‘energy intake’, ‘food intake’, ‘energy balance’ (details of the search strategy are outlined in 112
the Supplementary Material). This gave a total of 68 combinations. Reference lists of eligible 113
studies and review articles were also searched. If only the abstract or partial data were published 114
then the author was contacted for the full data set. No language or date of publication 115
restrictions were applied during the searches. 116
117
Inclusion Criteria 118
For inclusion, studies were required to meet the following criteria: participants in the studies 119
were between 18 and 65 years old, non-smokers, not pregnant and had no history of diabetes, 120
gastrointestinal, inflammatory, metabolic, cardiovascular, neurological or psychological 121
disease(s). Studies were included if they were published in peer-review journals or were 122
available as published conference proceedings, theses or dissertations, to minimise the effect 123
of any potential publication bias. 124
All studies were required to contain at least one of the following measures: subjective 125
hunger perceptions measured via visual analogue scales; measurements of blood acylated 126
ghrelin, total ghrelin, leptin, GLP-1, PYY and/or insulin concentrations; and/or energy intake 127
measured by the researcher as the weight of food or kJ/kcal (i.e. not self-reported). Hunger was 128
used as opposed to other subjective appetite measures, as hunger is the most commonly utilised 129
scale and therefore allowed for the inclusion of more studies. 130
All studies were required to contain the required measure(s) during a hypoxic exposure. 131
6
a true altitude via geographical location (e.g. mountaineering) or a simulated normobaric or 133
hypobaric exposure (e.g. hypoxic chamber, hypoxic tent or breathing mask). Exposures were 134
required to be ≥1000m in altitude (or a simulated hypoxic equivalent) and be of ≥ 30 minutes 135
in duration. Studies were also required to contain an appropriate within-subjects control, i.e. 136
the equivalent measure(s) in normoxic conditions prior to the hypoxic exposure or a separate 137
control (normoxic) condition. 138
Two researchers (JM and KD) independently assessed studies for inclusion and later 139
compared notes to reach a mutual consensus. Disagreements about the eligibility of any 140
particular studies were resolved by a third reviewer (TI). Potential studies that could be 141
included based on their title or abstract were retrieved in full-text and reviewed against the 142
inclusion/exclusion criteria independently by two researchers (JM and KD) with a third 143
researcher (TI) used to settle any disputes. In total, 28 studies met the inclusion criteria and 144
were included in this meta-analysis (supplementary figure 1). For a variable to be included in 145
the meta-analysis a minimum of three studies, measuring the respective variable, were required 146
to meet the inclusion criteria. 147
148
Data abstraction 149
Data were extracted independently by two researchers (JM and KD) into a standardised 150
spreadsheet, which included (i) characteristics of articles valid for review; (ii) the Cochrane 151
Collaboration’s tool for assessing risk of bias and (iii) outcome data suitable for successive 152
analysis based on mean, SD and sample size. Additional data were collected for study design, 153
participant characteristics, severity and duration of hypoxic exposure, acclimatisation status 154
and activity status of participants. Participants were deemed to be passive if no exercise was 155
conducted during the hypoxic exposure (e.g. bedrest, or ascent to altitude by vehicle). 156
Participants were deemed to be active if exercise was conducted during the hypoxic exposure 157
(e.g. exercise capacity tests, or trekking to altitude). When studies employed multiple measures 158
of the same variable in the same hypoxic severity then the first measure and chronologically 159
final measure were used for analysis. This ensured that single studies were not weighted too 160
highly due to multiple measures whilst still accounting for the effect of acute and chronic 161
hypoxic exposure. 162
Where blood analyte values were reported in pmolL-1, values were converted to pgmL -163
7
ghrelin, and 16 for leptin.Insulin was converted from pmolL-1 to µU.mL-1.where necessary by 165
dividing by six. Where values were only presented in figure form, the figure was digitized 166
using graph digitizer software (DigitizeIt, Germany) and the means and SD/SEM were 167
measured manually at the pixel level to the scale provided on the figure. If area under the curve 168
values were reported rather than mean values, the authors of the relevant studies were contacted 169
to obtain the raw dataset and mean values were subsequently calculated. 170
171
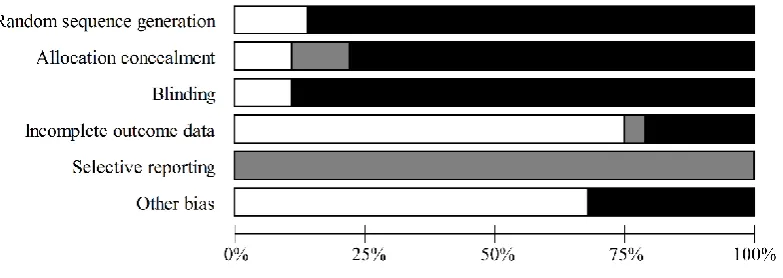
Assessment of risk of bias in included studies 172
To assess the risk of bias in included studies The Cochrane Collaboration’s tool for assessing 173
risk of bias (Higgins et al., 2011)was used independently by two reviewers (JM and LD). Each 174
study was assessed in the following six domains: sequence generation, allocation concealment, 175
blinding of participants, personnel and outcome assessors, incomplete outcome data, selective 176
outcome reporting, and other sources of bias (e.g. has been claimed to have been fraudulent). 177
A judgement was made on each of the domains by the two independent researchers as to 178
whether they were ‘high risk ‘or ‘low risk’. When insufficient detail was reported then the 179
judgement of ‘unclear risk’ was made. Disagreements were solved initially via discussion 180
between the two independent reviewers however a third reviewer (TI) was consulted for dispute 181
resolution. ‘Risk of bias graphs’ were computed in Review Manager (RevMan) 5.3 (The 182
Cochrane Collaboration) to include low, unclear and high risk for each domain. 183
184
Statistical analysis 185
Missing standard deviations were calculated from standard errors or confidence intervals. 186
Outcome measures were converted into the standardised mean difference (SMD) with 95% 187
confidence intervals (CI) and were used as the summary statistic. The SMD represents the size 188
of the effect of the intervention relative to the variability observed in that intervention. A 189
random-effects meta-analysis was performed by JM, JG and KD using Comprehensive Meta-190
Analysis Software (version 3, Biostat, Englewood, NJ, USA). A random-effects model was 191
chosen over a fixed effects model due to unexplained heterogeneity in the included studies 192
(Ades et al., 2005). The inputted data included sample sizes, outcome measures with their 193
respective standard deviations, and a correlation coefficient for within-subject measurements. 194
8
published studies, and were as follows: fasted hunger r = 0.52, postprandial hunger r = 0.61, 196
energy intake r = 0.51, postprandial acylated ghrelin r = 0.97, fasted total ghrelin r = 0.40, 197
postprandial total ghrelin r = 0.53, fasted leptin r = 0.32, fasted GLP-1 r = 0.94, postprandial 198
GLP-1 r = 0.95, fasted PYY r = 0.70, postprandial PYY r = 0.86, fasted insulin r = 0.43 and 199
postprandial insulin r = 0.53. 200
We interpreted SMD values of <0.20 as trivial, 0.20-0.39 as small, 0.40-0.80 as 201
moderate and >0.80 as large (Cohen, 1969). A negative SMD indicates that hypoxic exposure 202
was associated with a decrease in the respective outcome variable while a positive SMD 203
indicates that hypoxic exposure was associated with an increase in the respective outcome 204
variable. Heterogeneity between trials was assessed using the I-squared statistic, where 0-40% 205
suggests heterogeneity might not be important, 30-60% may represent moderate heterogeneity, 206
50-90% may represent substantial heterogeneity and 75-100% represents substantial 207
heterogeneity (Higgins & Thompson, 2002). This measure of heterogeneity was complimented 208
by also reporting the Tau-squared statistic and the Chi-squared statistic. To examine whether 209
any conclusions were dependent on a single study, sensitivity analyses was employed for each 210
variable by repeating the analyses with each study omitted in turn. 211
Where significant effects of hypoxic exposure were observed, post-hoc meta-regression 212
analysis (method-of-moments model) was performed. This analysis was used to determine 213
whether continuous data, including duration or severity of hypoxic exposure, could explain the 214
variation in the SMD values observed between studies for a respective outcome measure. 215
Where data were available, subgroup meta-analysis was performed for categorical variables 216
including acclimatisation status, method of achieving hypoxic exposure and physical activity 217
status. 218
219
Exploration of small study effects 220
Small study effects were explored with funnel plots of standard difference in means versus 221
standard errors (Sterne et al., 2011) and by quantifying Egger’s linear regression intercept. A 222
large and statistically significant Egger statistic indicates the presence of a small study effect. 223
224
Results
9
Overview 226
Supplementary figure 1 outlines the flowchart of study selection. In total, 28 studies met the 227
inclusion criteria for the meta-analysis. All included studies had been published (or accepted 228
for publication) in peer-reviewed scientific journals at the time of inclusion. Within the 28 229
included studies a total of 54 fasted and 22 postprandial comparisons were included between 230
normoxic and hypoxic conditions. Comparisons were segregated into fasted (see 231
supplementary table 1) and postprandial (see supplementary table 2) responses to differentiate 232
between findings during these two distinct periods of appetite regulation. Fasted comparisons 233
represent comparisons of single time points obtained after an overnight fast. Eleven out of the 234
12 studies which reported postprandial comparisons provided standardised meals to 235
participants with an energy content of 1347 - 3205 kJ (mean: 2128 kJ) and an observation 236
period of 50 – 420 minutes (mean: 210 minutes). The remaining study which assessed 237
postprandial comparisons measured hunger responses to ad libitum feeding during the waking 238
hours of an entire day (Westerterp-Platenga et al., 1999). All studies involving postprandial 239
comparisons provided mixed macronutrient meals, with seven studies providing this in the 240
form of solid foods and five studies providing this in a liquid form. Visual inspection of the 241
data suggests that the composition of meals provided and observation periods employed did 242
not dictate the outcomes of postprandial variables. 243
244
Participant demographics and hypoxic exposure characteristics 245
A total of 407 participants (351 men and 56 women; 86% men) were included in this meta-246
analysis. Mean age was reported in 22 out of the 28 studies and ranged from 21 to 44 years 247
(mean: 29 years). Mean BMI was reported in 18 out of the 28 studies and ranged from 20.7 to 248
25.0 kg·m-2 (mean: 23.4 kg·m-2). For all comparisons hypoxic severity ranged from 2134 to 249
7753m (mean: 4302m) and duration of hypoxic exposure ranged from 50 minutes to two 250
months (mean: 10 days). 251
252
Meta-Analysis 253
Individual study statistics and results for each outcome variable are summarised in 254
10
256
Standardised mean difference and moderator variables for hunger scores 257
Hypoxic exposure resulted in a small decrease in fasted hunger scores (SMD: 0.35, 95% CI: -258
0.76 to 0.07; n = 15; p = 0.102). The degree of heterogeneity may be substantial between these 259
studies (I2 = 81.6%; Q = 76.0, τ2 = 0.521, df = 14). Sensitivity analysis revealed that the removal 260
of one comparison (Aeberli et al. 2013-2) further decreased the SMD to -0.43 (95% CI: -0.85 261
to -0.01; p = 0.045). Inspection of the funnel plot and Egger’s regression intercept revealed that 262
there was evidence of small study effects (intercept = -5.522, 95% CI: -9.25 to -1.79; p = 0.007). 263
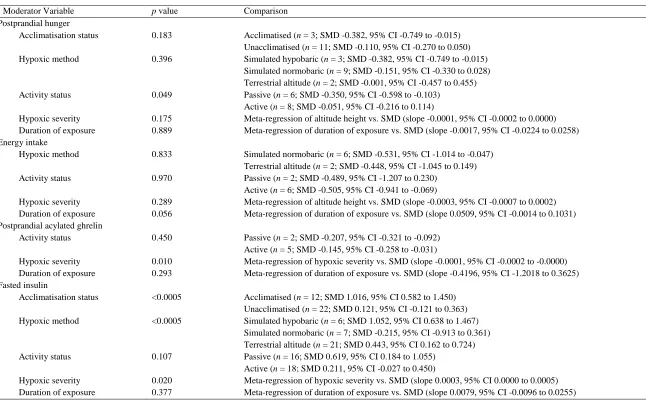
Hypoxic exposure resulted in a trivial decrease in postprandial hunger scores (SMD: -264
0.15, 95% CI: -0.29 to -0.01; n = 14; p = 0.043; Figure 1). The degree of heterogeneity was 265
found to be low between these studies (I2 = 5.2%; Q = 13.7, τ2 = 0.004 and df = 13). Sensitivity 266
analysis revealed that the removal of eight single comparisons in turn moderated the statistical 267
interpretation of the results; for example the removal of the comparison with the largest 268
negative SMD (Wasse et al., 2012) would increase the SMD to -0.11 (95% CI: -0.25 to 0.03; 269
p = 0.118). Subgroup analysis indicated a difference between active and passive participants 270
(p = 0.049), with postprandial hunger being suppressed to a greater extent in passive 271
participants (Table 1). Utilising a meta-regression model, neither hypoxic severity nor duration 272
of exposure were associated with postprandial hunger scores. Inspection of the funnel plot and 273
Egger’s regression intercept revealed that there was evidence of small study effects (intercept 274
= -3.332, 95% CI: -6.06 to -0.60; p = 0.021). 275
[Insert Figure 1 near here] 276
277
Standardised mean difference and moderator variables for energy intake 278
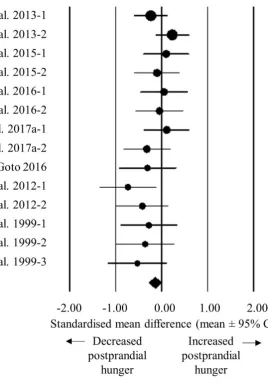
Hypoxic exposure resulted in a moderate decrease in energy intake (SMD: 0.50, 95% CI: -279
0.85 to -0.15; n = 8; p = 0.006; Figure 2). The degree of heterogeneity may be substantial 280
between these studies (I2 = 64.5%; Q = 19.7, τ2 = 0.159 and d
f = 7). Sensitivity analysis revealed 281
minor changes only, and these changes did not substantially alter the overall mean effect. Using 282
duration of exposure as a moderator in a meta-regression model, a shorter duration of exposure 283
tended to be associated with a larger decrease in energy intake. The slope of the regression 284
tended to be positive (p = 0.056; Table 1), with a standardised increase in energy intake of 285
11
regression intercept revealed that there was little evidence of small study effects (intercept = -287
4.065, 95% CI: -10.04 to 1.91; p = 0.147). 288
[Insert Figure 2 near here] 289
290
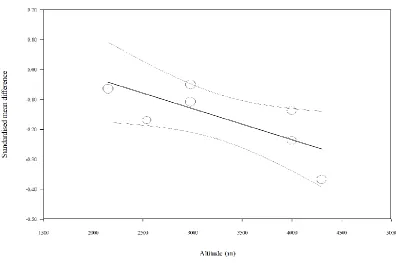
Standardised mean difference and moderator variables for acylated ghrelin concentrations 291
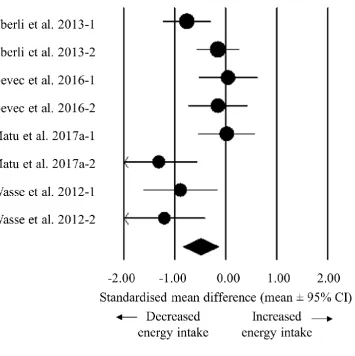
Hypoxic exposure resulted in a trivial decrease in postprandial acylated ghrelin concentrations 292
(SMD: -0.16, 95% CI: -0.25 to -0.08; n = 7; P < 0.0005; Figure 3). The degree of heterogeneity 293
was found to be moderate between these studies (I2 = 56.7%; Q = 13.9, τ2 = 0.007 and d f = 6). 294
Sensitivity analysis revealed minor changes only, and these changes did not substantially 295
impact the overall mean effect. Using hypoxic severity as a moderator in a meta-regression 296
model, a higher degree of hypoxia was associated with a larger decrease in acylated ghrelin 297
concentrations (Figure 4). The slope of the regression was negative (slope: 0.0001, 95% CI -298
0.0002 to -0.0000; p = 0.010; Table 1), with a standardised decrease in acylated ghrelin of 0.1 299
units for every 1000m increase in hypoxic severity. Inspection of the funnel plot and Egger’s 300
regression intercept revealed that there was little evidence of small study effects (intercept = -301
5.431, 95% CI: -21.82 to 10.96; p = 0.467). 302
[Insert Figure 3 and 4 near here] 303
304
Standardised mean difference and moderator variables for total ghrelin concentrations 305
Hypoxic exposure resulted in trivial changes in fasted (SMD: 0.00, 95% CI: -0.33 to 0.34; n = 306
14; p = 0.987) and postprandial (SMD: 0.02, 95% CI: -0.37 to 0.41; n = 5; p = 0.920) total 307
ghrelin concentrations. The degree of heterogeneity may be substantial for fasted comparisons 308
(I2 = 74.7%; Q = 51.3, τ2 = 0.284 and df = 13) and low for postprandial comparisons (I2 = 309
33.4%; Q = 6.0, τ2 = 0.064 and d
f = 4). Sensitivity analysis revealed only minor changes in the 310
SMDs for both fasted and postprandial total ghrelin concentrations. Inspection of the funnel 311
plot and Egger’s regression intercept revealed that there was little evidence of small study 312
effects for both fasted (1.104, 95% CI: -2.82 to 5.03; p = 0.552) and postprandial (-3.503, 95% 313
CI: -10.62 to 3.61; p = 0.215) total ghrelin concentrations. 314
315
12
Hypoxic exposure resulted in a trivial increase in fasted (SMD: 0.03, 95% CI: -0.11 to 0.17; n 317
= 8; p = 0.684) and postprandial (SMD: 0.03, 95% CI: -0.05 to 0.11; n = 10; p = 0.474) GLP-318
1 concentrations. The degree of heterogeneity may be substantial for fasted comparisons (I2 = 319
62.1%; Q = 18.5, τ2 = 0.024 and d
f = 7) and was moderate for postprandial comparisons (I2 = 320
39.2%; Q = 14.8, τ2 = 0.006 and d
f = 9). Sensitivity analysis revealed only minor changes in 321
the SMDs for both fasted and postprandial GLP-1 concentrations. Inspection of the funnel plot 322
and Egger’s regression intercept revealed that there was little evidence of small study effects 323
for both fasted (intercept = 5.819, 95% CI: -4.71 to 16.35; p = 0.225) and postprandial (intercept 324
= 4.524, 95% CI: -3.73 to 12.78; p = 0.242) GLP-1 concentrations. 325
326
Standardised mean difference and moderator variables for leptin concentrations 327
Hypoxic exposure resulted in a trivial decrease in fasted leptin concentrations (SMD: -0.09, 328
95% CI: -0.40 to 0.23; n = 25; p = 0.588). The degree of heterogeneity was found to be 329
substantial between these studies (studies (I2 = 82.8%; Q = 139.8, τ2 = 0.493 and df = 24). 330
Sensitivity analysis revealed minor changes only, and these changes did not impact the overall 331
mean effect. Inspection of the funnel plot and Egger’s regression intercept revealed that there 332
was little evidence of small study effects (intercept = 0.953, 95% CI: -1.97 to 3.87; p = 0.506). 333
334
Standardised mean difference and moderator variables for PYY concentrations 335
Hypoxic exposure resulted in a trivial increase in fasted (SMD: 0.02, 95% CI: -0.18 to 0.21; n 336
= 7; p = 0.865) and postprandial (SMD: 0.02, 95% CI: -0.14 to 0.18; n = 8; p = 0.810) PYY 337
concentrations. The degree of heterogeneity was low for fasted comparisons (I2 = 0.0%; Q = 338
3.2, τ2 = 0.000 and d
f = 6) and moderate for postprandial comparisons (I2 = 44.2%; Q = 12.6, 339
τ2 = 0.023 and d
f = 7). Sensitivity analysis revealed only minor changes in the SMDs for both 340
fasted and postprandial PYY concentrations. Inspection of the funnel plot and Egger’s 341
regression intercept revealed that there was some evidence of small study effects for fasted 342
PYY concentrations (-9.938, 95% CI: -7.87 to 0.00; p = 0.050) but little evidence for 343
postprandial PYY concentrations (-2.485, 95% CI: -14.86 to 9.89; p = 0.641). 344
345
13
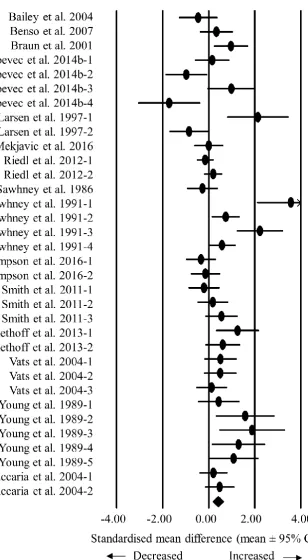
Hypoxic exposure resulted in a moderate increase in fasted insulin concentrations (SMD: 0.41, 347
95% CI: 0.17 to 0.65; n = 34; p = 0.001; Figure 4). The degree of heterogeneity may be 348
substantial between these studies (I2 = 70.6%; Q = 112.1, τ2 = 0.323, df = 33). Sensitivity 349
analysis revealed minor changes only, and these changes did not impact the overall mean effect. 350
Subgroup analysis indicated a difference between the acclimatisation status of the participants 351
(p < 0.0005), with acclimatised individuals experiencing a larger increase in insulin 352
concentrations. Additionally, there was a difference between the methods of achieving hypoxia 353
(p < 0.0005), with simulated hypobaric hypoxia inducing the largest increases in insulin 354
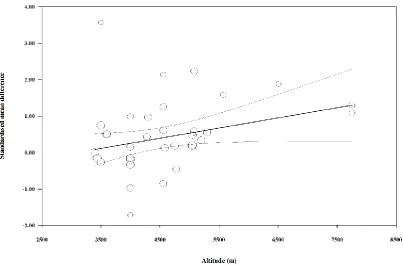
concentrations (Table 1). Using hypoxic severity as a moderator in a meta-regression model, a 355
higher degree of hypoxia was associated with a greater increase in insulin concentration (Figure 356
6). The slope of the regression was positive (slope: 0.0003, 95% CI 0.0000 to 0.0005; p = 357
0.020; Table 1), with a standardised increase in insulin of 0.3 units for every 1000m increase 358
in hypoxic severity. Inspection of the funnel plot and Egger’s regression intercept revealed that 359
there was evidence of small study effects (intercept = 2.617, 95% CI: 0.78 to 4.46; p = 0.007). 360
Hypoxic exposure resulted in a small decrease in postprandial insulin concentrations 361
(SMD: -0.035, 95% CI: -0.22 to 0.15; n = 11; p = 0.707). The degree of heterogeneity was 362
found to be low between these studies (I2 0.00%; Q = 9.5, τ2 0.00 and df = 10). Sensitivity 363
analysis revealed minor changes only, and these changes did not impact the overall mean effect. 364
Inspection of the funnel plot and Egger’s regression intercept revealed that there was evidence 365
of small study effects (intercept = -5.36, 95% CI: -9.03 to -1.69; p = 0.009). 366
[Insert Figure 5 and 6 near here] 367
[Insert Table 1 near here] 368
369
Risk of bias 370
Since many of the studies included were high altitude expeditions, certain biases were often 371
unavoidable, such as blinding of participants and personnel (Figure 7). 372
[Insert Figure 7 near here] 373
374
Discussion
14
The purpose of this meta-analysis was to examine the effect of hypoxic exposure on hunger 376
and energy intake responses, and to investigate changes in appetite-related hormones as 377
potential mechanistic variables. We observed decreases in postprandial hunger scores and 378
energy intake during hypoxic exposure compared with normoxia. Furthermore, we found 379
postprandial acylated ghrelin concentrations to be suppressed and fasted insulin concentrations 380
to be elevated during hypoxic exposure compared with normoxia. The observed reductions in 381
postprandial hunger and energy intake accord with the hypothesised orexigenic effects of 382
acylated ghrelin (Monteiro & Batterham, 2017) and anorexigenic effects of insulin (Air et al., 383
2002; Hallschmid et al., 2012). We did not find any significant effects of hypoxic exposure, 384
compared with normoxia, on circulating total ghrelin, GLP-1, leptin or PYY concentrations, 385
which suggests that these hormones are unlikely to play a role in altitude-induced anorexia. 386
Interestingly, the reductions observed in postprandial hunger during hypoxia compared 387
with normoxia do not appear to be moderated by the duration of hypoxic exposure. This 388
speculation aligns with previous research that has observed significant reductions in appetite 389
with both acute (Matu et al., 2017a; Wasse et al., 2012) and chronic (Westerterp et al., 1994; 390
Westerterp-Platenga et al., 1999) hypoxic exposures. However, reductions in energy intake 391
tended to be associated with a shorter duration of hypoxic exposure, signifying a possible 392
acclimatisation response during prolonged exposures. No other variables were found to be 393
moderated by the duration of hypoxic exposure, therefore suggesting that other factors may be 394
involved in the regulation of energy intake at altitude. Surprisingly, subgroup analysis revealed 395
that hypoxic exposure was associated with a smaller reduction in postprandial hunger in the 396
studies involving the completion of physical activity than those involving passive exposure to 397
hypoxia. This finding may seem unexpected considering the longstanding evidence that 398
strenuous exercise (≥60% of maximum oxygen uptake) induces a transient suppression of 399
appetite known as exercise-induced anorexia (Deighton & Stensel, 2014). Although it is 400
difficult to provide a precise explanation for this observation, it seems feasible that any 401
exercise-induced appetite suppression during normoxic trials may have reduced the relative 402
decrease in hunger during matched hypoxic trials due to a baseline effect. It must also be 403
acknowledged that subgroup and meta-regression analyses are observational, in contrast to the 404
main analysis and summary effect which represent the impact of the hypoxic interventions. 405
Subsequently, it is feasible that the moderating effect of activity status on postprandial hunger 406
is confounded by other factors within the study designs such as the participant characteristics 407
15
It must be noted that appetite perceptions and hormonal regulation are just two aspects 409
of a multifaceted system controlling energy intake in humans. Hypoxia has been shown to 410
degrade the taste of food in both humans (Matu et al., 2017b)and rodents (Ettinger & Staddon, 411
1982), and this could potentially alter food reward (Berthoud, 2006). Furthermore, individuals 412
exposed to chronic altitude may consciously attempt to maintain energy balance to avoid illness 413
and fatigue (Matu et al., 2017b). This behavioural regulation of energy intake may confound 414
the observed reductions in energy intake during chronic hypoxic exposure. It is also possible 415
that the initial body composition and fitness levels of the participants included in the current 416
review may alter their hormonal responses to altitude. For example, an increased adiposity can 417
lead to a decrease in insulin and leptin sensitivity (Adam et al., 2009). However, not enough 418
studies reported these data for them to be included as moderator variables. 419
The current review found an inverse association between hypoxic severity and changes 420
in acylated ghrelin concentrations. This finding concords with those of Matu et al. (2017a), 421
who found that acylated ghrelin was suppressed with high but not moderate simulated altitude 422
exposure. The findings of this meta-analysis demonstrate that acylated ghrelin is suppressed in 423
hypoxia compared with normoxia but that total ghrelin concentrations remain unchanged. Total 424
ghrelin consists of the combined levels of des-acyl ghrelin and acylated ghrelin, and recent 425
research has found that des-acyl ghrelin can inhibit the orexigenic effects of acylated ghrelin 426
by targeting the arcuate nucleus, independently of the growth hormone secretagogue receptor 427
(Fernandez et al., 2016). The opposing effects of these hormones suggest that physiologically 428
relevant changes in ghrelin constituents may be masked by the measurement of total ghrelin. It 429
would therefore be beneficial for further research in this area to differentiate between the 430
ghrelin constituents. 431
Fasting insulin concentrations were found to be elevated with hypoxic exposure 432
compared with normoxia, and this effect was positively associated with the severity of 433
hypoxia. Additionally, a larger effect was observed in acclimatised participants than in 434
unacclimatised participants. However, this observation may be confounded by the fact that 435
studies that tend to recruit acclimatised participants often use higher altitudes. These higher 436
altitudes may be the factor causing the larger increase in insulin concentrations, which is 437
supported by the meta-regression between hypoxic severity and changes in insulin 438
concentrations. Such increases in insulin concentration may contribute to the observed 439
reductions in hunger during hypoxic exposure but could also represent a reduction in insulin 440
16
hepatic insulin sensitivity is more heavily influenced by hypoxia then peripheral insulin 442
sensitivity (Matsuda & DeFronzo, 1999; Radziuk, 2014). Hypoxia has been shown to induce 443
whole-body insulin resistance in mice (Murphy et al., 2017). Furthermore, the use of a 444
hyperinsulinaemic, euglycaemic clamp in humans has demonstrated that an acute 30-min 445
hypoxic exposure (resulting in a blood oxygen saturation of ~75%) rapidly reduces whole-446
body insulin sensitivity by ~15% (Oltmanns et al., 2004). The reduction in insulin sensitivity 447
could be due to catecholamine responses, adipose tissue inflammation, and/or HIF signalling 448
(Murphy et al., 2017; Oltmanns et al., 2004). This reduction in insulin sensitivity may be 449
transient, as others have shown that following an acute hypoxic exposure, insulin sensitivity 450
under normoxia is increased compared to continuous normoxia. Therefore, hypoxia may 451
acutely reduce insulin sensitivity, with a subsequent “rebound” upon return to normoxia. 452
Further work is required to establish whether chronic, sustained hypoxia reduces hepatic 453
and/or peripheral insulin sensitivity. 454
Interestingly, subgroup analysis revealed a larger increase in fasted insulin 455
concentrations under conditions of simulated hypobaric hypoxia than terrestrial altitude or 456
simulated normobaric hypoxia. Although further research is required, some evidence suggests 457
that simulated hypobaric hypoxia induces greater physiological stress than simulated 458
normobaric hypoxia (Coppel et al., 2015), which may contribute to the larger increases in 459
fasted insulin levels under this condition. It also seems feasible that simulated hypobaric 460
hypoxia may be a more potent physiological stressor than terrestrial altitude due to the 461
immediacy of the hypoxic exposure (i.e., walking through the door of an environmental 462
chamber rather than ascending more gradually to terrestrial altitude by transport or trekking). 463
Despite these potential effects, other differences between the studies assessing fasted insulin 464
concentrations may also have contributed to this observation, including the severity of 465
hypoxia induced in the different experiments. 466
The findings of the current review provide support for the notion that leptin 467
concentrations are not consistently affected by hypoxic exposure. From the studies included in 468
this review it appears that shorter duration studies utilising simulated altitudes result in 469
elevations of leptin concentrations compared with normoxia (Mekjavic et al., 2016; Snyder et 470
al., 2008), whereas longer duration studies at terrestrial altitude result in reductions in leptin 471
levels compared with normoxia (Benso et al., 2007; Castell et al., 2010; Vats et al., 2004). 472
These observations concur with the hypothesis that hypoxia stimulates HIF-1, which can 473
17
concentrations by reducing adiposity. This explains the lack of an overall effect in the current 475
meta-analysis. Due to multiple confounding factors in the included studies, which were not 476
possible to account for in the current analysis (e.g. sleep, cold, smoking status), further well 477
designed research would be beneficial to elucidate the effects of hypoxia per se on circulating 478
leptin concentrations in humans. 479
In the current review the only hormones investigated which aligned with the observed 480
reductions in hunger and energy intake were acylated ghrelin and insulin. Each of the other 481
appetite-related hormones were not found to change significantly in hypoxia compared with 482
normoxia. One recent study found that a high fat breakfast directly increased postprandial 483
acylated ghrelin and reduced postprandial insulin concentrations at simulated altitude, 484
compared with a high carbohydrate breakfast (Matu et al., 2017c). These alterations in hormone 485
concentrations were associated with increased appetite perceptions during an exercise bout that 486
simulated trekking activity. This research supports the conclusions of this review, and suggests 487
that it may be beneficial for further future studies to focus on interventions to minimise altitude-488
induced changes in acylated ghrelin and insulin concentrations in an attempt to augment energy 489
intake, particularly during prolonged periods of hypoxic exposure. 490
Some notable limitations must be acknowledged in this meta-analysis. First, the 491
postprandial comparisons included within this review included a range of feeding protocols 492
and observation durations. Although these factors did not appear to have any noticeable effect 493
on the direction of the overall findings, it is possible that these factors may have influenced the 494
findings of each individual study. For example, the studies that provided meals containing 495
higher energy content or in the form of solid food would be expected to induce greater 496
reductions in hunger than lower energy or liquid meals (Tieken et al., 2007). It remains unclear 497
whether this would alter the effects of hypoxic exposure on the variables measured in this 498
review when compared with a matched normoxic trial, but this remains an important 499
consideration and an avenue for future investigation. Second, the hormones PP and CCK are 500
proposed to exert anorexigenic effects but these hormones were not included in this meta-501
analysis as only two studies met the inclusion criteria for each hormone. These studies both 502
reported that hypoxic exposure suppressed concentrations of PP (Matu et al., 2017a; Riepl et 503
al., 2012) and CCK (Aeberli et al., 2013; Riepl et al., 2012) in the fasted and postprandial states, 504
suggesting that neither hormone plays a role in altitude-induced anorexia, as suppression of 505
these hormones would be expected to increase hunger. Third, we decided to exclude self-506
18
measured by the research team. In total 27 studies were excluded for this reason, and thus it 508
may be argued that conclusions from this meta-analysis may be biased. However, this decision 509
was made a-priori due to the various limitations associated with self-report methods (Hill & 510
Davies, 2001) and recent conclusions that self-reported energy intake should not be used as a 511
measure of energy intake in scientific research (Dhurandhar et al., 2016; Subar et al., 2015). 512
Fourth, the statistical power of the analysis must be considered when interpreting the results, 513
particularly with regard to the subgroup analysis. As few as two comparisons were included in 514
some subgroups for analysis, and therefore may be underpowered. Fifth, as shown in Figure 7, 515
many of the included studies were classified as high risk for random sequence generation, 516
allocation concealment and blinding. However, it is important to note this this appraisal does 517
not necessarily mean the studies were methodologically flawed as these factors are often not 518
possible to incorporate during high altitude trekking studies. Finally, despite an extensive 519
search returning 2834 records, we cannot guarantee that our search was completely exhaustive 520
of the relevant literature. However, having searched the reference lists of all included studies 521
we are confident to have included all available relevant studies. 522
In conclusion, this meta-analysis reveals that exposure to hypoxia decreases hunger and 523
energy intake compared with normoxia, and that these reductions are associated with depressed 524
acylated ghrelin concentrations and elevated insulin concentrations. Given the hypothesised 525
roles of these hormones in the control of appetite, these changes are plausible neuroendocrine 526
signals mediating altitude-induced anorexia. It may be beneficial for future research to 527
investigate interventions that increase acylated ghrelin concentrations and decrease insulin 528
concentrations at altitude, with the aims of maintaining insulin sensitivity, and increasing 529
appetite and energy intake to assist with the maintenance of energy balance. 530
531
Financial Support
532
This research received no specific grant from any funding agency, commercial or not-for-profit 533
sectors. 534
535
Conflict of Interest
536
19 References
Adam TC, Toledo-Corral C, Lane CJ et al. (2009) Insulin sensitivity as an independent predictor of fat mass gain in Hispanic adolescents. Diabetes care 32, 2114-2115.
*Aeberli I, Erb A, Spliethoff K et al. (2013) Disturbed eating at high altitude: influence of food preferences, acute mountain sickness and satiation hormones. Eur J Nut 52, 625-635.
Air EL, Benoit SC, Blake Smith KA et al. (2002) Acute third ventricular administration of insulin decreases food intake in two paradigms. Pharmacol Biochem Behav 72, 423-429.
Ades AE, Lu G, Higgins JP (2005) The interpretation of random-effects meta-analysis in decision models. Med Decis Mak 25, 646-654.
*Bailey DM, Ainslie PN, Jackson SK et al. (2004) Evidence against redox regulation of energy homoeostasis in humans at high altitude. Clin Sci 107, 589-600.
*Bailey DP, Smith LR, Chrismas BC et al. (2015) Appetite and gut hormone responses to moderate-intensity continuous exercise versus high-intensity interval exercise, in normoxic and hypoxic conditions. Appetite 89, 237-245.
*Benso A, Broglio F, Aimaretti G et al. (2007) Endocrine and metabolic responses to extreme altitude and physical exercise in climbers. Eur J Endocrinol 157, 733-740.
Berthoud HR (2006) Homeostatic and non-homeostatic pathways involved in the control of food intake and energy balance. Obesity 14, 197-200.
*Braun B, Rock PB, Zamudio S et al. (2001) Women at altitude: short-term exposure to hypoxia and/or alpha(1)-adrenergic blockade reduces insulin sensitivity. J Appl Phsiol 91, 623-631.
Butterfield GE, Gates J, Fleming S et al. (1992) Increased energy intake minimizes weight loss in men at high altitude. J Appl Physiol 72, 1741-1748.
*Castell LM, Thake CD, Ensign W (2010) Biochemical markers of possible
immunodepression in military training in harsh environments. Mil Med 175, 158-165.
Cohen J (1969) Statistical power analysis for the behavioural sciences. Hillsdale (NJ): Lawrence Erlbaum Associates.
Coppel J, Hennis P, Gilbert-Kawai E, Grocott MPW (2015) The physiological effects of hypobaric hypoxia versus normobaric hypoxia: a systematic review of crossover trials. Extrem Physiol Med 4, 2.
*Debevec T, Simpson EJ, Macdonald IA et al. (2014a) Exercise training during normobaric hypoxic confinement does not alter hormonal appetite regulation. PloS one 9, e98874.
20
*Debevec T, Simpson EJ, Mekjavic IB et al. (2016) Effects of prolonged hypoxia and bed rest on appetite and appetite-related hormones. Appetite 107, 28-37.
Debevec T (2017) Hypoxia-Related Hormonal Appetite Modulation in Humans during Rest and Exercise: Mini Review. Front Physiol 8, 366.
Deighton K, Stensel DJ (2014) Creating an acute energy deficit without stimulating
compensatory increases in appetite: is there an optimal exercise protocol? Proc Nutr Soc 73, 352-358.
Dhurandhar NV, Brown AW, Thomas D et al. (2016) We Agree That Self-Reported Energy Intake Should Not Be Used as a Basis for Conclusions about Energy Intake in Scientific Research. J Nut 146, 1141-1142.
Ettinger RH, Staddon JE (1982) Decreased feeding associated with acute hypoxia in rats. Physiol Behav 29, 455-458.
Fernandez G, Cabral A, Cornejo MP et al. (2016) Des-Acyl Ghrelin Directly Targets the Arcuate Nucleus in a Ghrelin-Receptor Independent Manner and Impairs the Orexigenic Effect of Ghrelin. J Neuroendocrinol 28, 12349.
Grosfeld A, Andre J, Hauguel-De Mouzon S et al. (2002) Hypoxia-inducible factor 1 transactivates the human leptin gene promoter. J Biol Chem 277, 42953-42957.
Hallschmid M, Higgs S, Thienel M, Ott V, Lehnert H (2012) Postprandial administration of intranasal insulin intensifies satiety and reduces intake of palatable snacks in women. Diabetes 61, 782-789.
Higgins JP, Thompson SG (2002) Quantifying heterogeneity in a meta-analysis. Stat Medicine 21, 1539-1558.
Higgins JP, Altman DG, Sterne JA (2011) Chapter 8: Assessing risk of bias in included studies in Cochrane Handbook for Systematic Reviews of Interventions. vol. Version 5.1.0. Chichester, West Sussex Hoboken NJ : John Wiley & Sons, [2008] ©2008.
Hill RJ, Davies PS (2001) The validity of self-reported energy intake as determined using the doubly labelled water technique. Brit J Nut 85, 415-430.
Hosoda H, Doi K, Nagaya N et al. (2004) Optimum collection and storage conditions for ghrelin measurements: octanoyl modification of ghrelin is rapidly hydrolyzed to desacyl ghrelin in blood samples. Clin Chem 50, 1077-1080.
Klok MD, Jakobsdottir S, Drent ML (2007) The role of leptin and ghrelin in the regulation of food intake and body weight in humans: a review. Obes Rev 8, 21-34.
21
Liberati A, Altman DG, Tetzlaff J et al. (2009) The PRISMA statement for reporting systematic reviews and meta-analyses of studies that evaluate healthcare interventions: explanation and elaboration. BMJ 339.
Matsuda M, DeFronzo RA (1999) Insulin sensitivity indices obtained from oral glucose tolerance testing: comparison with the euglycemic insulin clamp. Diabetes care 22, 1462-1470.
*Matu J, Deighton K, Ispoglou T et al. (2017a) The effect of moderate versus severe simulated altitude on appetite, gut hormones, energy intake and substrate oxidation in men. Appetite 113, 284-292.
Matu J, O'Hara J, Hill N et al. (2017b) Changes in appetite, energy intake, body composition, and circulating ghrelin constituents during an incremental trekking ascent to high altitude. Eur J Appl Physiol 117, 1917–1928.
Matu J, Deighton K, Ispoglou T et al. (2017c) A high fat breakfast attenuates the suppression of appetite and acylated ghrelin during exercise at simulated altitude. Physiol Behav 179, 353-360.
Mazzeo RS (2005) Altitude, exercise and immune function. Ex Immun Rev 11, 6-16.
*Mekjavic IB, Amon M, Kölegård R et al. (2016) The effect of normobaric hypoxic confinement on metabolism, gut hormones and body composition. Front Physiol 7, 202.
Monteiro MP, Batterham RL (2017) The Importance of the Gastrointestinal Tract in
Controlling Food Intake and Regulating Energy Balance. Gastroenterology 152, 1707-1717.
*Morishima T, Goto K (2016) Ghrelin, GLP-1, and leptin responses during exposure to moderate hypoxia. Appl Physiol, Nutrition, Metab 41, 375-381.
Murphy AM, Thomas A, Crinion SJ et al. (2017) Intermittent hypoxia in obstructive sleep apnoea mediates insulin resistance through adipose tissue inflammation. Eur Respir J 49, DOI: 10.1183/13993003.01731-2016.
Murphy KG, Bloom SR (2006) Gut hormones and the regulation of energy homeostasis. Nat 444, 854-859.
Oltmanns KM, Gehring H, Rudolf S et al. (2004) Hypoxia Causes Glucose Intolerance in Humans. Am J Respir Crit Care Med 169, 1231-1237.
Pulfrey SM, Jones PJ (1996) Energy expenditure and requirement while climbing above 6,000 m. J Appl Physiol 81, 1306-1311.
Radziuk J (2014) Homeostastic model assessment and insulin sensitivity/resistance. Diabetes 63, 1850-1854.
22
*Riepl RL, Fischer R, Hautmann H et al. (2012) Influence of acute exposure to high altitude on basal and postprandial plasma levels of gastroenteropancreatic peptides. PloS one 7, e44445.
Rose MS, Houston CS, Fulco CS et al. (1988) Operation Everest. II: Nutrition and body composition. J Appl Physiol 65, 2545-2551.
*Sawhney RC, Malhotra AS, Singh T et al. (1986) Insulin secretion at high altitude in man. Int J Biometeorol 30, 231-238.
*Sawhney RC, Malhotra AS, Singh T (1991) Glucoregulatory hormones in man at high altitude. Eur J Appl Physiol Occup Physiol 62, 286-291.
Semenza GL (2012) Hypoxia-inducible factors in physiology and medicine. Cell 148, 399-408.
Sergi G, Imoscopi A, Sarti S et al. (2010) Changes in total body and limb composition and muscle strength after a 6-8 weeks sojourn at extreme altitude (5000-8000 m). J Sports Med Phys Fit 50, 450-455.
Sierra-Johnson J, Romero-Corral A, Somers VK et al. (2008) Last word on viewpoint: effect of altitude on leptin levels, does it go up or down? J Appl Physiol 105, 1691.
*Shukla V, Singh SN, Vats P et al. (2005) Ghrelin and leptin levels of sojourners and acclimatized lowlanders at high altitude. Nut Neurosci 8, 161-165.
*Simpson EJ, Debevec T, Eiken O, Mekjavic I, Macdonald IA (2016) PlanHab: the
combined and separate effects of 16 days of bed rest and normobaric hypoxic confinement on circulating lipids and indices of insulin sensitivity in healthy men. J Appl Physiol 120, 947-955.
*Smith JD, Cianflone K, Martin J et al. (2011) Plasma adipokine and hormone changes in mountaineers on ascent to 5300 meters. Wilderness Environ Med 22, 107-114.
*Snyder EM, Carr RD, Deacon CF et al. (2008) Overnight hypoxic exposure and glucagon-like peptide-1 and leptin levels in humans. Appl Physiol, Nut, Metab 33, 929-935.
*Spliethoff K, Meier D, Aeberli I et al. (2013) Reduced insulin sensitivity as a marker for acute mountain sickness? High Alt Med Biol 14, 240-250.
Sterne JAC, Egger M, Moher D (2011) Chapter 10: Addressing reporting biases in Cochrane Handbook for Systematic Reviews of Interventions. vol. Version 5.1.0. Chichester, West Sussex Hoboken NJ : John Wiley & Sons, [2008] ©2008.
23
Tieken SM, Leidy HJ, Stull AJ et al. (2007) Effects of solid versus liquid meal-replacement products of similar energy content on hunger, satiety, and appetite-regulating hormones in older adults. Horm Metab Res 39, 389-94.
Tschop M, Morrison KM (2001) Weight loss at high altitude. Adv Exp Med Biol 502, 237-247.
Tschop M, Strasburger CJ, Hartmann G et al. (1998) Raised leptin concentrations at high altitude associated with loss of appetite. Lancet 352, 1119-1120.
*Tschop M, Strasburger CJ, Topfer M et al. (2000) Influence of hypobaric hypoxia on leptin levels in men. Int J Obes Rel Metab Disord 24, 151.
*Vats P, Singh SN, Shyam R et al. (2004) Leptin may not be responsible for high altitude anorexia. High Alt Med Biol 5, 90-92.
*Wasse LK, Sunderland C, King JA et al. (2012) Influence of rest and exercise at a simulated altitude of 4,000 m on appetite, energy intake, and plasma concentrations of acylated ghrelin and peptide YY. J Appl Physiol 112, 552-559.
Westerterp KR, Kayser B, Wouters L et al. (1994) Energy balance at high altitude of 6,542 m. J Appl Physiol 77, 862-866.
*Westerterp-Plantenga MS, Westerterp KR, Rubbens M et al. (1999) Appetite at "high altitude" [Operation Everest III (Comex-'97)]: a simulated ascent of Mount Everest. J Appl Physiol 87, 391-399.
*Young PM, Rose MS, Sutton JR et al. (1989) Operation Everest II: plasma lipid and
hormonal responses during a simulated ascent of Mt. Everest. J Appl Physiol 66, 1430-1435.
Yu N, Ruan Y, Gao X et al. (2017) Systematic Review and Meta-Analysis of Randomized, Controlled Trials on the Effect of Exercise on Serum Leptin and Adiponectin in Overweight and Obese Individuals. Horm Metab Res 49, 164-173.
Zaccagni L, Barbieri D, Cogo A et al. (2014) Anthropometric and body composition changes during expeditions at high altitude. High Alt Med Biol 15, 176-182.
*Zaccaria M, Ermolao A, Bonvicini P et al. (2004) Decreased serum leptin levels during prolonged high altitude exposure. Eur J Appl Physiol 92, 249-253.
24 Figure 1. Forest plot of standardised mean differences (means ± 95% confidence intervals [CIs]) for studies evaluating the influence of hypoxic exposure on postprandial hunger scores compared with sea level. The size of each circle represents the relative weight of each comparison. The diamond represents a SMD (mean ± 95% CI) for the model.
Figure 2. Forest plot of standardised mean differences (means ± 95% confidence intervals [CIs]) for studies evaluating the influence of hypoxic exposure on energy intake compared with sea level. The size of each circle represents the relative weight of each comparison. The diamond represents a SMD (mean ± 95% CI) for the model.
Figure 3. Forest plot of standardised mean differences (means ± 95% confidence intervals [CIs]) for studies evaluating the influence of hypoxic exposure on postprandial acylated ghrelin concentrations compared with sea level. The size of each circle represents the relative weight of each comparison. The diamond represents a SMD (mean ± 95% CI) for the model.
Figure 4. Univariable meta-regression for hypoxic severity versus the postprandial acylated ghrelin concentration responses to hypoxic exposure expressed as standardised mean difference (SMD).
Figure 5. Forest plot of standardised mean differences (means ± 95% confidence intervals [CIs]) for studies evaluating the influence of hypoxic exposure on fasted insulin concentrations compared with sea level. The size of each circle represents the relative weight of each comparison. The diamond represents a SMD (mean ± 95% CI) for the model.
Figure 6. Univariable meta-regression for hypoxic severity versus fasted insulin concentration responses to hypoxic exposure expressed as standardised mean difference (SMD).
25
Table 1. Summary of moderator variable analysis for postprandial hunger, energy intake, postprandial acylated ghrelin and fasted insulin meta-analysis by subgroup and meta-regression
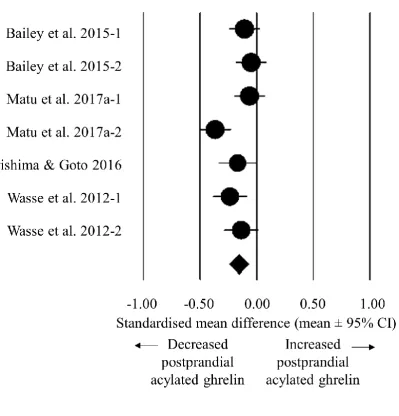
Moderator Variable p value Comparison
Postprandial hunger
Acclimatisation status 0.183 Acclimatised (n = 3; SMD -0.382, 95% CI -0.749 to -0.015) Unacclimatised (n = 11; SMD -0.110, 95% CI -0.270 to 0.050) Hypoxic method 0.396 Simulated hypobaric (n = 3; SMD -0.382, 95% CI -0.749 to -0.015)
Simulated normobaric (n = 9; SMD -0.151, 95% CI -0.330 to 0.028) Terrestrial altitude (n = 2; SMD -0.001, 95% CI -0.457 to 0.455) Activity status 0.049 Passive (n = 6; SMD -0.350, 95% CI -0.598 to -0.103)
Active (n = 8; SMD -0.051, 95% CI -0.216 to 0.114)
Hypoxic severity 0.175 Meta-regression of altitude height vs. SMD (slope -0.0001, 95% CI -0.0002 to 0.0000) Duration of exposure 0.889 Meta-regression of duration of exposure vs. SMD (slope -0.0017, 95% CI -0.0224 to 0.0258) Energy intake
Hypoxic method 0.833 Simulated normobaric (n = 6; SMD -0.531, 95% CI -1.014 to -0.047) Terrestrial altitude (n = 2; SMD -0.448, 95% CI -1.045 to 0.149) Activity status 0.970 Passive (n = 2; SMD -0.489, 95% CI -1.207 to 0.230)
Active (n = 6; SMD -0.505, 95% CI -0.941 to -0.069)
Hypoxic severity 0.289 Meta-regression of altitude height vs. SMD (slope -0.0003, 95% CI -0.0007 to 0.0002) Duration of exposure 0.056 Meta-regression of duration of exposure vs. SMD (slope 0.0509, 95% CI -0.0014 to 0.1031) Postprandial acylated ghrelin
Activity status 0.450 Passive (n = 2; SMD -0.207, 95% CI -0.321 to -0.092) Active (n = 5; SMD -0.145, 95% CI -0.258 to -0.031)
Hypoxic severity 0.010 Meta-regression of hypoxic severity vs. SMD (slope -0.0001, 95% CI -0.0002 to -0.0000) Duration of exposure 0.293 Meta-regression of duration of exposure vs. SMD (slope -0.4196, 95% CI -1.2018 to 0.3625) Fasted insulin
Acclimatisation status <0.0005 Acclimatised (n = 12; SMD 1.016, 95% CI 0.582 to 1.450) Unacclimatised (n = 22; SMD 0.121, 95% CI -0.121 to 0.363) Hypoxic method <0.0005 Simulated hypobaric (n = 6; SMD 1.052, 95% CI 0.638 to 1.467)
Simulated normobaric (n = 7; SMD -0.215, 95% CI -0.913 to 0.361) Terrestrial altitude (n = 21; SMD 0.443, 95% CI 0.162 to 0.724) Activity status 0.107 Passive (n = 16; SMD 0.619, 95% CI 0.184 to 1.055)
Active (n = 18; SMD 0.211, 95% CI -0.027 to 0.450)
34
Article title: The effects of hypoxia on hunger perceptions, appetite-related hormone concentrations, and energy intake: a
systematic review and meta-analysis
Journal: Appetite
Authors names: Jamie Matu, Javier T. Gonzalez, Theocharis Ispoglou, Lauren Duckworth and Kevin Deighton
Corresponding author: Dr Kevin Deighton, Institute for Sport Physical Activity & Leisure, Leeds Beckett University,
Leeds, LS6 3QS, United Kingdom (email: [email protected])
Supplementary material
Search strategy: PubMed and The Cochrane Library as well as MEDLINE, SPORTDiscus, PsycINFO and CINAHL, via EBSCOhost
Search terms:
1. Altitude
2. Hypoxia
3. Hypoxic
4. Mountaineering
5. Appetite
6. Appetite hormones
7. Ghrelin
8. Acylated ghrelin
9. GLP-1
10. Glucagon like peptide-1
11. Peptide YY
12. PYY
13. Leptin
14. Pancreatic polypeptide
15. Insulin
16. CCK
17. Cholecystokinin
18. Hunger
19. Satiety
20. Energy intake
21. Food intake
22. Energy balance
Searches:
35
B) 2 and 5 or 6 or 7 or 8 or 9 or 10 or 11 or 12 or 13 or 14 or 15 or 16 or 17 or 18 or 19 or 20 or 21 or 22
C) 3 and 5 or 6 or 7 or 8 or 9 or 10 or 11 or 12 or 13 or 14 or 15 or 16 or 17 or 18 or 19 or 20 or 21 or 22
D) 4 and 5 or 6 or 7 or 8 or 9 or 10 or 11 or 12 or 13 or 14 or 15 or 16 or 17 or 18 or 19 or 20 or 21 or 22
36
Article title: The effects of hypoxia on hunger perceptions, appetite-related hormone concentrations, and energy intake: a systematic review and meta-analysis
Journal: Appetite
Authors names: Jamie Matu, Javier T. Gonzalez, Theocharis Ispoglou, Lauren Duckworth and Kevin Deighton
Corresponding author: Dr Kevin Deighton, Institute for Sport Physical Activity & Leisure, Leeds Beckett University, Leeds, LS6 3QS, United Kingdom (email:
Supplementary Table 1. Effects of hypoxic exposure on fasted hunger and fasted hormone concentrations
Study Participants Intervention Variables assessed
Design Hypoxic severity /m
Duration Acclimatisation status Hypoxic method Activity status Hunger /mm GLP-1 /pgml-1 Insulin /µUmL-1.
Leptin /pgml-1 PYY /pgml-1 Total ghrelin /pgml-1 Aeberli et al.
2013-1
22 men and women combined
Longitudinal 4559 2 days Unacclimatised Terrestrial altitude
Active SL: 59 (8) ALT: 43 (8)
- - - - -
Aeberli et al. 2013-2
22 men and women combined
Longitudinal 4559 4 days Unacclimatised Terrestrial altitude
Active SL: 59 (8) ALT: 64 (6)
- - - - -
Bailey et al. 2004
7 men and women combined
Longitudinal 4780 11 days Unacclimatised Terrestrial altitude
Active - SL: 68.2 (29.7) ALT: 89.3 (44.8) SL: 13.3 (5.6) ALT: 10.4 (6.8)
SL: 42 (19) ALT: 34 (13) #a
- -
Benso et al. 2007
9 men Longitudinal 5200 61 days Acclimatised Terrestrial altitude
Active - - SL: 10.1 (2.4) ALT: 10.9 (2.4) SL: 777 (197) ALT: 606 (209)
- SL: 147 (26) ALT: 158 (45) Braun et al.
2001
12 females Longitudinal 4300 16 hours Unacclimatised Simulated hypobaric
Passive - - SL: 3.3 (1.5) ALT: 5.0 (2.0)
- - -
Castell et al. 2010-1
35 men Longitudinal 2134 1 day Unacclimatised Terrestrial altitude
Active - - - SL: 2 (2)
ALT: 2 (1)
- -
Castell et al. 2010-2
56 men Longitudinal 2743 14 days Unacclimatised Terrestrial altitude
Active - - - SL: 2 (2)
ALT: 1 (1)
- -
Castell et al. 2010-3
53 men Longitudinal 2743 28 days Unacclimatised Terrestrial altitude
Active - - - SL: 2 (2)
ALT: 2 (1)
37
Study Participants Intervention Variables assessed
Design Hypoxic severity /m
Duration Acclimatisation status Hypoxic method Activity status Hunger /mm GLP-1 /pgml-1 Insulin /µUmL-1.
Leptin /pgml-1 PYY /pgml-1 Total ghrelin /pgml-1
Debevec et al. 2014a-1
11 men Longitudinal 4000 1 day Unacclimatised Simulated normobaric
Active SL: 40.2 (36.4) ALT: 45.3 (31.4)
- - - - -
Debevec et al. 2014a-2
11 men Longitudinal 4000 21 days Unacclimatised Simulated normobaric
Active SL: 40.2 (36.4) ALT: 44.3 (33.6)
- - - - -
Debevec et al. 2014a-3
11 men Longitudinal 4000 1 day Unacclimatised Simulated normobaric
Passive SL: 49.9 (29.6) ALT: 46.4 (40.0)
- - - - -
Debevec et al. 2014a-4
11 men Longitudinal 4000 21 days Unacclimatised Simulated normobaric
Passive SL: 49.9 (29.6) ALT: 47.5 (40.1)
- - - - -
Debevec et al. 2014b-1
8 men Longitudinal 4000 1 day Unacclimatised Simulated normobaric
Active SL: 45.6 (24.0) ALT: 47.0 (23.2) SL: 12.0 (21.8) ALT: 12.4 (19.3) SL: 10.6 (2.0) ALT: 10.9 (1.9) SL: 4910 (3530) ALT: 6920 (4220) SL: 97.8 (21.8) ALT: 93.8 (13.3) SL: 911 (239) ALT: 817 (162) Debevec et al.
2014b-2
8 men Longitudinal 4000 10 days Unacclimatised Simulated normobaric
Active SL: 45.6 (24.0) ALT: 50.5 (20.2) SL: 12.0 (21.8) ALT: 9.1 (12.6) SL: 10.6 (2.0) ALT: 8.7 (1.9) SL: 4910 (3530) ALT: 3650 (2020) SL: 97.8 (21.8) ALT: 102.2 (13.6) SL: 911 (239) ALT: 876 (247)
Debevec et al. 2014b-3
6 men Longitudinal 4000 1 day Unacclimatised Simulated normobaric
Passive SL: 44.1 (10.9) ALT: 58.3 (19.0) SL: 6.3 (7.0) ALT: 8.6 (7.7) SL: 10.4 (1.5) ALT: 12.1 (1.9) SL: 3600 (1220) ALT: 5030 (2140) SL: 101.7 (25.6) ALT: 96.8 (31.2) SL: 705 (160) ALT: 743 (145) Debevec et al.
2014b-4
6 men Longitudinal 4000 10 days Unacclimatised Simulated normobaric
Passive SL: 44.1 (10.9) ALT: 33.8 (25.9) SL: 6.3 (7.0) ALT: 5.5 (6.7) SL: 10.4 (1.5) ALT: 8.1 (1.1) SL: 3600 (1220) ALT: 3490 (1360) S