GE-International Journal of Management Research
Vol. 5, Issue 5, May 2017 Impact Factor- 5.779 ISSN(O): 2321-1709, ISSN(P): 2394-4226© Associated Asia Research Foundation (AARF)
Website: www.aarf.asiaEmail : [email protected] , [email protected]A STUDY OF CONSUMER SATISFACTION TOWARDS
NEUROMARKETING IN INDIA WITH SPECIAL REFERENCE TO
KANO MODEL
Harit Kumar1, Dr. Neha Mathur2, Dr. Sangeeta Jauhari3
1Research Scholar, AISECT University, Bhopal.
2Dean, Department of Management, AISECT University.
3 HOD, Department of Management, AISECT University, Bhopal.
ABSTRACT
This paper presents consumer satisfaction towards neuromarketing. It is analyzed by using Kano
model and discusses the potential benefits that can be achieved by applying this approach to skis
the application of neuromarketing. Neuromarketing investigates important information that
commonly consumer purchase decisions take place at a mental, emotional and instinctive level;
those take place in the subconscious brain that is under the levels of controlled awareness. Due
to this striking motive, the perception technologists of the market are extremely keen to study the
techniques of successful handling of the subconscious brain actions. The major reason is to
encourage the preferred response in person’s satisfaction as intensely as possible. This article
with the application of Kano Model examines the impact of application of neuroscience
techniques on marketing practices as these communicate to the exercise of individual free will.
This study centers to investigate the consumer satisfaction towards neuromarketing by Kano
questionnaire; includes questions involving consumers’ awareness, consent, and understanding
to what may be viewed as foray of their privacy rights.
Key Words: Consumer Satisfaction, Kano’s Model, Kano’s Questionnaire, Neuroscience,
Introduction
The emerging application of neuroscience techniques in marketing by the name of
neuromarketing, which conduct customer brain research in a managerial decision making, it has
been observed that neuromarketing is gaining popularity in the academics and business world as
well. Therefore, the aim of this paper is to measure the consumer perception towards
neuromarketing tools. Although, available neuromarketing studies do not provide clear
impression of neuromarketing influence on consumer perception while considering technical as
well as ethical issues. The article uses the approach of Kano Model in order to do so.
As neuromarketing was emerged in 2002, its application is continuously increasing and it is
becoming famous among companies, marketers and advertisers (Morin, 2011). Although the
term neuromarketing has connected with medical industry and psychology, this paper will focus
on the consumer perception towards neuromarketing in India particularly.
In current scenario, all the markets are congested by plentiful similar and yet a little different
products, Neuromarketing emerged as a key discipline to regularly innovate and distinguish
products, which meet customer needs positively (Leonard, & Rayport, 1997; Dapkevičius, &
Melnikas, 2011). By reason of marketer first intention of meeting customer needs, there is a need
to evaluate customer brain, involved in purchase decision making and this objective is
performed by neuromarketing research techniques (Kenning & Plassmann, 2008; Huettel et al.,
2009b). Consequently, neuromarketing techniques such as eye tracking, skin conductance,
fMRI, EEG etc. are commonly getting increased concentration and provide better understanding
about consumer’s brain inside to marketers (Lieberman, 2007; Dimoka, Banker, Benbasat,
Davis, Dennis, Gefen, & Weber, 2012; Calvert, & Brammer, 2012; Ariely & Berns, 2010;
Venkatraman et al., 2012).
This paper will measure consumer perception towards neuromarketing in India with the help of
Kano’s model i.e, is based on the two-factor theory Herzberg and gave a helpful diagram to
identify ranking of customer’s satisfaction or dissatisfaction of a particular product or service
(Tan and Shen, 2000; Kuo, 2004; Tontini, 2007). In fact, an offering of a marketer, a customer
might have a variety of satisfaction or dissatisfaction on the basis their needs are fulfilled
dimension that goes from total satisfaction (also called Delight and Excitement) to total
dissatisfaction (or Frustration).
Japanese researcher and consultant Noriaki Kano published a paper in 1984. This paper
described about procedure that gives contribution in measuring customer’s satisfaction towards
product. Outcome of that research is commonly called as Kano Model. One can conclude about
how customers feelings through a questionnaire, and that questionnaire is known as Kano
questionnaire.
Figure1. Kano model of customer satisfaction (Sauerwein et al., 1996)
Literature Review
Now days marketers have adopted an integrative field as neuromarketing, that have been
emerged for better understanding and characterizing the neural correlation behind consumer
behavior and the processes underlying choice. These human behavioral theories have started to
integrate conclusion from neuroscience to discriminate the neurological and physiological basics
as well as the somatic factors that control consumer behavior. As such, neuromarketing evolved
from the integration of marketing and neuroscience and projected an interdisciplinary approach
to probing the neural correlates of consumer decision-making (Sanfey, Lowenstein, McClure &
Cohen, 2006).
Neuromarketing is a discipline within neuroeconomics that look into marketing related
Neuromarketing focuses to examine consumer behavior through the application of neural
processes and neuroscientific techniques sequentially to form a holistic concept of the neural
basis of brand relationships and purchasing power. This emerging field has its scope to
scientifically explain psychological position of customer that play a significant role in consumer
buying decision and to provide a broad estimation of the effectiveness and influence of a range
of marketing tactics for example advertising and product placement through focusing on how
these tactics change an individual’s neurobiology. Neuromarketing provides platform for
investigation into the neural pathways and processes that pave consumer purchasing behaviors
through neuroimaging and event-related potentials (ERP) (Javorm Koller, Lee, Chamberlain &
Ransmayr, 2009).
Neuromarketing, as a discipline of marketing commercially introduced in 2002 by companies
such as SalesBrain and Brighthouse. These companies started offering marketing and consulting
services that were based in neuroscience techniques (Morin, 2013). In the first neuromarketing
study, McClure used fMRI data to find the neural correlates of participant’s preferences between
Coke and Pepsi (Morin, 2013).
It has been observed by Morin in 2011 that neuromarketing has potential to investigate 4P’s of
marketing- product, price, promotion and place- and can contribute extensively to marketer’s
understanding about effectively marketing their products or services. An increasing number of
marketing research papers, journals, schools, organizations and conferences utilize
neuroscientific data to better understanding behind consumer buying decision-making and the
ways by which that knowledge can be utilized to develop innovative marketing practices.
Neuromarketing has offered lots of opportunities for companies to constantly determine implicit
reactions to marketing stimuli, the field is still at an emerging stage.(Morin, 2011).
Martin Lindstorm’s in his book “Buyology - Truth and Lies about Why We Buy” (2010)
proposes that subconscious mind plays a key role in consumer’s buying decisions.
Neuromarketing is a field of marketing research, oriented towards Branding, Product design,
Neuromarketing applies various techniques for measuring consumer behavior including Eye
tracking (measuring eye gaze patterns, say, on a landing page), Analysing facial expressions,
Behavioural experiments, Biometrics (body signal measures) that measure perspiration,
respiration, heart rate, and facial muscle movement (electromyography [EMG]) and Neuromeric
(brain signal measures) that measure electrical activity (electroencephalography [EEG]), and
blood flow (functional magnetic resonance imaging [fMRI]) in the brain.
The Kano model focuses different product attributes. Traditionally for measuring customer
satisfaction the relationship between the attributes and customer satisfaction was linearly
observed. Kano model more specifically classifies the customer satisfaction between the
performance of attributes and customer satisfaction as non-linear. It takes attributes as "mustbe",
"one-dimensional" or "attractive" (Kano et al., 1984, Berger et al. 1993, Matzler et al. 1996,
Nilson-Witell and Fundin 2005).
In 1984, Kano proposed the conceptual explanation of the Kano methodology, with the
application of Kano questionnaire, a new research field was born and with this concept Kano
presented his theory of "attractive quality and must-be quality" in the Western world. (Kano
1995, Yamada, 1998). Witell et. al., (2013) advised to use the traditional five-level Kano
questionnaire.
To better understand the customer perception about an offering, group of functional and
dysfunctional questionnaire design is applied. It aims to find out the customer perception towards
offering of marketers (Lee et al., 2009).
A review of various researches proves the application of Kano’s Model useful in measuring the
Consumer perception. Kano’s Model has been applied extensively within scholarly research
(e.g., Bhattacharyya & Rahman, 2004; Emery & Tian, 2002; Emery & Tolbert, 2003; Liu,2008;
Liu & Wu,2009; Schvaneveldt, Enhawa & Miyakawa, 1991; Fuller & Matzler, 2007;
Schvaneveldt, Matzler & Hinterhuber, 1998; Yang, 2003 & 2005) and within a variety of
contexts such as manufactured consumer products (Miyakawa & Wong, 1989), consumer
services including banking, cleaning services, restaurants, and grocery stores (Schvaneveldt,
& Hinterhuber, 1998), transportation (Silvestro & Johnson, 1990), as well as studies in employee
satisfaction (Matzler, 2004) and student/professor satisfaction (Emery, 2006).
Objective of Research
➢ To ascertain customer satisfaction towards emerging integration of neuromarketing
techniques with market research studies.
Methodology
This research measures consumer satisfaction towards neuromarketing in India through the
implementation of a quantitative survey administered on emerging integration of neuromarketing
techniques in market research studies in India. The survey instrument is based on the Kano
Model questionnaire format. Participants in the study are qualified to participate as they are
Academicians and 100 respondents were selected through random sampling from management
colleges of U.P and M.P. in India.
Kano questionnaire
In order to uncover our customer’s perceptions towards neuromarketing, this research uses the
Kano questionnaire. It consists of a pair of questions for each feature researcher wants to
evaluate:
1(A) Neuromarketing is an emerging branch of neuroscience where with the application of
Biological techniques researchers can better understand the Buy-ology of customer, how do you
feel?
■ I like it that way. □ It must be that way. □ I am neutral.
□ I can live with it that way. □ I dislike it that way.
1 (B) Neuromarketing is an emerging branch of neuroscience where with the application of
Biological techniques researchers can not better understand the Buy-ology of customer, how do
you feel?
□ It must be that way. ■ I am neutral.
□ I can live with it that way. □ I dislike it that way.
The first question is called the functional form and the second one is the dysfunctional form.
Researcher will do this through an evaluation table that combines the functional and
dysfunctional answers in its rows and columns (respectively,). Each answer pair leads to one of
those categories.
Figure2. Kano Questionnaire Evaluation (Sauerwein et al., 1996)
Analysis and Interpretation
The questionnaire is analysed in three steps. After combined functional (positive) and
dysfunctional (negative) question’s answers (see Figure 2), the next step is the results analysis
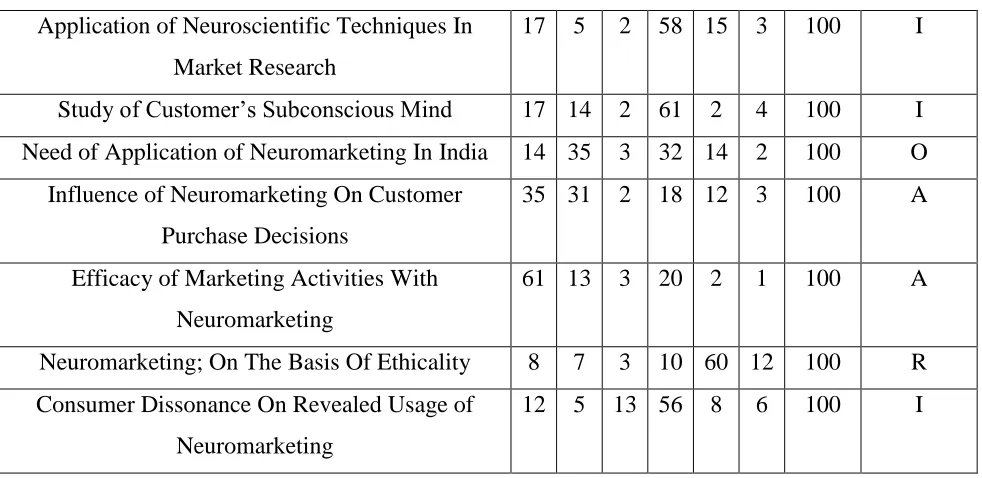
and interpretation. Below Table 1 is presented and it shows Consumer’s Perception towards
neuromarketing in India. The easiest way for the results interpretation is analysis, which is based
on the response rate of recurrence.
Factors (Customer Requirements) A O M I R Q Total Category
Need of Market Research 32 41 1 21 2 3 100 O
Application of Neuroscientific Techniques In
Market Research
17 5 2 58 15 3 100 I
Study of Customer’s Subconscious Mind 17 14 2 61 2 4 100 I
Need of Application of Neuromarketing In India 14 35 3 32 14 2 100 O
Influence of Neuromarketing On Customer
Purchase Decisions
35 31 2 18 12 3 100 A
Efficacy of Marketing Activities With
Neuromarketing
61 13 3 20 2 1 100 A
Neuromarketing; On The Basis Of Ethicality 8 7 3 10 60 12 100 R
Consumer Dissonance On Revealed Usage of
Neuromarketing
[image:8.612.67.558.31.270.2]12 5 13 56 8 6 100 I
Table 1. Consumer’s response towards Neuromarketing (Kano Questionnaire Evaluation)
The customer satisfaction coefficient indicates how much the service or product features and
properties may lead to customer satisfaction or vice versa – frustration/dissatisfaction. Summing
up the average satisfaction with the impact, influence, it must be to add attractive,
one-dimensional column and the divide by the total attractive, one-one-dimensional, must-be and
indifferent responses. To calculate the average impact on dissatisfaction it should add the
must-be and one-dimensional columns and then divide by the same factors.
Extent of Satisfaction: A+O
A+O+M+I
Extent of dissatisfaction: O+M
(A+O+M+I)∗(−1)
In this case, the minus sign is placed in a formula to emphasize its negative impact on customer
satisfaction if this expected quality is not fulfilled.
Satisfaction with the positive values included in the scope from 0 to 1. If the value is closer to 1,
the impact of customer satisfaction is greater; positive coefficient, which approaches the value 0
indicates that there is very little impact, importance. However, it is important to see negative
strong; size, approximately equal to 0, meaning that a certain property does not feature such a
high level of dissatisfaction.
Factors (Customer
Requirements) A O M I R Q
Tota
l Category
A + O A + O + M + I
O + M
(A + O + M + I) ∗ (−1)
Need of Market
Research 32 41 1 21 2 3 100 O 0.76 -0.45
Buy-Ology of
Customer 42 16 3 35 - 4 100 A 0.60 -0.20
Application of Neuroscientific
Techniques In Market Research
17 5 2 58 15 3 100 I 0.25 -0.085
Study of Customer’s Subconscious Mind
17 14 2 61 2 4 100 I 0.33 -0.17
Need of Application of Neuromarketing
In India
14 35 3 32 14 2 100 O 0.58 -0.45
Influence of Neuromarketing On
Customer Purchase Decisions
35 31 2 18 12 3 100 A 0.78 -0.38
Efficacy of Marketing Activities With Neuromarketing
61 13 3 20 2 1 100 A 0.76 -0.16
Neuromarketing; On The Basis Of
Ethicality
8 7 3 10 60 12 100 R 0.53 -0.35
Consumer Dissonance On Revealed Usage of
Neuromarketing
12 5 13 56 8 6 100 I 0.19 -0.21
Table2. Customer Satisfaction towards Neuromarketing
CONCLUSIONS
This study proposes an integrated approach of Consumer Satisfaction Analysis with Kano’s
model questionnaire for identifying Indian Customer Satisfaction and this study concludes
absence of marker research, Application of Neuromarketing In India, Influence of
customer satisfaction coefficient of -0.45,-0.45, -0.38 and -035 lead to slightly dissatisfaction;
and absence of Study of customer buy-ology, Application of Neuroscientific Techniques In
Market Research, Study of Customer’s Subconscious Mind, Marketing Activities With
Neuromarketing and Revealed Usage of Neuromarketing with respective negative customer
satisfaction coefficient of -0.2, -0.085,-0.17,-0.16 and -0.21 lead as no reason for customer
dissatisfaction.
On the other side presence of market research, study of Buy-Ology of Customer, Need of
Application of Neuromarketing In India, Influence of Neuromarketing On Customer Purchase
Decisions, Efficacy of Marketing Activities With Neuromarketing and Ethicality with respective
positive customer satisfaction coefficient of 0.76, 0.60, 0.58, 0.78,0.76 and0.53 lead
proportional high customer satisfaction while Application of Neuroscientific Techniques In
Market Research, Study of Customer’s Subconscious Mind and Dissonance On Revealed Usage
of Neuromarketing with respective positive customer satisfaction coefficient of 0.25, 0.33 and
0.19 lead slightly low customer satisfaction.
References
1. Ariely, D., & Berns, G. S. (2010). Neuromarketing: the hope and hype of neuroimagingin
business. Nature Reviews Neuroscience, 11(4), 284-292.
2. Bhattacharyya, S., & Rahman, Z. (2004). Capturing the customer's voice, the centerpiece
of strategy making: A case study in banking. European Business Review, 16(2), 128-138.
3. Berger, C., Blauth, R., Boger, D., Bolster, C., Burchill, G., DuMouchel, W., Pouliot, F.,
Richter, R., Rubinoff, A., Shen, D., Timko, M. and Walden, D. (1993). Kano’s methods
for understanding customer-defined quality. The Center for Quality of Management
Journal, 2(4), 2–36.
4. Dapkevičius, A., & Melnikas, B. (2011). Influence of price and quality to customer
satisfaction: neuromarketing approach. Science–Future of Lithuania/Mokslas–Lietuvos
Ateitis, 1(3), 17-20
5. Dimoka, A., Banker, R. D., Benbasat, I., Davis, F. D., Dennis, A. R., Gefen, D., &
Weber, B. (2012). On the use of neurophysiological tools in IS research: developing a
research agenda for neurois. MIS Quarterly, 36(3).
6. Emery, C. (2006). An examination of professor expectations based on the Kano model of
7. Emery & Tolbert, S. (2003). Using the Kano model of customer satisfaction to define and
communicate supervisor expectations. Allied Academies International Conference.
8. Emery & Tian, R. (2002). Schoolwork as products, professors as customers: A practical
teaching approach in business education. Journal of Education for Business, 78(2),
97-102
9. Fugate D.L. (2007). Neuromarketing: a layman‘s look at neuroscience and its potential
application to marketing practice. Journal of Consumer Mar- keting 24(7): 385–394.
10.Fuller, J., & Matzler, K. (2007). Virtual product experience and customer participation -
A chance for customer-centered, really new products. Technovation, 27(6), 378-387.
11.Huettel SA, Song AW, McCarthy G (2009b) Functional magnetic resonance imaging,
2nd edn. Sinauer, Sunderland
12.Kano, N., Seraku, N., Takahashi, F., & Tsuji, S. (1984). Attractive quality and must-be
quality
13.Kano, N. (1995). Upsizing the organization by attractive quality creation. In Total
Quality Management (pp. 60-72). Springer Netherlands
14.Kenning, P., & Plassmann, H. (2005). NeuroEconomics: An overview from an economic
perspective. Brain Research Bulletin, 67(5), 343-354.
15.Kuo Y-F (2004). Integrating Kano’s model into web-community service quality. Total
Qual. Manage., 15(7): 925 - 939.
16.Lee YC, Huang SY (2009). A new fuzzy concept approach for Kano’s model. Expert
Syst. Appl. 36:4479-4484.
17.Leonard, D., & Rayport, J. F. (1997). Spark innovation through empathic design. Harvard
business review, 75, 102-115.
18.Lieberman, M. D. (2007). ―Social Cognitive Neuroscience: A Review of Core
Processes, Annual Review of Psychology (58), pp. 259-289.
19.Lindstrom, M. (2010). Buyology: Truth and lies about why we buy. Random House
Digital, Inc.
20.Liu & Wu, S. (2009). Service quality of student dorms using a refined Kano 2D model: A
case study of a national hospitality college in southern Taiwan. Journal of Information &
21.Liu, M. (2008). Using the refined Kano’s model to measure university education quality:
The case study on the department of food and beverage management in southern Taiwan.
Business Review, Cambridge, 11(1), 111-117.
22.Matzler, K., Fuchs, M., & Schubert, A. (2004). Employee satisfaction: Does Kano’s
model apply? Total Quality Management & Business Excellence, 15(9-10), 1179-1198.
23.Matzler, K., Hinterhuber, H. H., Bailom, F., & Sauerwein, E. (1996). How to delight your
customers. Journal of Product & Brand Management, 5(2), 6-18.
24.Matzler & Hinterhuber, H. (1998). How to make product development projects more
successful by integrating Kano’s model of customer satisfaction into quality function
deployment. Technovation, 18(1), 25-38.
25.Miyakawa, M., & Wong, C. (1989). Analysis of attractive quality and must-be quality
through product expectation factors. Proceedings of 35th Technical Conference, Tokyo.
Society for Quality Control, 101-104.
26.Morin, C. (2011). Neuromarketing: the new science of consumer behavior. Society,
48(2), 131-135.
27.Nilsson-Witell, L., & Fundin, A. (2005). Dynamics of service attributes: a test of Kano's
theory of attractive quality. International Journal of Service Industry Management, 16(2),
152-168.
28.Sanfey, A. G., Loewenstein, G., McClure, S. M., & Cohen, J. D. (2006).
Neuroeconomics: cross-currents in research on decision-making. Trends in cognitive
sciences, 10(3), 108-116..
29.Sauerwein E., Bailom F., Matzler K., Hinterburger H. (1996). The Kano Model: How to
delight your customers. Available
at:http://faculty.kfupm.edu.sa/CEM/bushait/CEM_515-082/kano/kano-model2.pdf.
30.Tan KC, Shen XX (2000). Integrating Kano’s model in the planning matrix of quality
function deployment. Total Qual. Manage., 11(8): 1141 - 1151.
31.Tontini G (2007). Integrating the Kano model and QFD for designing new products.
Total Qual. Manage. Bus. Excell., 18(6): 599 - 612.
32.Venkatraman, V., Clithero, J. A., Fitzsimons, G. J., & Huettel, S. A. (2012). New scanner
data for brand marketers: How neuroscience can help better understand differences in
33.Von Dran, G., Zhang, P., & Small, R.(1999). Quality Websites: An Application of the
Kano Model to Website Design, AMCIS 1999 Proceedings. Paper 314. Retrieved from
http://aisel.aisnet.org/amcis1999/314
34.Yang, C. (2003). Establishment and applications of the integrated model of service
quality measurement. Managing Service Quality, 13(4), 310-324.
35.Yang, C.. (2005). The refined Kano’s model and its application. Total Quality
Management & Business Excellence, 16(10), 1127-1137.
36.Yamada, S. (1998). Idea generation in attractive quality creation. In Proceedings of the