INTRODUCTION
Lung size mismatch between donor and recipient is a major cause of poor lung function and worse survival after lung trans-plantation (LTx). However, controversy remains regarding the definition of proper size and the optimal method for
predict-ing lung size.1-4
Although thoracic diameter, chest radiography, anthropom-etry, weight, and other factors have been used to predict lung volume in the past,5-7 lung volume is now commonly calculat-ed by formulas that utilize height, age, and sex.1,8 These formu-las are modified and differ among nations and institutes.9,10 Moreover, the predictive total lung capacity (pTLC) calculated by these formulas differs among races11 and has disadvantag-es when applied to single LTx candidatdisadvantag-es. Also, since LTx can-didates have variable thoracic cavity volumes according to their lung diseases, it is difficult to estimate their lung volumes us-ing formulas that target the healthy population.12
This study aimed to determine the degree of differences in actual TLC (TLCCT) using chest computed tomography (CT) and the pTLC using the commonly used formula in LTx candi-dates. Through this comparison, this study also intended to clarify the range of difference needed for donor lung selection
Comparison of Predicted Total Lung Capacity and
Total Lung Capacity by Computed Tomography
in Lung Transplantation Candidates
Sung Ho Hwang
1, Jin Gu Lee
2, Tae Hoon Kim
3, Hyo Chae Paik
2, Chul Hwan Park
3, and Seokjin Haam
41Department of Radiology, Korea University Medical Center, Anam Hospital, Seoul;
2Department of Thoracic and Cardiovascular Surgery, Severance Hospital, Yonsei University College of Medicine, Seoul;
3Department of Radiology, Gangnam Severance Hospital, Yonsei University College of Medicine, Seoul;
4Department of Thoracic and Cardiovascular Surgery, Ajou University School of Medicine, Suwon, Korea.
Purpose: Lung size mismatch is a major cause of poor lung function and worse survival after lung transplantation (LTx). We com-pared predicted total lung capacity (pTLC) and TLC measured by chest computed tomography (TLCCT) in LTx candidates.
Materials and Methods: We reviewed the medical records of patients on waiting lists for LTx. According to the results of pulmo-nary function tests, patients were divided into an obstructive disease group and restrictive disease group. The differences between pTLC calculated using the equation of the European Respiratory Society and TLCCT were analyzed in each group.
Results: Ninety two patients met the criteria. Thirty five patients were included in the obstructive disease group, and 57 patients were included in the restrictive disease group. pTLC in the obstructive disease group (5.50±1.07 L) and restrictive disease group (5.57±1.03 L) had no statistical significance (p=0.747), while TLCCT in the restrictive disease group (3.17±1.15 L) was smaller than that I the obstructive disease group (4.21±1.38 L) (p<0.0001). TLCCT/pTLC was 0.770 in the obstructive disease group and 0.571 in the restrictive disease group.
Conclusion: Regardless of pulmonary disease pattern, TLCCT was smaller than pTLC, and it was more apparent in restrictive lung disease. Therefore, we should consider the difference between TLCCT and pTLC, as well as lung disease patterns of candidates, in lung size matching for LTx.
Key Words: Lung transplantation, pulmonary function test, donor selection
Yonsei Med J 2016 Jul;57(4):963-967
http://dx.doi.org/10.3349/ymj.2016.57.4.963 pISSN: 0513-5796 · eISSN: 1976-2437
Received: September 17, 2015 Revised: November 10, 2015
Accepted: November 25, 2015
Corresponding author: Seokjin Haam, MD, PhD, Department of Thoracic and Cardiovascular Surgery, Ajou University School of Medicine, 164 World cup-ro, Yeongtong-gu, Suwon 16499, Korea.
Tel: 82-31-219-5213, Fax: 82-31-219-5215, E-mail: haamsj@aumc.ac.kr
•The authors have no financial conflicts of interest.
© Copyright: Yonsei University College of Medicine 2016
when using formulas to perform lung size matching.
MATERIALS AND METHODS
Patients
From January 1996 to December 2012, medical records and chest CT scans of 140 patients registered as lung transplant can-didates at Gangnam Severance Hospital were retrospectively analyzed. This study received approval from the Institutional Review Board at Gangnam Severance Hospital. We excluded patients with incomplete medical records, lacking results of a pulmonary function test (PFT) or CT image, and with a history of any thoracic surgery except lung biopsy.
pTLC calculation
In this study, pTLC was calculated using European Respirato-ry Society (ERS) formulas, which are as follows:13
Males: pTLC (mL)=(7.99 H–7.08)×1000; and
Females: pTLC (mL)=(6.60 H–5.79)×1000, where H repre-sents height in meters.
These equations apply to patients aged 18–70 years with a height of 1.55–1.95 m (males) or 1.45–1.80 m (females).
Pulmonary function test
Using spirometry, the forced expiratory volume in 1 second (FEV1) and forced vital capacity (FVC) were measured. Next, FEV1/FVC ratio was calculated. Knudson prediction equations derived from a patient’s age, height, and sex, were applied to the predicted values and the lower limits of normal.14 The patients’ lung disease patterns were classified as obstructive disease pat-tern (OD group) or restrictive disease patpat-tern (RD group) ac-cording to measured FEV1, FVC, and FEV1/FVC ratio (Fig. 1).15
CT protocol and volumetry analysis
Using a 64-slice CT system (SOMATOM Sensation 64; Siemens AG, Forchheim, Germany), routine non-enhanced CT with parameters of 130 mA and 100 kVp scanned lungs from the pos-terior costophrenic angles to the lung apices (3-mm beam col-limation; 1.0 pitch). Raw data were processed using a medium soft-tissue kernel without edge enhancement. The scans were acquired during a single respiratory pause at the end of a max-imum inspiratory effort. Patients were placed in a supine po-sition.
The lung volume in each CT dataset was measured using semi-automated segmentation software (Aquarius Intuition; Tera Re-con Inc., Foster City, CA, USA). Threshold limits of -400 to -1024 Hounsfield units were applied to exclude the surround-ing soft tissues and large vessels within the lungs.16 In most in-stances, this would be sufficient for isolating the lungs and central airways from undesired structures. TLCCT (L) was ob-tained by the number of included voxels in both lungs on the CT images (Fig. 2).
Comparison of pTLC and TLCCT
Through a comparison of pTLC calculated using the ERS equa-tion and TLCCT measured using chest CT, differences between OD and RD groups were investigated by PFT.
Statistical analysis
All data were presented as mean±standard deviation. The dif-ference in the sex ratio between the two groups was calculated using the Fisher’s exact test, whereas the Mann-Whitney U test
FEV1/FVC<lower limit of normal?
Restrictive or normal pattern
FVC<lower limit of normal?
Obstructive pattern No
No
Normal
Yes
Yes
[image:2.595.300.538.195.365.2]Restrictive pattern
Fig. 1. Flow chart for interpretation of pulmonary function tests. On the basis of FEV1, FVC, and FEV1/FVC ratio measured by spirometry, the lung
disease patterns were classified into obstructive and restrictive pat-terns. FEV1, forced expiratory volume in 1 second; FVC, forced vital
ca-pacity.
[image:2.595.300.539.432.639.2]was used to measure the other variables. All p-values<0.050 were considered statistically significant. All statistical analyses were performed using SPSS software, version 20.0 (IBM, Somers, NY, USA).
RESULTS
Among the 140 candidate patients, only 104 satisfied the study criteria. There were 35 patients (38%) in the OD group and 57 patients (62%) in the RD group. Twelve patients with mixed pat-tern of OD and RD were excluded in analysis. There was no significant difference in sex ratios (p=0.197). Age was signifi-cantly lower in the OD group than in the RD group (p<0.0001). While height did not differ between the groups (p=0.524), body weight was lower in the OD group than in the RD group (p= 0.035) (Table 1).
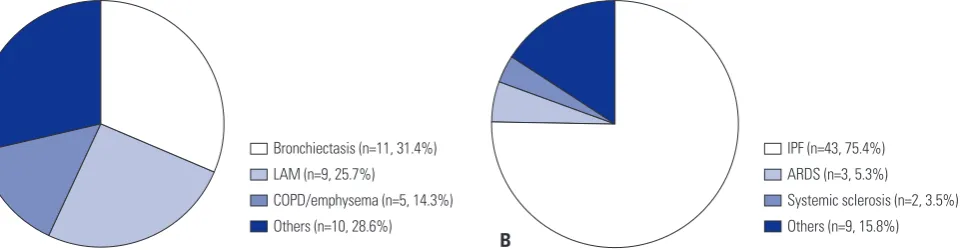
Regarding diseases in each group, bronchiectasis was the most common, followed by lymphangioleiomyomatosis and chronic obstructive pulmonary disease (COPD), in the OD group, whereas idiopathic pulmonary fibrosis (IPF) was most common in the RD group (Fig. 3).
The values of pTLC were 5.50±1.07 L and 5.57±1.03 L in the OD and RD groups respectively, which were not significantly different (p=0.749). However, the TLCCT of the OD group (4.27±1.38 L) was significantly larger than that for the RD group (3.17±1.15 L) (p<0.0001).
In comparison of pTLC and TLCCT, the values of pTLC were significantly larger than TLCCT regardless of groups (p<0001). Also, the difference values (ΔTLC) between pTLC and TLCCT were 2.02±1.07 L in the RD group and 1.13±1.19 L in the OD group, respectively, a statistically significant difference (p=0.001). The ratios of TLCCT to pTLC were 77.0% in the OD group and 57.1% in the RD group (Table 2).
DISCUSSION
Size mismatch between a donor lung allograft and a recipient thoracic cavity in LTx can cause many complications, includ-ing poor lung function and decreased long-term survival.3,17,18 Therefore, proper lung size matching has clinical significance in LTx.19,20 When a donor lung is far smaller than the recipient’s thoracic cavity, the risks of prolonged tube drainage or empy-ema increase. Also, lung compliance decreases when a graft hyper-expands to fill the thoracic cavity. Conversely, when a donor lung is much larger than a recipient’s thoracic cavity, at-electasis or distortion of the airway anatomy prohibits sputum expectoration and causes recurrent infection. Even in severe cases, hemodynamic compromise can occur.21
[image:3.595.56.294.315.418.2]Calculations of pTLC for donors and recipients with formu-las are widely used in current lung size matching procedures for LTx, and such formulas are derived from sex, height, and age data of healthy individuals.1,13,22 However, because thoracic cavity volume can vary according to a patient’s lung disease pat-tern,23 the use of these formulas in lung size matching for LTx Table 1. Clinical Characteristics of 92 Candidates for Lung Transplantation
OD group RD group p value
Number 35 (38%) 57 (62%)
Gender 0.197
Male 14 32
Female 21 25
Age (yrs) 42.4±13.7 53.4±9.4 <0.0001
Height (cm) 164.3±8.6 163.2±8.4 0.524
Weight (kg) 51.3±13.0 57.3±13.5 0.035
[image:3.595.57.293.461.525.2]OD, obstructive disease; RD, restrictive disease.
Table 2. Comparison of TLC between the OD and RD Groups
OD group RD group p value
pTLC (liter) 5.50±1.07 5.57±1.03 0.749
TLCCT (liter) 4.27±1.38 3.17±1.15 <0.0001
ΔTLC (liter) 1.13±1.19 2.02±1.07 0.001
TLCCT/pTLC (%) 77.0 57.1
OD, obstructive disease; RD, restrictive disease; pTLC, predicted total lung
capacity; TLCCT, TLC estimated using chest computed tomography; ΔTLC,
dif-ference value between pTLC and TLCCT.
Bronchiectasis (n=11, 31.4%) LAM (n=9, 25.7%)
COPD/emphysema (n=5, 14.3%) Others (n=10, 28.6%)
IPF (n=43, 75.4%) ARDS (n=3, 5.3%)
Systemic sclerosis (n=2, 3.5%) Others (n=9, 15.8%)
A B
[image:3.595.68.549.581.706.2]has several problems: for example, in patients with obstruc-tive lung diseases, such as COPD or emphysema, the thoracic cavity size increases, compared with the normal thoracic cavi-ty size, by diaphragmatic flattening and widening of the rib spaces,24 whereas in patients with restrictive lung disease, such as IPF, thoracic cavity size decreases due to chest wall shrinkage and contraction of the intercostal spaces.12 However, studies on degrees of size mismatch by lung diseases patterns are rare. Moreover, there is no clear evidence to demonstrate that lung disease pattern should be considered in lung size matching pri-or to LTx.
In evaluation of LTx candidates, most patients undergo a chest CT, by which the thoracic cavity volume can be mea-sured,24 and recently three-dimensional CT volumetry has been utilized for size matching in living donor LTx.25,26 In this study, lung diseases of LTx candidates were classified as either an ob-structive or restrictive disease pattern according to the results of PFT. By comparing TLCCT measured using chest CT and pTLC calculated using the ERS equation, we intended to inves-tigate differences between TLCCT and pTLC in LTx candidates and to determine whether we should consider lung disease patterns in size matching. Our results revealed no difference between the two groups in pTLC, whereas TLCCT was signifi-cantly larger in the OD group than in the RD group. These re-sults suggest that actual lung volume may differ according to lung disease pattern and it is inappropriate to perform lung size matching with equations derived from data for healthy populations. Accordingly, we should consider the effect of lung disease when matching donor and recipient lung sizes.
The difference value between pTLC and TLCCT was statisti-cally greater in the RD group than the OD group, and the ratio of TLCCT to pTLC was 77% in the OD group and 57% in the RD group. That is, irrespective of lung disease patterns, pTLC was larger than TLCCT. This finding might be attributed to differenc-es among racdifferenc-es, because we used the ERS equation for Europe-an in this study. Hence, when equations are applied to lung size matching, racial differences should be considered.
This study has several limitations. First, it is questionable whether the TLCCT could be substituted for the patient’s actual TLC. As TLC measured by PFT represents the functional as-pect and TLCCT provides the anatomical lung volume, a differ-ence could exist between the two values. However, Cooper, et al.27 demonstrated that TLC values measured using the helium dilution technique and those measured by chest CT were quite similar (r=0.973).28 Secondly, TLC
CT can change during respi-ration. In LTx candidates with end-stage lung disease, breath-holding is difficult; hence, error in measuring TLCCT could be exaggerated, compared with that in healthy people. However, since current CT equipment involves a single scan that is com-pleted in a few seconds, patients with lung disease do not ex-perience great difficulty.
In conclusion, regardless of lung disease pattern, TLCCT was smaller than pTLC calculated using a formula, and the
differ-ence was more remarkable in patients with the restrictive lung disease. Therefore, when an equation is used for donor-recipi-ent lung size matching, the difference between TLCCT and pTLC and lung disease pattern of LTx candidates should be consid-ered. Additionally, chest CT might be a more accurate tool for measuring TLC than an equation in lung size matching for LTx.
REFERENCES
1. Ouwens JP, van der Mark TW, van der Bij W, Geertsma A, de Boer WJ, Koëter GH. Size matching in lung transplantation using pre-dicted total lung capacity. Eur Respir J 2002;20:1419-22.
2. Eberlein M, Arnaoutakis GJ, Yarmus L, Feller-Kopman D, Dezube R, Chahla MF, et al. The effect of lung size mismatch on complica-tions and resource utilization after bilateral lung transplantation. J Heart Lung Transplant 2012;31:492-500.
3. Eberlein M, Reed RM, Permutt S, Chahla MF, Bolukbas S, Nathan SD, et al. Parameters of donor-recipient size mismatch and sur-vival after bilateral lung transplantation. J Heart Lung Transplant 2012;31:1207-13.e7.
4. Mason DP, Batizy LH, Wu J, Nowicki ER, Murthy SC, McNeill AM, et al. Matching donor to recipient in lung transplantation: how much does size matter? J Thorac Cardiovasc Surg 2009;137:1234-40.e1.
5. Massard G, Badier M, Guillot C, Reynaud M, Thomas P, Giudicelli R, et al. Lung size matching for double lung transplantation based on the submammary thoracic perimeter. Accuracy and functional results. The Joint Marseille-Montreal Lung Transplant Program. J Thorac Cardiovasc Surg 1993;105:9-14.
6. Harjula A, Baldwin JC, Starnes VA, Stinson EB, Oyer PE, Jamieson SW, et al. Proper donor selection for heart-lung transplantation. The Stanford experience. J Thorac Cardiovasc Surg 1987;94:874-80.
7. Griffith BP, Hardesty RL, Trento A, Paradis IL, Duquesnoy RJ, Zeevi A, et al. Heart-lung transplantation: lessons learned and fu-ture hopes. Ann Thorac Surg 1987;43:6-16.
8. Goldman HI, Becklake MR. Respiratory function tests; normal values at median altitudes and the prediction of normal results. Am Rev Tuberc 1959;79:457-67.
9. Roberts CM, MacRae KD, Winning AJ, Adams L, Seed WA. Refer-ence values and prediction equations for normal lung function in a non-smoking white urban population. Thorax 1991;46:643-50. 10. Crapo RO, Morris AH, Clayton PD, Nixon CR. Lung volumes in
healthy nonsmoking adults. Bull Eur Physiopathol Respir 1982;18: 419-25.
11. Harik-Khan RI, Fleg JL, Muller DC, Wise RA. The effect of anthro-pometric and socioeconomic factors on the racial difference in lung function. Am J Respir Crit Care Med 2001;164:1647-54. 12. Bellemare JF, Cordeau MP, Leblanc P, Bellemare F. Thoracic
di-mensions at maximum lung inflation in normal subjects and in patients with obstructive and restrictive lung diseases. Chest 2001; 119:376-86.
13. Stocks J, Quanjer PH. Reference values for residual volume, func-tional residual capacity and total lung capacity. ATS Workshop on Lung Volume Measurements. Official Statement of The European Respiratory Society. Eur Respir J 1995;8:492-506.
14. Knudson RJ, Slatin RC, Lebowitz MD, Burrows B. The maximal expiratory flow-volume curve. Normal standards, variability, and effects of age. Am Rev Respir Dis 1976;113:587-600.
Cleve Clin J Med 2003;70:866, 868, 871-3, passim.
16. Iwano S, Okada T, Satake H, Naganawa S. 3D-CT volumetry of the lung using multidetector row CT: comparison with pulmonary function tests. Acad Radiol 2009;16:250-6.
17. Eberlein M, Permutt S, Chahla MF, Bolukbas S, Nathan SD, Shlo-bin OA, et al. Lung size mismatch in bilateral lung transplantation is associated with allograft function and bronchiolitis obliterans syndrome. Chest 2012;141:451-60.
18. Eberlein M, Permutt S, Brown RH, Brooker A, Chahla MF, Boluk-bas S, et al. Supranormal expiratory airflow after bilateral lung transplantation is associated with improved survival. Am J Respir Crit Care Med 2011;183:79-87.
19. Aigner C, Jaksch P, Taghavi S, Wisser W, Marta G, Winkler G, et al. Donor total lung capacity predicts recipient total lung capacity after size-reduced lung transplantation. J Heart Lung Transplant 2005; 24:2098-102.
20. Santos F, Lama R, Alvarez A, Algar FJ, Quero F, Cerezo F, et al. Pul-monary tailoring and lobar transplantation to overcome size dis-parities in lung transplantation. Transplant Proc 2005;37:1526-9. 21. Orens JB, Boehler A, de Perrot M, Estenne M, Glanville AR,
Kes-havjee S, et al. A review of lung transplant donor acceptability cri-teria. J Heart Lung Transplant 2003;22:1183-200.
22. Ghio AJ, Crapo RO, Elliott CG. Reference equations used to predict pulmonary function. Survey at institutions with respiratory disease
training programs in the United States and Canada. Chest 1990; 97:400-3.
23. Russi EW, Karrer W, Brutsche M, Eich C, Fitting JW, Frey M, et al. Diagnosis and management of chronic obstructive pulmonary disease: the Swiss guidelines. Official guidelines of the Swiss Re-spiratory Society. Respiration 2013;85:160-74.
24. Irion KL, Marchiori E, Hochhegger B, Porto Nda S, Moreira Jda S, Anselmi CE, et al. CT quantification of emphysema in young sub-jects with no recognizable chest disease. AJR Am J Roentgenol 2009;192:W90-6.
25. Chen F, Kubo T, Yamada T, Sato M, Aoyama A, Bando T, et al. Ad-aptation over a wide range of donor graft lung size discrepancies in living-donor lobar lung transplantation. Am J Transplant 2013; 13:1336-42.
26. Chen F, Kubo T, Shoji T, Fujinaga T, Bando T, Date H. Comparison of pulmonary function test and computed tomography volumetry in living lung donors. J Heart Lung Transplant 2011;30:572-5. 27. Cooper ML, Friedman PJ, Peters RM, Brimm JE. Accuracy of
ra-diographic lung volume using new equations derived from com-puted tomography. Crit Care Med 1986;14:177-81.