Citation:
Matu, J and Deighton, K and Ispoglou, T and Shannon, OM and Duckworth, L (2017) A
high fat breakfast attenuates the suppression of appetite and acylated ghrelin during
exer-cise at simulated altitude.
Physiol Behav, 179 (1).
pp.
353-360.
ISSN 1873-507X DOI:
https://doi.org/10.1016/j.physbeh.2017.07.006
Link to Leeds Beckett Repository record:
http://eprints.leedsbeckett.ac.uk/3894/
Document Version:
Article
The aim of the Leeds Beckett Repository is to provide open access to our research, as required by
funder policies and permitted by publishers and copyright law.
The Leeds Beckett repository holds a wide range of publications, each of which has been
checked for copyright and the relevant embargo period has been applied by the Research Services
team.
We operate on a standard take-down policy.
If you are the author or publisher of an output
and you would like it removed from the repository, please
contact us
and we will investigate on a
case-by-case basis.
1
Title: A high fat breakfast attenuates the suppression of appetite and acylated ghrelin during exercise at1
simulated altitude.
2
Authors names: Jamie Matu,1 Kevin Deighton,1 Theocharis Ispoglou,1 Oliver M Shannon,1 and Lauren
3
Duckworth1
4
Department and institution: 1Institute for Sport Physical Activity & Leisure, Leeds Beckett University, Leeds,
5
United Kingdom
6
Running heading: Changes in appetite after a high fat and a high carbohydrate breakfast at simulated altitude
7
Corresponding author: J. Matu, Carnegie Research Institute Room 104, Institute for Sport Physical Activity &
8
Leisure, Leeds Beckett University, Leeds, LS6 3QS, United Kingdom (email: [email protected])
9
Emails: Jamie Matu: [email protected]; Kevin Deighton: [email protected]; Theocharis
10
Ispoglou: [email protected]; Oliver M Shannon [email protected]; Lauren
11
Duckworth: [email protected]
12
Telephone number: +44 (0)113 8123603
13
2
Abstract16
High-altitude exposure induces a negative energy balance by increasing resting energy expenditure and decreasing
17
energy intake. This diminished energy intake is likely caused by altitude-induced anorexia and can have
18
detrimental effects for those travelling to high-altitude. We aimed to investigate whether altering the
19
macronutrient composition of breakfast could attenuate altitude-induced anorexia and augment energy intake at
20
high-altitude. Twelve healthy men (aged 26 (8) years, body mass index 23.9 (2.7) kg·m-2) completed two, 305
21
minute experimental trials at 4300m simulated altitude (~11.7% O2). After an overnight fast, participants entered
22
a normobaric hypoxic chamber and rested for one hour, before receiving either a high fat (HF; 60% fat, 25%
23
carbohydrate) or an isocaloric high carbohydrate (HC; 60% carbohydrate, 25% fat) breakfast. One hour after
24
breakfast, participants performed 60 minutes of treadmill walking at 50% of relative V̇O2max. An ad-libitum buffet
25
meal was consumed 1h 30 minutes after exercise. Appetite perceptions, blood samples and substrate oxidation
26
rates were measured throughout. A significantly higher area under the curve for composite appetite score was
27
observed during exercise in HF (40 (12) mm·h-1) compared with HC (30 (17) mm·h-1, P=0.036). During exercise,
28
lower insulin concentrations (P=0.013) and elevated acylated ghrelin concentrations (P=0.048) were observed in
29
HF compared with HC. After exercise there was no significant difference in composite appetite score (P=0.356),
30
acylated ghrelin (P=0.229) or insulin (P=0.513) between conditions. Energy intake at the buffet did not
31
significantly differ between conditions (P=0.384). A HF breakfast attenuated appetite suppression during exercise
32
at 4300m simulated altitude, however ad-libitum energy intake did not increase.
33
Key words: Hypoxia; Medium-chain fatty acids; Energy balance; Altitude-induced anorexia
34
3
1 Introduction49
Appetite suppression has previously been observed during acute exposure to both simulated [1-3] and terrestrial
50
altitude [4]. This effect appears to be maintained during chronic altitude exposures [5, 6] which is associated with
51
significant decreases in energy intake [7, 8], body mass [7-9] and physical performance at altitude [9, 10].
52
Additionally, resting energy expenditure is suggested to be elevated at altitude [1, 11], which may further stimulate
53
a negative energy balance. Maintaining energy balance is therefore vital for individuals ascending to altitude to
54
maintain body mass and physical capabilities.
55
Previous research at sea level has identified that acute dietary interventions can alter postprandial gut
56
hormone responses [12, 13] and subsequent energy intake [14, 15]. It is well established that protein is the most
57
satiating macronutrient [16, 17]. Contrastingly, high fat meals have been found to produce the smallest magnitude
58
of postprandial acylated ghrelin suppression and the highest appetite scores, compared with other macronutrients
59
[12, 13, 18, 19]. Ghrelin is a 28 amino acid peptide which is post-translationally modified at its serine 3 residue
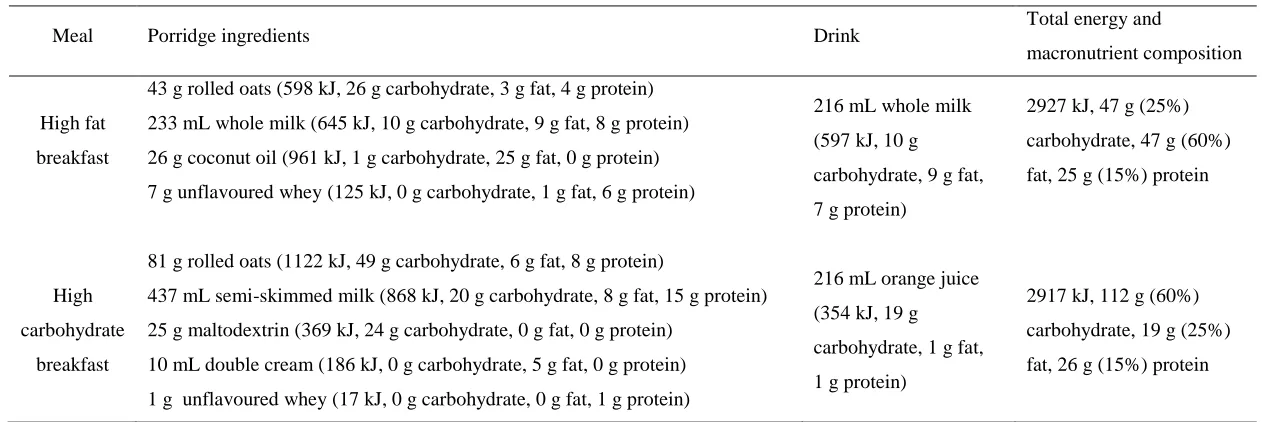
60
with medium-chain fatty acids (MCFAs), catalysed by the enzyme Ghrelin-O-Acyl-Transferase (GOAT) [20, 21].
61
This acylation of ghrelin is necessary for it to bind with the growth hormone secretagogue receptor-1a (GHS-R1a)
62
and exert its orexigenic effects [22]. Furthermore, des-acylated ghrelin has been found to inhibit the orexigenic
63
effects of acylated ghrelin, independently of the GHS-R1a [23]. A growing body of evidence suggests that
64
ingested MCFAs are directly utilised in the acylation of ghrelin, increasing circulating concentrations of acylated
65
ghrelin [24, 25]. This effect can increase appetite and has been found to promote a positive energy balance,
66
preventing weight loss in cachectic patients [26]. In addition, compared with other macronutrients, high fat meals
67
may result in a decreased energy expenditure due to their lower thermic effect [27].
68
Several circulating hormones have been implicated in the development of altitude-induced anorexia,
69
including glucagon-like peptide-1, peptide YY and pancreatic polypeptide. However, recent studies have
70
identified acylated ghrelin as the strongest mediator of this response based on concomitant decreases of appetite
71
and circulating acylated ghrelin concentrations at altitude [1, 2, 28]. It seems plausible that the ingestion of a high
72
fat meal rich in MCFAs may increase circulating acylated ghrelin concentrations, elevate subjective appetite
73
ratings, augment energy intake and decrease energy expenditure. A combination of these factors over a prolonged
74
period would be beneficial in a high altitude environment by helping to maintain energy balance and body mass.
75
The purpose of this study was to compare the effects of a high fat breakfast rich in MCFAs and a high
76
carbohydrate breakfast on appetite, gut hormones, energy intake and substrate oxidation. This study represents
77
the first investigation of an intervention attempting to attenuate reductions in appetite at altitude.
78
4
2 Methods81
2.1 Participants
82
Twelve healthy men (age 26 (8) years, body mass index 23.9 (2.7) kg·m-2, body mass 77 (8.1) kg) volunteered to
83
participate in this study. Informed consent was obtained from all individual participants included in the study. All
84
participants were non-smokers, non-diabetic, normotensive, free from food allergies and were not taking any
85
regular medication. None of the participants had travelled to an altitude >1500m for the previous three months
86
and were currently residing at an altitude of <500m. All study protocols received institutional ethics approval and
87
were performed in accordance with the Declaration of Helsinki.
88
89
2.2 Experimental Design
90
Participants attended the laboratory on four separate occasions. The first visit included screening, anthropometry,
91
a food preferences assessment and a test for sickle cell trait. Sickle cell trait was an exclusion criteria due to
92
complications that may occur in hypoxia, for example splenic infarction [29]. During the second visit participants
93
completed an incremental exercise test at 4300m simulated altitude, to determine a relative treadmill walking
94
speed for subsequent experimental trials, as previously described [1]. In a randomised and counter-balanced
95
fashion, two experimental trials were conducted ≥48h following the incremental exercise test and were separated
96
by ≥7 days. Participants were not informed by the researcher which breakfast they were provided with before or
97
during each trial. During the experimental trials participants consumed either a high fat (HF) or a high
98
carbohydrate (HC) breakfast. Target FiO2 was adjusted on the morning of each testing day using the following
99
equation: FiO2 = PiO2 / (PB - 47); where PB is barometric pressure in mmHg and 47 mmHg is the vapour pressure
100
of water at 37 °C [30, 31]. Simulated PiO2 was 83 mmHg (FiO2 ~11.7%). Temperature and humidity were
101
maintained at 20 °C and 50% for all tests, respectively.
102
103
2.3 Experimental trials
104
Participants recorded their dietary intake on the day prior to their first experimental trial and repeated the quantity
105
and timing of this intake before their second trial. On the day preceding each experimental trial participants also
106
refrained from alcohol, caffeine and strenuous exercise, and consumed a standardised evening meal (4338 kJ,
107
57% carbohydrate, 28% fat, 15% protein) between 7pm and 8pm. This meal contained: fusilli pasta, pasta sauce,
108
cheddar cheese, milk, and jelly beans and was consumed to minimise the possibility of a ‘second meal effect’
109
confounding the outcome measures [32, 33]. Compliance to pre-experimental controls was verbally confirmed
110
with each participant on the morning of each trial. On the day of testing, participants arrived at the laboratory and
111
entered the hypoxic chamber at 8am. At 1h participants were given 15 minutes to consume either a HF (60% fat,
112
25% carbohydrate, 15% protein) or a HC (60% carbohydrate, 25% fat, 15% protein) breakfast (Table 1). Both
113
breakfasts consisted of cooked porridge served in an oversized bowl with a separate drink of 216mL. Participants
114
remained rested (e.g. reading or watching DVDs; material strongly related to the aims of the study was not
115
permitted) throughout both trials with the exclusion of the exercise period. At 2h 15 minutes a 1h exercise protocol
116
5
carrying a 10kg backpack, to mimic the demands of high altitude trekking [34]. Participants then remained rested118
until the end of the trial at 5h 05 minutes. Rating of perceived exertion (RPE) was measured at 15 minute intervals
119
during exercise [35]. Acute mountain sickness (AMS) was measured every 30 minutes via the Lake Louise Score
120
(LLS) [36] and used to diagnose mild AMS (LLS ≥3 in the presence of a headache) and severe AMS (LLS ≥6 in
121
the presence of a headache).
122
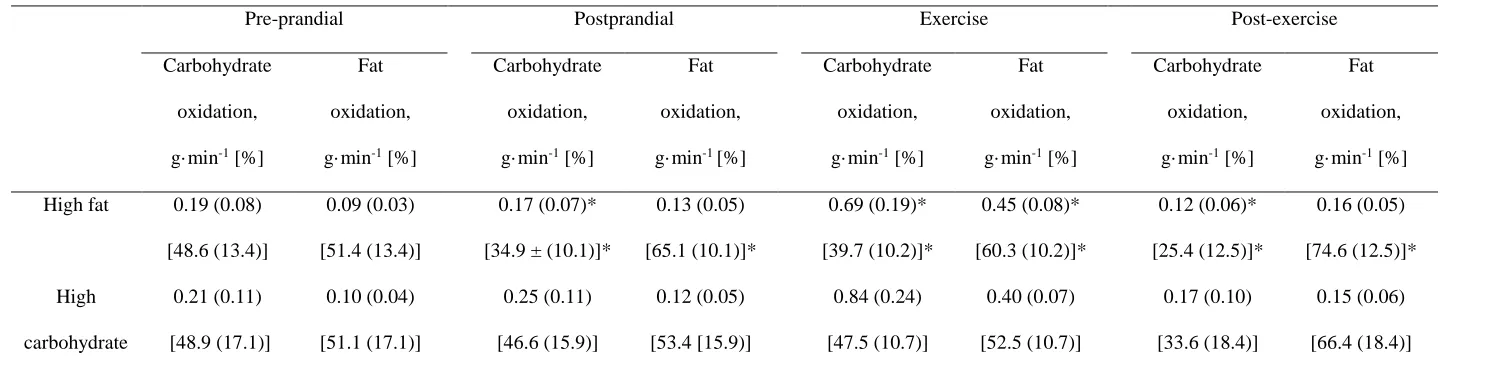
123
2.4 Appetite and palatability perceptions
124
Subjective appetite perceptions were measured at baseline and every 30 minutes throughout each experimental
125
trial, with the exclusion of the 15 minute interval for breakfast consumption. During exercise, subjective appetite
126
perceptions were measured whilst maintaining walking on the treadmill. Validated visual analogue scales (VAS)
127
were used to assess appetite and palatability perceptions [37]. A composite appetite score (CAS) was calculated
128
after inverting the values for fullness and satisfaction [38]. A higher CAS is associated with greater appetite
129
sensations and thus a stronger motivation to eat.
130
131
2.5 Ad-libitum meal
132
At 4h 45 minutes participants were given 20 minute access to a cold ad-libitum meal that was presented identically
133
between trials, and consisted of: three types of cereal, semi-skimmed milk, orange juice, white bread, brown bread,
134
cheese, ham, tuna, bananas, apples, oranges, crisps, butter, margarine, mayonnaise, cereal bars, chocolate bars,
135
cookies, muffins and chocolate rolls. All foods were provided in excess of expected consumption and participants
136
were informed to ‘eat until comfortably full’. Participants were also made aware that additional quantities of each
137
food item were available if desired. Meals were consumed in isolation, inside the hypoxic chamber and behind a
138
privacy screen to minimise any effects of social influence on food intake. Energy intake was calculated by
139
weighing foods before and after consumption (to the nearest 0.1g), and with reference to the manufacturers
140
nutritional information. This ad-libitum meal allowed for macronutrient preferences to be assessed.
141
142
2.6 Online gas analysis
143
Expired gas analysis was conducted throughout trials using an online gas analyser (Metalyser® 3B, Cortex,
144
Leipzig, Germany), as previously described [1]. Substrate oxidation was estimated using equations for rest [39]
145
and exercise [40]. Substrate oxidation rates were then used to estimate energy expenditure at rest and during
146
exercise.
147
148
2.7 Blood sampling
149
All venous blood samples were obtained from an antecubital vein using a 20-gauge cannula (Introcan Safety; B
150
Braun, Sheffield, UK). The first blood sample was collected >10 minutes after the cannulation procedure to
151
6
1h, 2h 15 minutes, 3h 15 minutes, 4h and 4h 45 minutes. From each venous sample a microcuvette and a153
heparinised micro haematocrit tube were used to collect 10 µL and ~45 µL of whole blood, respectively, for the
154
measurement of haemoglobin and haematocrit concentrations. These data were used to estimate plasma volume
155
changes over time [42]. To minimise the effect of any postural changes in plasma volume all blood samples were
156
collected whilst the participant was seated [43]. At each time point samples were collected into one 4.9 mL and
157
one 9 mL pre-cooled EDTA monovette (Sarstedt, Leicester, UK). The 9 mL tube was used for the determination
158
of plasma concentrations of insulin, glucose, lactate, non-esterified fatty acids (NEFA) and triglycerides. The 4.9
159
mL tube was used for the determination of plasma concentrations of acylated and des-acylated ghrelin. To prevent
160
the degradation of acylated ghrelin, 4.9 mL tubes were pre-treated on the morning of each experimental trial, as
161
previously described [1, 44]. Immediately after filling, both tubes were spun at 1500 x g for 10 minutes in a
162
centrifuge (CompactStar CS4, VWR). Plasma from the 9 mL tube was transferred into cryovials and 1 mL of the
163
plasma from the 4.9 mL tube was mixed with 100 µL of 1M hydrochloric acid. This solution was then spun at
164
1500 x g for five minutes before the supernatant was then transferred into cryovials. All cryovials were then
165
immediately frozen at -20 °C before being transferred to -80°C and stored until analysis.
166
167
2.8 Blood Analysis
168
Commercially available enzyme-linked immunosorbent assays were used to determine plasma concentrations of
169
acylated ghrelin (SPI BIO, Montigny Le Bretonneux, France), des-acylated ghrelin (SPI BIO, Montigny Le
170
Bretonneux, France) and insulin (IBL, Hamburg, Germany). To eliminate inter-assay variation, all samples from
171
each participant were assayed on the same plate. Photometic analysis was utilised to measure glucose, lactate,
172
NEFA and triglycerides using reagents from Instrumentation Laboratory (Lexington, MA), Randox Laboratories
173
(Crumlin, UK), Wako Chemicals (Dusseldorf, Germany) and Instrumentation Laboratory (Lexington, MA),
174
respectively. The within batch coefficients of variation were as follows: acylated ghrelin 2.4%, des-acylated
175
ghrelin 4.1%, insulin 5.7%, glucose 3.2%, lactate, 2.8%, NEFA 2.8% and triglycerides 3.7%. Total ghrelin was
176
computed via the addition of acylated and des-acylated ghrelin concentrations.
177
178
2.9 Statistical analysis
179
Data are expressed as mean (SD) in text and tables and mean (SE) in figures to avoid distortion of the graphs. All
180
data were analysed using IBM SPSS statistics (v22.0 for Windows; SPSS, Chicago, IL). Area under the curve
181
(AUC) was calculated using the trapezoid method for appetite perceptions and blood parameters. The four AUC
182
periods were defined as: pre-prandial (the 1h before breakfast), postprandial (the 1h after breakfast), exercise (the
183
1h exercise period), and post-exercise (the 1hr 30 minutes post-exercise). Paired t-tests were used to assess
184
differences in RPE, palatability ratings and energy intake. Two-way repeated measures analysis of variance
185
(ANOVA) was used to assess condition, time, and condition*time based differences in AUC values for appetite
186
perceptions, LLS, blood analyte concentrations, substrate oxidation and energy expenditure. Where significant
187
effects were found, post-hoc analysis was performed using paired t tests. . Analysis of covariance (ANCOVA)
188
was performed on appetite perceptions, blood analyte concentrations and energy intake using LLS as a covariate.
189
7
data are presented. Effect sizes are presented as Cohen’s d and interpreted as ≤ 0.2 trivial, >0.2 small, >0.6191
moderate, >1.2 large, >2 very large and >4 extremely large [45]. Interpretation of all blood analytes was
192
unchanged when plasma volume changes were accounted for, thus the original data is presented. The sample size
193
used was deemed sufficient to detect significant differences in CAS, acylated ghrelin and energy intake between
194
conditions. Based on effect sizes calculated from previous work in our laboratory[1], and an alpha value of 5%, a
195
sample size of 12 participants would generate a power >95% for these three variables. Calculations were
196
8
3 Results198
3.1 Exercise responses and acute mountain sickness
199
Maximal oxygen uptake at 4300m was 39.2 (5.1) mL·kg·min-1 and walking speed was 2.8 (0.6) km·h−1 during the
200
experimental trials. There was no difference in RPE between the HF (12 (2)) and the HC (12 (2), P = 0.467, d =
201
0.08) conditions during exercise. Mild AMS manifested in four and six participants in the HF and HC conditions,
202
respectively. Severe AMS occurred in one and two participants in the HF and HC conditions, respectively.
Two-203
way repeated measures ANOVA revealed a significant effect of time (P = 0.009) on LLS, however no effect of
204
condition (P = 0.313) or condition*time (P = 0.318) was observed. Mean LLS across the entire trial was 1 (2)
205
during the HF and 1 (1) during in HC condition.
206
3.2 Appetite and palatability perceptions
207
Two-way repeated measures ANOVA revealed a significant effect of time (P <0.001) and condition*time (P =
208
0.026), but not condition (P = 0.223) on CAS. Post-hoc analysis revealed at baseline and during the pre-prandial
209
period there were no significant differences in CAS between the HF and HC conditions (all P ≥ 0.218, all d ≤
210
0.31). During exercise AUC for CAS was significantly higher in HF (40 (12) mm·h-1) compared with HC (30 (17)
211
mm·h-1, P = 0.036, d = 0.63). During the post-exercise period there was no significant difference in AUC for CAS
212
between conditions (P = 0.356, d = 0.26) (Figure 1). Two-way ANOVA revealed no significant effects of
213
condition or condition*time for hunger (P ≥ 0.163), satisfaction (P ≥ 0.288) or fullness (P ≥ 0.102). A significant
214
effect of condition*time was observed for prospective food consumption (P = 0.001). Post-hoc analysis revealed
215
significantly higher prospective food consumption in HF, compared with HC, during the post-prandial (P = 0.019,
216
d = 0.92) and exercise (P = 0.016, d = 0.88) periods. There was no difference observed for appeal (P = 0.319, d =
217
0.29), smell (P = 0.507, d = 0.19), taste (P = 0.843, d = 0.06), aftertaste (P = 0.208, d = 0.33) and palatability (P
218
= 0.768, d = 0.09) of the breakfast between conditions (Supplementary Table 1).
219
220
3.3 Energy intake
221
Mean energy intake at the ad-libitum meal was not different after the HF breakfast (5589 (2076) kJ) compared
222
with the HC breakfast (6086 (2235) kJ, P = 0.384, d = 0.23). In addition, there were no differences in the absolute
223
or relative consumption of carbohydrate (both P ≥ 0.731, d ≤ 0.08), fat (both P ≥ 0.348, d ≤ 0.27) or protein (both
224
P ≥ 0.260, d ≤ 0.31) (Supplementary Table 2).
225
226
3.4 Substrate oxidation and energy expenditure
227
Two-way repeated measures ANOVA revealed a significant effect of time, condition and condition*time for
228
relative (all P ≤ 0.038) and absolute (all P ≤ 0.003) carbohydrate oxidation. Post-hoc analysis revealed that during
229
the pre-prandial period, there were no significant differences in relative or absolute carbohydrate and fat oxidation
230
between conditions (all P ≥ 0.105, all d ≤ 0.17). During the postprandial period, exercise and the post-exercise
231
period both relative (all P ≤ 0.012, d ≥ 0.75) and absolute (all P ≤ 0.009, all d ≥ 0.70) carbohydrate oxidation were
232
9
0.003) was observed for absolute fat oxidation, however no effect of condition was revealed (P = 0.111).Post-234
hoc analysis revealed absolute fat oxidation was not significantly different between conditions in the postprandial
235
or the post-exercise period (both P ≥ 0.133, d ≤ 0.26). However, during exercise absolute fat oxidation was
236
significantly higher after the HF breakfast compared with the HC breakfast (P = 0.014, d = 0.76) (Table 2).
237
Two-way repeated measures ANOVA revealed a significant effect of time (P < 0.001) on energy
238
expenditure but not condition*time (P = 0.617). There was however a tendency towards an effect of condition (P
239
= 0.060) on energy expenditure, with lower values observed for total energy expenditure across the entire trial in
240
HF (3635 (561) kJ) compared with HC (3848 (491) kJ.
241
242
3.5 Blood parameters
243
There were no differences between trials for the concentrations of any blood analyte at baseline (all P ≥ 0.137, all
244
d ≤ 0.18).
245
There was a significant main effect of time (P = 0.029) and condition*time (P = 0.002), but not condition
246
(P = 0.100) on acylated ghrelin concentrations. Post-hoc analysis revealed that during the postprandial period
247
AUC for acylated ghrelin tended to be higher after the HF breakfast compared with the HC breakfast (P = 0.069,
248
d = 0.15) (Figure 2A). During exercise AUC for acylated ghrelin was significantly higher after the HF breakfast
249
(151.9 (180.2) pg·mL-1·h-1) compared with the HC breakfast (100.6 (106.1) pg·mL-1·h-1, P = 0.048, d = 0.35).
250
During the post-exercise period, AUC for acylated ghrelin was not significantly different between conditions (P
251
= 0.153, d = 0.14). There was no effect of time (P = 0.857), condition (P = 0.219) or condition*time (P = 0.605)
252
for des-acylated ghrelin concentrations (Figure 2B). Furthermore, there was a tendency for a main effect of
253
condition (P = 0.052), time (P = 0.079) and condition*time (P = 0.089) for total ghrelin concentrations (Figure
254
2C).
255
There was a main effect of time (P = 0.005) and condition*time (0.039), but not condition (P = 0.494)
256
for glucose concentrations. Post-hoc analysis revealed that glucose concentrations tended to be higher and were
257
significantly higher during the postprandial (P = 0.094, d = 0.25) and exercise (P = 0.033, d = 0.37) periods in HC
258
compared with HF. There was no difference in glucose concentrations between conditions in the post-exercise
259
period (P = 0.199, d = 0.32) (Figure 3A). There was a main effect of time (P < 0.001) and condition*time (P <
260
0.001), and a tendency for condition (P = 0.053) for insulin concentrations. Post-hoc analysis revealed that during
261
the postprandial period AUC for insulin was significantly lower in HF (24.9 (16.1) μlU·mL-1·h-1) compared with
262
HC (34.3 (14.2) μlU·mL-1·h-1, P = 0.003, d = 0.62). During exercise AUC for insulin was also lower in HF (27.0
263
(15.9) μlU·mL-1·h-1) compared with HC (39.5 (15.0) μlU·mL-1·h-1, P = 0.013, d = 0.81). There was no difference
264
in AUC for insulin between conditions in the post-exercise period (P = 0.513, d = 0.11) (Figure 3B).
265
There was a main effect of time (P < 0.001), condition (P = 0.002) and condition*time (P = 0.005) for
266
lactate concentrations. Post-hoc analysis revealed that lactate concentrations were significantly lower in the
267
postprandial, exercise and post-exercise periods (all P ≤ 0.011, all d ≥ 0.62) in HF compared with HC (Figure 3C).
268
There was a main effect of condition*time (P = 0.002), a tendency for condition (P = 0.086) and no effect of time
269
10
difference between conditions for concentrations of NEFA (P = 0.553, d = 0.20). However during the exercise271
and post-exercise periods, concentrations of NEFA were significantly higher in HF compared with HC (both P ≤
272
0.047, d ≥ 0.97) (Figure 4A). There was a main effect of time (P < 0.001) and condition*time (P = 0.015), and a
273
trend for an effect of condition (P = 0.052) on triglyceride concentrations. Post-hoc analysis revealed that during
274
the postprandial period there was a tendency for higher triglycerides concentrations in HF compared with HC (P
275
= 0.078, d = 0.73). During the exercise and post-exercise periods triglyceride concentrations were significantly
276
higher in HF compared with HC (both P ≤ 0.049, d ≥ 0.81) (Figure 4B).
277
11
4 Discussion280
This study investigated the effects of a HF and a HC breakfast on changes in appetite perceptions, gut hormones,
281
energy intake and substrate oxidation during a 5h exposure to 4300m simulated altitude. The primary finding of
282
this investigation is that consumption of a HF breakfast, compared with a HC breakfast, resulted in significantly
283
higher CAS and acylated ghrelin concentrations during a subsequent exercise bout. However, this effect was
284
transient and thus did not alter ad-libitum energy intake 1hr 30 minutes after exercise. In addition, absolute and
285
relative carbohydrate oxidation was significantly lower in all periods after the HF breakfast compared with the
286
HC breakfast. This effect produced a trend for a lower total energy expenditure in HF compared with HC.
287
Although AUC for CAS was 31% higher and AUC for acylated ghrelin was 51% higher during exercise
288
in HF compared with HC, no differences were observed in subsequent energy intake. This was likely due to the
289
1hr 30 minute time period between exercise and ad-libitum feeding, in which appetite perceptions and acylated
290
ghrelin concentrations converged between conditions. It seems feasible that a difference in energy intake may
291
have been observed if ad-libitum feeding was administered immediately after exercise and future research is
292
warranted in this respect. This future research could hold ecologically validity, as trekking at terrestrial altitude is
293
often followed immediately by a meal, e.g. a stop for lunch. Furthermore, the increased appetite in the present
294
study during exercise in HF may have increased ad-libitum feeding during exercise, had foods been made
295
available. This could increase energy intake at terrestrial altitude as snacks are usually available during trekking.
296
The appetite responses in the present study corroborate the findings of similar investigations at sea level.
297
Monteleone, Bencivenga [47] observed that a 77% carbohydrate meal suppressed hunger to a significantly greater
298
extent than a 75% fat meal. Furthermore, previous data has suggested that a high carbohydrate meal induces a
299
greater decrease in postprandial ghrelin concentrations than an isocaloric high fat meal [12, 18, 47]. Previous
300
research shows that this larger postprandial decrease in appetite and plasma ghrelin concentrations, begins to
301
manifest approximately 60 minutes after food ingestion [12, 18, 47], which coincided with the start of exercise in
302
the present study. Therefore, it is possible that the observed differences in appetite and plasma acylated ghrelin
303
concentrations during exercise may be attributable to nutrient transit through the gastrointestinal tract over time,
304
rather than being induced by exercise.
305
The findings of the present study suggest a possible role of insulin in postprandial appetite suppression
306
at altitude. Insulin has been shown to suppress appetite and food intake via signalling in the hypothalamus [48]
307
and it seems feasible that the larger insulin response following the HC breakfast in the present study may have
308
contributed to the significantly lower appetite perceptions compared with HF. In addition, the higher postprandial
309
insulin concentration in the HC condition could have influenced appetite indirectly by contributing to the larger
310
suppression of acylated ghrelin, compared with the HF condition [49-51]. Without dietary intervention, acylated
311
ghrelin appears to be more strongly associated with altitude-induced anorexia than circulating insulin
312
concentrations [1]. Subsequently it seems reasonable to suggest that changes in CAS in the present study may
313
have been mediated predominantly by the acylated ghrelin responses, as opposed to changes in insulin
314
concentrations. This is the first study to directly influence acylated ghrelin concentrations at simulated altitude
315
via dietary intervention, and this elevation of acylated ghrelin concentrations during exercise resulted in a
316
simultaneous elevation of CAS. This strengthens the concept of a causal relationship between circulating acylated
317
12
studies have found ghrelin infusion to decrease satiety [52], increase hunger [53-55] and increase energy intake319
[55, 56] in a variety of populations.
320
The high-fat breakfast provided within the current study was rich in coconut oil, a foodstuff known for
321
high concentrations of MCFAs [57]. It seems plausible that the significantly higher acylated ghrelin
322
concentrations after the HF breakfast may be due to an increased availability of MCFAs as a substrate for GOAT
323
[24], which is supported by the elevated NEFA and triglyceride concentrations in the present study. This
324
speculation is corroborated by evidence that ingested MCFAs are directly utilised in the acyl modification of
325
ghrelin in rodents [24]. Substantiating this, others have found MCFA ingestion increases circulating acylated
326
ghrelin concentrations in ruminants [58], piglets [59] and cachectic patients [26]. Additionally, following a meal,
327
neural signals are produced from the gastrointestinal tract which represent direct post-ingestive satiety signals,
328
outlined in the satiety cascade [60]. It may be possible that circulating glucose elicits more potent satiating neural
329
signals compared with circulating free fatty acids at altitude.
330
Entire trial energy expenditure tended to be lower after the HF breakfast compared with the HC breakfast.
331
This phenomenon would be beneficial in minimising an altitude-induced negative energy balance, potentially
332
aiding the maintenance of body composition at altitude, were it to persist. The thermic effect of food is reported
333
to be 0–3% and 5–10% of the caloric content of the fat and carbohydrate administered [27], supporting the lower
334
energy expenditure after the HF breakfast, compared with the HC breakfast. Interestingly we found that, whilst
335
resting, absolute fat oxidation rate remained unchanged between conditions and absolute carbohydrate oxidation
336
was lower after the HF breakfast, explaining the lower energy expenditure in the HF condition. The higher
337
absolute carbohydrate oxidation observed after the HC breakfast aligns with the simultaneously higher lactate
338
concentrations, which substantiates previous data at sea level [61]. This is likely the result of an increased
339
glycolytic flux in the HC condition producing a higher rate of lactate production, and thus plasma lactate
340
concentrations. Recent research has demonstrated an increased reliance on fat oxidation during acute exposure to
341
altitude compared with a matched sea level condition in fed individuals at rest [1] and during exercise [1, 62]. The
342
current study demonstrated that, although reliance on fat as a substrate was already high due to acute hypoxic
343
exposure, feeding with a HF breakfast further increased relative reliance on fat up to 74.6 (12.5)% in the
344
postprandial stage.
345
Despite the novel findings observed in the present study, some notable limitations must be
346
acknowledged. Firstly, the hypoxic exposure was relatively short and it is possible that acylated ghrelin and CAS
347
may respond differently over a longer period of time. It seems feasible that the consumption of additional high fat
348
meals during more prolonged exposure may produce additional smaller magnitudes of postprandial acylated
349
ghrelin suppression compared with high carbohydrate meals and this area warrants further research. In addition,
350
tightly controlled laboratory studies of this nature are valuable to gain mechanistic understanding and provide a
351
proof of concept but these findings require application in further field studies to assess the effects of high fat
352
feeding when combined with the effects of trekking, gradual ascent and other environmental stimuli (e.g. cold
353
exposure) which occur during real life ascent to high-altitude. It is not possible to attribute the findings of the
354
present study to high fat feeding, or MCFAs per se. In order to make this distinction a control high-fat breakfast
355
would be necessary containing minimal amounts of MCFAs, this is a potential area for further research.
356
13
suppression of appetite occurred. However, in our laboratory we have previously observed significantaltitude-358
induced appetite, acylated ghrelin and energy intake suppression using an extremely similar population and
359
protocol at the same altitude [1]. Therefore it seems likely that participants were suffering appetite suppression as
360
a result of altitude exposure. Finally, human energy balance is regulated by a complex multifaceted system.
361
Although the current study shows an augmentation of appetite after consuming a high fat breakfast, it is overly
362
simplistic to attribute all of the findings to a single gut hormone. Further research is needed to provide a full
363
mechanistic explanation of these findings. In conclusion, the consumption of a high fat breakfast at 4300m
364
simulated altitude attenuated the suppression of CAS and acylated ghrelin during subsequent exercise. However,
365
this was transient and had no effect on energy intake at an ad-libitum meal provided 1hr 30 minutes after exercise.
366
In addition, high fat feeding resulted in a lower energy expenditure during the five hour trial in comparison with
367
high carbohydrate feeding. It seems plausible that a combination of these factors would help to maintain energy
368
balance at altitude, however further research would be beneficial to establish whether energy intake can be
369
augmented at altitude.
370
14
Acknowledgements372
We would like to thank all of the volunteers who participated in this study. We would also like to thank Leah
373
Boullier, Milton Holt, Becky Price, Georgia Head and Timothy Keitaro for their help with the study.
374
375
Funding
376
This research did not receive any specific grant from funding agencies in the public, commercial, or
377
not-for-profit sectors.
378
15
Table 1. Characteristics of the breakfasts380
Meal Porridge ingredients Drink Total energy and
macronutrient composition
High fat
breakfast
43 g rolled oats (598 kJ, 26 g carbohydrate, 3 g fat, 4 g protein)
233 mL whole milk (645 kJ, 10 g carbohydrate, 9 g fat, 8 g protein)
26 g coconut oil (961 kJ, 1 g carbohydrate, 25 g fat, 0 g protein)
7 g unflavoured whey (125 kJ, 0 g carbohydrate, 1 g fat, 6 g protein)
216 mL whole milk
(597 kJ, 10 g
carbohydrate, 9 g fat,
7 g protein)
2927 kJ, 47 g (25%)
carbohydrate, 47 g (60%)
fat, 25 g (15%) protein
High
carbohydrate
breakfast
81 g rolled oats (1122 kJ, 49 g carbohydrate, 6 g fat, 8 g protein)
437 mL semi-skimmed milk (868 kJ, 20 g carbohydrate, 8 g fat, 15 g protein)
25 g maltodextrin (369 kJ, 24 g carbohydrate, 0 g fat, 0 g protein)
10 mL double cream (186 kJ, 0 g carbohydrate, 5 g fat, 0 g protein)
1 g unflavoured whey (17 kJ, 0 g carbohydrate, 0 g fat, 1 g protein)
216 mL orange juice
(354 kJ, 19 g
carbohydrate, 1 g fat,
1 g protein)
2917 kJ, 112 g (60%)
carbohydrate, 19 g (25%)
fat, 26 g (15%) protein
16
Table 2. Absolute and relative contributions of carbohydrate and fat oxidation in the high fat and high carbohydrate trials.390
Pre-prandial Postprandial Exercise Post-exercise
Carbohydrate
oxidation,
g·min-1 [%]
Fat
oxidation,
g·min-1 [%]
Carbohydrate
oxidation,
g·min-1 [%]
Fat
oxidation,
g·min-1 [%]
Carbohydrate
oxidation,
g·min-1 [%]
Fat
oxidation,
g·min-1 [%]
Carbohydrate
oxidation,
g·min-1 [%]
Fat
oxidation,
g·min-1 [%]
High fat 0.19 (0.08)
[48.6 (13.4)]
0.09 (0.03)
[51.4 (13.4)]
0.17 (0.07)*
[34.9 ± (10.1)]*
0.13 (0.05)
[65.1 (10.1)]*
0.69 (0.19)*
[39.7 (10.2)]*
0.45 (0.08)*
[60.3 (10.2)]*
0.12 (0.06)*
[25.4 (12.5)]*
0.16 (0.05)
[74.6 (12.5)]*
High
carbohydrate
0.21 (0.11)
[48.9 (17.1)]
0.10 (0.04)
[51.1 (17.1)]
0.25 (0.11)
[46.6 (15.9)]
0.12 (0.05)
[53.4 [15.9)]
0.84 (0.24)
[47.5 (10.7)]
0.40 (0.07)
[52.5 (10.7)]
0.17 (0.10)
[33.6 (18.4)]
0.15 (0.06)
[66.4 (18.4)]
Values are mean (SD), N = 12. % is percentage of energy yield. * Significantly (P < 0.05) different to high carbohydrate condition.
391
17
Supplementary Table 1. Palatability perceptions after the high fat and high carbohydrate breakfasts393
Appeal, mm Smell, mm Taste, mm Aftertaste, mm Palatability, mm
High fat 32 (17) 31 (16) 36 (25) 47 (26) 35 (23)
High
carbohydrate 38 (22) 35 (17) 34 (22) 56 (26) 37 (20)
Values are mean (SD), N = 12.
394
18
Supplementary Table 2. Macronutrient intakes at the ad-libitum meal in the high fat and high carbohydrate397
conditions.
398
Carbohydrate, g [%]
Fat, g [%]
Protein, g [%]
High fat 155 (57)
[48 (11)]
59 (29) [39 (11)]
42 (19) [13 (2)]
High carbohydrate 160 (62) [47 (15)]
68 (34) [40 (14)]
48 (20) [13 (3)]
Values are mean (SD), N = 12.
399
19
References402
1. Matu J, Deighton K, Ispoglou T, Duckworth L. The effect of moderate versus severe simulated altitude
403
on appetite, gut hormones, energy intake and substrate oxidation in men. Appetite. 2017;113:284-92.
404
405
2. Wasse LK, Sunderland C, King JA, Batterham RL, Stensel DJ. Influence of rest and exercise at a
406
simulated altitude of 4,000 m on appetite, energy intake, and plasma concentrations of acylated ghrelin and
407
peptide YY. J Appl Physiol. 2012;112:552-9.
408
409
3. Westerterp-Plantenga MS, Westerterp KR, Rubbens M, Verwegen CR, Richelet JP, Gardette B.
410
Appetite at "high altitude" [Operation Everest III (Comex-'97)]: a simulated ascent of Mount Everest. J Appl
411
Physiol. 1999;87:391-9.
412
413
4. Aeberli I, Erb A, Spliethoff K, Meier D, Gotze O, Fruhauf H, et al. Disturbed eating at high altitude:
414
influence of food preferences, acute mountain sickness and satiation hormones. Eur J Nutr. 2013;52:625-35.
415
416
5. Major GC, Doucet E. Energy intake during a typical Himalayan trek. High Alt Med Biol.
417
2004;5(3):355-63.
418
419
6. Armellini F, Zamboni M, Robbi R, Todesco T, Bissoli L, Mino A, et al. The effects of high altitude
420
trekking on body composition and resting metabolic rate. Horm Metab Res. 1997;29:458-61.
421
422
7. Rose MS, Houston CS, Fulco CS, Coates G, Sutton JR, Cymerman A. Operation Everest. II: Nutrition
423
and body composition. J Appl Physiol. 1988;65:2545-51.
424
425
8. Pulfrey SM, Jones PJ. Energy expenditure and requirement while climbing above 6,000 m. J Appl
426
Physiol. 1996;81:1306-11.
427
428
9. Sergi G, Imoscopi A, Sarti S, Perissinotto E, Coin A, Inelmen EM, et al. Changes in total body and
429
limb composition and muscle strength after a 6-8 weeks sojourn at extreme altitude (5000-8000 m). J Sports
430
Med Phys Fit. 2010;50:450-5.
431
432
10. Hoppeler H, Vogt M. Muscle tissue adaptations to hypoxia. J Exp Biol. 2001;204:3133-9.
433
434
11. Westerterp KR, Kayser B, Wouters L, Le Trong JL, Richalet JP. Energy balance at high altitude of
435
6,542 m. J Appl Physiol. 1994;77:862-6.
436
437
12. Foster-Schubert KE, Overduin J, Prudom CE, Liu J, Callahan HS, Gaylinn BD, et al. Acyl and Total
438
Ghrelin Are Suppressed Strongly by Ingested Proteins, Weakly by Lipids, and Biphasically by Carbohydrates. J
439
Clin Endoc Metab. 2008;93:1971-9.
440
13. El Khoury D, El-Rassi R, Azar S, Hwalla N. Postprandial ghrelin and PYY responses of male subjects
441
on low carbohydrate meals to varied balancing proportions of proteins and fats. Eur J Nutr. 2010;49:493-500.
442
443
14. Bowen J, Noakes M, Trenerry C, Clifton PM. Energy intake, ghrelin, and cholecystokinin after
444
different carbohydrate and protein preloads in overweight men. J Clin Endoc Metab. 2006;91:1477-83.
445
446
15. Porrini M, Crovetti R, Testolin G, Silva S. Evaluation of Satiety Sensations and Food Intake After
447
Different Preloads. Appetite. 1995;25:17-30.
448
449
16. Stubbs RJ. Nutrition Society Medal Lecture. Appetite, feeding behaviour and energy balance in human
450
subjects. Proc Nutr Soc. 1998;57:341-56.
451
452
17. Tome D. Protein, amino acids and the control of food intake. The British journal of nutrition.
453
2004;92:27-30.
454
455
18. Tannous dit El Khoury D, Obeid O, Azar ST, Hwalla N. Variations in postprandial ghrelin status
456
following ingestion of high-carbohydrate, high-fat, and high-protein meals in males. Annals Nutr Metab.
457
20
19. Hopkins M, Gibbons C, Caudwell P, Blundell JE, Finlayson G. Differing effects of fat orhigh-459
carbohydrate meals on food hedonics in overweight and obese individuals. British J Nutr. 2016;115:1875-84.
460
461
20. Yang J, Brown MS, Liang G, Grishin NV, Goldstein JL. Identification of the acyltransferase that
462
octanoylates ghrelin, an appetite-stimulating peptide hormone. Cell. 2008;132:387-96.
463
464
21. Kojima M, Hamamoto A, Sato T. Ghrelin O-acyltransferase (GOAT), a specific enzyme that modifies
465
ghrelin with a medium-chain fatty acid. J Biochem. 2016;160:189-94.
466
467
22. Kojima M, Hosoda H, Date Y, Nakazato M, Matsuo H, Kangawa K. Ghrelin is a
growth-hormone-468
releasing acylated peptide from stomach. Nature. 1999;402:656-60.
469
470
23. Fernandez G, Cabral A, Cornejo MP, De Francesco PN, Garcia-Romero G, Reynaldo M, et al.
Des-471
Acyl Ghrelin Directly Targets the Arcuate Nucleus in a Ghrelin-Receptor Independent Manner and Impairs the
472
Orexigenic Effect of Ghrelin. J Neuroendoc. 2016;28:12349.
473
474
24. Nishi Y, Hiejima H, Hosoda H, Kaiya H, Mori K, Fukue Y, et al. Ingested medium-chain fatty acids
475
are directly utilized for the acyl modification of ghrelin. Endocrinology. 2005;146:2255-64.
476
477
25. Lemarie F, Beauchamp E, Legrand P, Rioux V. Revisiting the metabolism and physiological functions
478
of caprylic acid (C8:0) with special focus on ghrelin octanoylation. Biochimie. 2016;120:40-8.
479
480
26. Ashitani J-i, Matsumoto N, Nakazato M. Effect of octanoic acid-rich formula on plasma ghrelin levels
481
in cachectic patients with chronic respiratory disease. Nutr J. 2009;8(1):25.
482
483
27. Acheson KJ. Influence of autonomic nervous system on nutrient-induced thermogenesis in humans.
484
Nutr. 1993;9(4):373-80.
485
486
28. Bailey DP, Smith LR, Chrismas BC, Taylor L, Stensel DJ, Deighton K, et al. Appetite and gut
487
hormone responses to moderate-intensity continuous exercise versus high-intensity interval exercise, in
488
normoxic and hypoxic conditions. Appetite. 2015;89:237-45.
489
490
29. Goodman J, Hassell K, Irwin D, Witkowski EH, Nuss R. The splenic syndrome in individuals with
491
sickle cell trait. High Alt Med Biol. 2014;15(4):468-71.
492
493
30. Fenn WO, Rahn H, Otis AB. A theoretical study of the composition of the alveolar air at altitude. Am J
494
Physiol. 1946;146:637-53.
495
496
31. Conkin J. PH2O and simulated hypobaric hypoxia. Aviat Sp Environ Med. 2011;82:1157-8.
497
498
32. Stevenson E, Williams C, Nute M, Swaile P, Tsui M. The effect of the glycemic index of an evening
499
meal on the metabolic responses to a standard high glycemic index breakfast and subsequent exercise in men.
500
Int J Sport Nutr Ex Metab. 2005;15:308-22.
501
502
33. Wolever TM, Jenkins DJ, Ocana AM, Rao VA, Collier GR. Second-meal effect: low-glycemic-index
503
foods eaten at dinner improve subsequent breakfast glycemic response. Am J Clin Nutr. 1988;48:1041-7.
504
505
34. Mellor A, Bakker-Dyos J, Howard M, Boos C, Cooke M, Vincent E, et al. British Services Dhaulagiri
506
Medical Research Expedition: A unique military/civilian research collaboration. J Royal Army Med Corps. In
507
Press.
508
509
35. Borg GA. Psychophysical bases of perceived exertion. Med Sci Sports Exercise. 1982;14:377-81.
510
511
36. Roach RC, Bärtsch P, Oelz O, Hackett PH. The Lake Louise acute mountain sickness scoring system. .
512
In: Sutton JR, Houston CS, Goates G, editors. Hypoxia and Molecular Medicine. Burlington, VT: Queens City
513
Press 1993. pp. 272-4.
514
515
37. Flint A, Raben A, Blundell JE, Astrup A. Reproducibility, power and validity of visual analogue scales
516
in assessment of appetite sensations in single test meal studies. Int J Obes Relat Metab Disord. 2000;24:38-48.
517
21
38. Stubbs RJ, Hughes DA, Johnstone AM, Rowley E, Reid C, Elia M, et al. The use of visual analogue519
scales to assess motivation to eat in human subjects: a review of their reliability and validity with an evaluation
520
of new hand-held computerized systems for temporal tracking of appetite ratings. Brit J Nutr. 2000;84:405-15.
521
522
39. Frayn KN. Calculation of substrate oxidation rates in vivo from gaseous exchange. J Appl Physiol.
523
1983;55:628-34.
524
525
40. Jeukendrup AE, Wallis GA. Measurement of substrate oxidation during exercise by means of gas
526
exchange measurements. Int J Sports Med. 2005;26:28-37.
527
528
41. Date Y. The Vagus Nerve and Ghrelin Function. In: Portelli J, Smolders I, editors. Central Functions of
529
the Ghrelin Receptor. New York, NY: Springer New York; 2014. pp. 53-61.
530
531
42. Dill DB, Costill DL. Calculation of percentage changes in volumes of blood, plasma, and red cells in
532
dehydration. J Appl Physiol. 1974;37:247-8.
533
534
43. Fawcett JK, Wynn V. Effects of posture on plasma volume and some blood constituents. J Clin Pathol.
535
1960;13:304-10.
536
537
44. Hosoda H, Doi K, Nagaya N, Okumura H, Nakagawa E, Enomoto M, et al. Optimum collection and
538
storage conditions for ghrelin measurements: octanoyl modification of ghrelin is rapidly hydrolyzed to desacyl
539
ghrelin in blood samples. Clin Chem. 2004;50:1077-80.
540
541
45. Hopkins WG. How to interpret changes in an athletic performance test. Sportscience. 2004; 8:1–7.
542
543
46. Faul F, Erdfelder E, Lang AG, Buchner A. G*Power 3: a flexible statistical power analysis program for
544
the social, behavioral, and biomedical sciences. Behav Res Methods. 2007;39:175-91.
545
546
47. Monteleone P, Bencivenga R, Longobardi N, Serritella C, Maj M. Differential responses of circulating
547
ghrelin to high-fat or high-carbohydrate meal in healthy women. J Clin Endoc Metab. 2003;88:5510-4.
548
549
48. Scherer T, Buettner C. Yin and Yang of hypothalamic insulin and leptin signaling in regulating white
550
adipose tissue metabolism. Rev Endoc Metab Disord. 2011;12:235-43.
551
552
49. Leonetti F, Iacobellis G, Ribaudo MC, Zappaterreno A, Tiberti C, Iannucci CV, et al. Acute insulin
553
infusion decreases plasma ghrelin levels in uncomplicated obesity. Regul Pept. 2004;122:179-83.
554
555
50. Saad MF, Bernaba B, Hwu CM, Jinagouda S, Fahmi S, Kogosov E, et al. Insulin regulates plasma
556
ghrelin concentration. J Clin Endoc Metab. 2002;87:3997-4000.
557
558
51. Anderwald C, Brabant G, Bernroider E, Horn R, Brehm A, Waldhausl W, et al. Insulin-dependent
559
modulation of plasma ghrelin and leptin concentrations is less pronounced in type 2 diabetic patients. Diabetes.
560
2003;52:1792-8.
561
562
52. Vestergaard ET, Hansen TK, Gormsen LC, Jakobsen P, Moller N, Christiansen JS, et al. Constant
563
intravenous ghrelin infusion in healthy young men: clinical pharmacokinetics and metabolic effects. Am J
564
Physiol. 2007;292:1829-36.
565
566
53. Druce MR, Wren AM, Park AJ, Milton JE, Patterson M, Frost G, et al. Ghrelin increases food intake in
567
obese as well as lean subjects. Int J Obes. 2005;29:1130-6.
568
569
54. Schmid DA, Held K, Ising M, Uhr M, Weikel JC, Steiger A. Ghrelin stimulates appetite, imagination
570
of food, GH, ACTH, and cortisol, but does not affect leptin in normal controls. Neuropsychopharmacology.
571
2005;30:1187-92.
572
573
55. Wren AM, Seal LJ, Cohen MA, Brynes AE, Frost GS, Murphy KG, et al. Ghrelin enhances appetite
574
and increases food intake in humans. J Clin Endoc Metab. 2001;86:5992.
575
22
56. Neary NM, Small CJ, Wren AM, Lee JL, Druce MR, Palmieri C, et al. Ghrelin increases energy intake577
in cancer patients with impaired appetite: acute, randomized, placebo-controlled trial. J Clin Endoc Metab.
578
2004;89:2832-6.
579
580
57. Babu AS, Veluswamy SK, Arena R, Guazzi M, Lavie CJ. Virgin coconut oil and its potential
581
cardioprotective effects. Postgrad Med J. 2014 Nov;126:76-83.
582
583
58. Fukumori R, Sugino T, Shingu H, Moriya N, Kobayashi H, Hasegawa Y, et al. Ingestion of medium
584
chain fatty acids by lactating dairy cows increases concentrations of plasma ghrelin. Domest Anim Endoc.
585
2013;45:216-23.
586
587
59. Zhang H, Li Y, Hou X, Zhang L, Wang T. Medium-chain TAG improve energy metabolism and
588
mitochondrial biogenesis in the liver of intra-uterine growth-retarded and normal-birth-weight weanling piglets.
589
Brit J Nutr. 2016;115:1521-30.
590
591
60. Blundell J. Pharmacological approaches to appetite suppression. Trends In Pharmacological Sciences.
592
1991;12:147-57.
593
594
61. Surina DM, Langhans W, Pauli R, Wenk C. Meal composition affects postprandial fatty acid oxidation.
595
Am J Physiol. 1993;264:1065-70.
596
597
62. O'Hara JP, Woods DR, Mellor A, Boos C, Gallagher L, Tsakirides C, et al. A comparison of substrate
598
oxidation during prolonged exercise in men at terrestrial altitude and normobaric normoxia following the
599
coingestion of 13C glucose and 13C fructose. Physiol Rep. 2017; doi: 10.14814/phy2.13101
600
23
Figure Legends605
Figure 1. Composite appetite score in the high fat (solid line) and high carbohydrate (dashed line) trials
606
expressed as mean (SE), N = 12. Thin upward arrow represents breakfast and thick upward arrow represents
ad-607
libitum meal. Black rectangle represents exercise.
608
Figure 2. Acylated ghrelin (A), des-acylated ghrelin (B) and total ghrelin (C) concentrations in the high fat
609
(solid line) and high carbohydrate (dashed line) trials expressed as mean (SE), N = 12. Thin upward arrow
610
represents breakfast and thick upward arrow represents ad-libitum meal. Black rectangle represents exercise.
611
Figure 3. Glucose (A), insulin (B) and lactate (C) concentrations in the high fat (solid line) and high
612
carbohydrate (dashed line) trials expressed as mean (SE), N = 12. Thin upward arrow represents breakfast and
613
thick upward arrow represents ad-libitum meal. Black rectangle represents exercise.
614
Figure 4. Non-esterified fatty acids (A) and triglycerides (B) concentrations in the high fat (solid line) and high
615
carbohydrate (dashed line) trials expressed as mean (SE), N = 12. Thin upward arrow represents breakfast and
616