© Associated Asia Research Foundation (AARF)
A Monthly Double-Blind Peer Reviewed Refereed Open Access International e-Journal - Included in the International Serial Directories.
Page | 42
CONSTRUCTION OF TYPE C BEHAVIOR PATTERN SCALE
Mili. M
Research Scholar in Psychology ,
Kerala University Library,University of Kerala
Dr. Rakhee. A. S
Assistant Professor in Psychology,
Sreenarayana College, Chempazanthy
ABSTRACT
This paper explains the construction of a scale for research purposes to assess Type C behaviour
pattern. There were sixty eight on the questionnaire which was administered to 151 adults of
ages between 18 and 70 years. Factor analysis was applied for data reduction. Cronbach’s
alpha was computed as 0.868. The length of the scale was reduced to 14 items based on
non-significance at 0.05 level of the correlations between the scores. A panel of 10 experts
established content validity and 14 items extracted were retained. Concurrent validity was found
to be very high when it was correlated with Emotional Regulation questionnaire (ERQ). The
predictive validity was established with PHQ-9 and the scale predicts the incidence of
depression in individuals.
Keywords: Type C behavior pattern, construction, factor analysis
International Research Journal of Human Resources and Social Sciences
ISSN(O): (2349-4085) ISSN(P): (2394-4218) Impact Factor- 5.414, Volume 5, Issue 03, March 2018
Website- www.aarf.asia, Email : [email protected] , [email protected]
© Associated Asia Research Foundation (AARF)
A Monthly Double-Blind Peer Reviewed Refereed Open Access International e-Journal - Included in the International Serial Directories.
Page | 43 Introduction
History of Personality testing: Personality assessment was largely influenced by the work of Sigmund Freud. 'The interpretation of Dreams' by Freud published in 1990 is considered one of
the influential works in understanding the psychological factors of personality. Neo Freudians
like Carl Jung, Erik Erikson, Alfred Adler also contributed to the understanding the complex
processes in personality. One of the earliest Personality assessment was devised by Carl Jung,
the automated word association test. This work influenced the development of many personality
tests including Myers Briggs Type Indicator.
In the early 20th century, less empirical forms of personality tests began to surface. It was after
the World War I, the personality testing entered into the phase of modern assessment. Robert
Woodworth was commissioned by United States army to develop an instrument to measure the
emotional stability of the Army recruits. He created a questionnaire which consisted of 116 yes
or no questions. Though his measure had psychometric ability, the face validity of the test
allowed 'faking bad' or 'faking good'. By addressing this issue, Louis Thurstone in 1930
developed Thurstone Personality Schedule to assess neurotic symptoms in civilian and army
men. During this time, Projective assessments of personality with credible psychometric like
Rorsharch Inkblots technique, Thematic Apperception Test were also created. By the end of the
20th century various theories of personality and assessments were taken into shape.
Type theories of Personality: The earliest known theory of personality is that of the Greek physician Hippocrates (c. 400 B.C.), who explained four temperaments namely: sanguine,
phlegmatic, melancholic and choleric. The amount of each humor determined the individual
personalities. Hippocrates' system remained influential in Western Europe throughout the medieval and Renaissance periods. The theory of temperaments is among a variety of systems
that deal with human personality by dividing it into types. In 1940’s William Sheldon, an
American psychologist came up with a modern typology in which he classified personality into
three categories namely; the endomorph, ectomorph and mesomorph. This classification was
© Associated Asia Research Foundation (AARF)
A Monthly Double-Blind Peer Reviewed Refereed Open Access International e-Journal - Included in the International Serial Directories.
Page | 44 The theories on Type A, B, C and D personalities are relatively new among the Type theories of
personality. These theories propose that each of these types of personalities has characteristics
which make them more susceptible to different health conditions. They suggest that a person
with type A personality is more susceptible towards Heart Diseases, people with type C
personalities are more prone towards developing cancer, especially breast cancer and people with
type D personalities are more likely to develop depression.
The Type C personality: Type C personality was often regarded as 'Cancer Personality'. This is a much disputed theory and there isn’t much research done enough to prove its claim of
predicting Cancer. They characteristics of Type C personality are:
They are perfectionists
They are consistent and dependable
They are thoughtful
They are emotionally repressed
--They are unassertive
Emotional suppression and perfectionism are two key characteristics of Type C individuals.
They prefer simply denying their feelings rather than expressing them. They are very detail
oriented and take as much as time to make anything perfect. They are exactly opposite to Type A
in meeting deadlines, where the former prefers theirwork to be organized and perfect than
meeting deadlines. They cannot say “no” to others which can become very stressful in many
situations. This frequent stressful situation can make them prone towards many illnesses.
People with type C personality want to be involved in things that are controlled and stable. They
desire facts, accuracy, and logic. They may not appear very expressive at times because they
don’t really want themselves to display a lot of emotion. They are excellent thinkers who will
look at all aspects of an issue before taking a decision. Once they make a decision, they will have
the facts to back it up so anyone who challenges them better be prepared. They prefer prioritizing
© Associated Asia Research Foundation (AARF)
A Monthly Double-Blind Peer Reviewed Refereed Open Access International e-Journal - Included in the International Serial Directories.
Page | 45 Objective of the study: Personality assessment has been a subject of interest for many centuries. It is widely used in various fields such as hiring process, evaluate business partners etc. The
Jenkins Activity Survey(Jenkins, Zyzanski, &Rosenman, 1979) is widely used to determine Type
A and B. The D Scale-14 (Johan Denollet,2010) is used to identify Type D personality. There is
no valid scale or questionnaire to assess Type C personality till date. The purpose of this study is
to construct and validate a Type Cbehaviour pattern scale.
Methodology
Likert rating scales were used in this study. Likert (1932) developed a method of measuring
attitudes by asking them to indicate their level of agreement or disagreement to a topic which
helps in understanding the cognitive and emotional components of attitudes. Likert-type or
frequency scales use fixed choice response formats and are designed to measure attitudes or
opinions (Bowling, 2012; Burns et al, 2014). these ordinal levels measures the level of
agreement or disagreement.
Construction of the Scale: There were 68 items in which 36 items were done positive scoring( i.e. strongly disagree=0, somewhat disagree=1, disagree=2, neutral=3, somewhat agree=4,
strongly agree=5) and 32 items were given negative scoring( i.e. strongly disagree=5, somewhat
disagree=4, disagree=3, neutral=2, somewhat agree=1, strongly agree=0). The reason for
reversing the scoring of negative items was to provide a total score that would reflect
positiveness in what was being measured by the questionnaire (Tuckman et al, 2012). The
assumptions made while constructing the scale was
a) The items are homogenous in nature
b) Each item measures a trait for Type C personality
c) Each item has a high correlation with the total score on the scale
There is a lot of limitations while using a quantitative method for measuring personality. So the
purpose of this questionnaire is restricted to an understanding of how an individual responds in a
social scenario. Also, Type C personality measured here is not for predicting a Cancer
© Associated Asia Research Foundation (AARF)
A Monthly Double-Blind Peer Reviewed Refereed Open Access International e-Journal - Included in the International Serial Directories.
Page | 46 Pilot Research: A pilot research was conducted on 351 adults of ages between 18 and 70 years- 188 women and 163 men. The items were constructed after getting inputs from subject matter
experts. Two copies of the scale was given out to language experts and subject experts and was
revised based on their comments. Three hundred and fifty one subjects responded to the
questionnaire online as well as paper pencil versions.
Statistical Analysis: Statistical Analysis was carried out in SPSS Version21.0 to interpret the results of the pilot study. The score of first five and last subjects of first 5 items and sixty sixitem
are given in Table1.
Table 1 showing the scores on first five items and sixty eighth item by the first five subjects and three hundred and fifty first subject.
No: Item1 Item2 Item3 Item4 Item5 Item6 ... Item66 Total
1 1 0 3 4 1 2 ... 3 150
2 3 1 3 0 3 2 ... 4 185
3 4 2 3 4 3 2 ... 4 197
4 5 1 2 2 3 2 ... 4 191
5 2 0 4 1 2 5 ... 3 158
... ... ... ... ... ... ... ... ... ...
351 5 4 3 2 5 4 4 189
The cronbach's alpha of the initial items were found to be 0.668. Since it wasn't found sufficient
enough to have a high internal consistency, scale variance of items deleted were examined.
According the corrected item-total correlation, each items to be excluded was selected at each
stage. More than two items were not deleted at a single step. The data was reduced to 24 items
to obtain a maximum of 0.883 as cronbach's alpha which indicates a good internal consistency.
© Associated Asia Research Foundation (AARF)
A Monthly Double-Blind Peer Reviewed Refereed Open Access International e-Journal - Included in the International Serial Directories.
[image:6.612.204.412.85.182.2]Page | 47 Table 2: showing the reliability statistics and Item total statistics of the initial scale, after item analysis and after factor analysis
Cronbach’s Alpha
No: of Items
0.668 66
0.883 24
0.838 14
The extraction method used was the principal component method. The extraction method used
was Oblimin method with kaisernormalisation. The method of oblique rotation was used with an
assumption that the underlying factor have very low correlation. The rotations were found to be
converged at 7 iterations. The reliability analysis was carried out to examine the internal
consistence of the scale with 14 items and the cronbach's alpha was found to be 0.838. This
proved that the final scale of 14 items has a high internal consistency and produce very reliable
results.
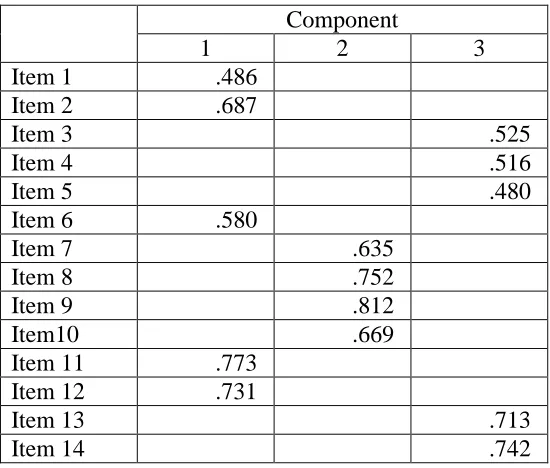
Table 3 showing the pattern matrix of factor analysis of the selected items carried out Component
1 2 3
Item 1 .486
Item 2 .687
Item 3 .525
Item 4 .516
Item 5 .480
Item 6 .580
Item 7 .635
Item 8 .752
Item 9 .812
Item10 .669
Item 11 .773
Item 12 .731
Item 13 .713
[image:6.612.169.444.383.617.2]© Associated Asia Research Foundation (AARF)
A Monthly Double-Blind Peer Reviewed Refereed Open Access International e-Journal - Included in the International Serial Directories.
Page | 48 Extraction Method: Principal Component
Analysis.
Rotation Method: Oblimin with Kaiser
Normalization.a
[image:7.612.86.530.200.280.2]a. Rotation converged in 7 iterations.
Table 6 showing the component correlation matrix
Component 1 2 3
1 1.000 .279 .345
2 .279 1.000 .282
3 .345 .282 1.000
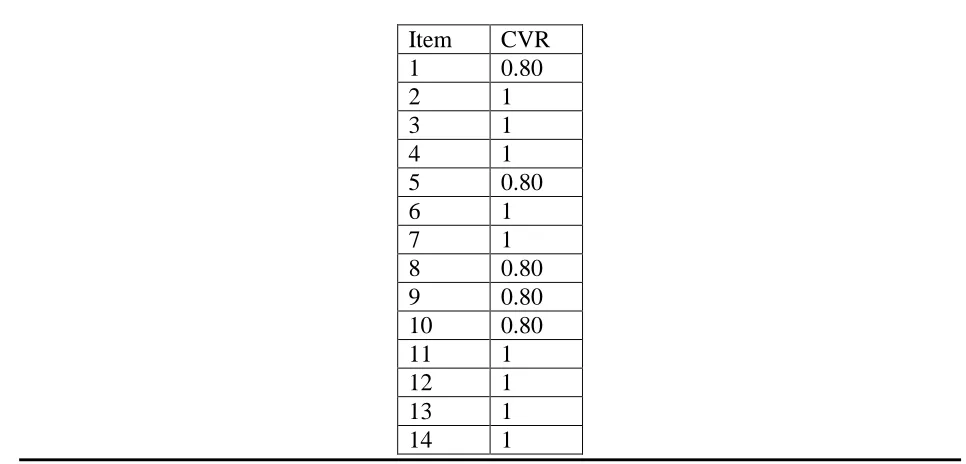
A panel of experts with subject experts assessed the content validity of the scale. They were
asked to rate the items as “essential”, “useful but essential” and “not essential”. Content validity
of each items was calculated using the formula CVR= ne- (n/2)/ (n/2). All the items were retained
as the CVR value of each item was closer to +1.00. There were 10 experts so items with more
than +.62 as CVR were retained.
Table 7 showing the CVR values of each items Item CVR
1 0.80
2 1
3 1
4 1
5 0.80
6 1
7 1
8 0.80
9 0.80
10 0.80
11 1
12 1
13 1
[image:7.612.61.544.450.682.2]© Associated Asia Research Foundation (AARF)
A Monthly Double-Blind Peer Reviewed Refereed Open Access International e-Journal - Included in the International Serial Directories.
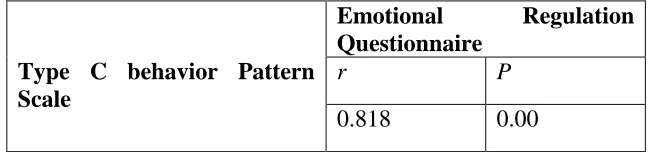
Page | 49 Emotion Regulation Questionnaire (ERQ) and Type C behavior pattern Scale was administered
to a group of 108 participants. Emotion Regulation Questionnaire (ERQ) is a 10 item
self-reporting questionnaire with 7- point rating scale developed by Gross and John (2003). It was
developed to assess two major emotion regulation strategies namely Reappraisal and
Suppression. One of the main characteristics of Type C personality people is emotional
suppression. It involves not expressing the experienced emotion to make the experience of
emotion not evident to others through facial expressions and other behavioral manifestations of
the emotion (John & Gross 2004). Though emotional content generated is present, the person
controls the outward expression of that emotion to psychologically relevant situation (Gross &
Thompson 2007). This eventually results in increased levels of negative emotion, increased
rumination regarding negative mood, decreased interpersonal function and quality of life (Butler
et al., 2003; Gross &Levenson 1997; Gross & John 2003; John & Gross 2004). The correlation
coefficient between two measures was found to be significant(r= 0.818, p= 000)which shows that
the construct validity of Type C behavior pattern scale is quite high.
Table 8 – Correlation between scores of Type C behavior pattern scale and Emotional Regulation Questionnaire (ERQ)
Type C behavior Pattern Scale
Emotional Regulation Questionnaire
r P
0.818 0.00
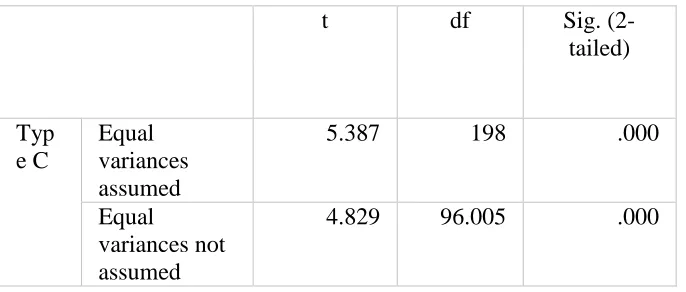
People with Type C personality are more prone towards developing depression. A group of 200
participants were administered with Patients health Questionnaire-9 to assess depression as well
[image:8.612.143.468.395.471.2]© Associated Asia Research Foundation (AARF)
A Monthly Double-Blind Peer Reviewed Refereed Open Access International e-Journal - Included in the International Serial Directories.
[image:9.612.67.410.68.214.2]Page | 50 Table 9- results of t test of two groups
t df Sig.
(2-tailed)
Typ e C
Equal variances assumed
5.387 198 .000
Equal
variances not assumed
4.829 96.005 .000
64 participants were found with symptoms of depression and 136 participants had no symptoms
of depression. Student’s t test results showed significant differences in scores of Type C behavior
pattern scale between the two groups. This establishes the predictive validity of the scale.
Summary and Conclusions
The purpose of this study was to construct a Type C behaviour pattern scale to identify
individuals with type C personality traits. A pilot study was conducted with a scale consisting of
66 items and reliability analysis was carried out. The cronbach's alpha was found to be 0.883 for
the selected 24 items. These items were selected as the final items for the Type C behaviour
pattern scale to go through factor analysis. With principal component method and oblimin
rotation, 14 items were extracted. A reliability analysis was done further to examine theinternal
consistence of the scale and the cronbach's alpha was found to be 0.838. A panel of 10 experts
established content validity and 14 items extracted were retained. This indicated that the final
scale will produce reliable results. Concurrent validity was found to be very high when it was
correlated with Emotional Regulation questionnaire (ERQ). The predictive validity was
established with PHQ-9 and the scale predicts the incidence of depression in individuals. The
revised Type C personality Scale can be used to have an understanding of the individuals rather
than making an indepth study of their personality. The traits of Type C personality denotes a lot
© Associated Asia Research Foundation (AARF)
A Monthly Double-Blind Peer Reviewed Refereed Open Access International e-Journal - Included in the International Serial Directories.
Page | 51 scale can be used in the counseling settings to understand how an individual behave in social
situations.
Appendix A : The final version of Type C behavior pattern Scale TYPE C Behavior pattern scale
Name:
Age:
Gender:
Kindly go through the items given below. There are 14 items and each items describe about how
you would react in many situations. Indicate your agreement or disagreement by selectingyour
response using this scale
0-strongly disagree
1-disagree
2-disagree somewhat
3-agree somewhat
4-agree
5-stongly agree
1. If I am assigned with a task, I am more concerned about finishing the task 2. I am consistent in everything I do
3. people say I am very thoughtful
4. I like to weigh pros and cons before making any decision
5. People say I am very fair and objective
6. I always want to be right and accurate
7. People usually take advantage of my generosity
8. I find it really difficult to refuse peoples requests
9. I am very careful not to hurt the feelings of others
10. I usually avoid any conflicts with others
11. I am very calculated and precise
© Associated Asia Research Foundation (AARF)
A Monthly Double-Blind Peer Reviewed Refereed Open Access International e-Journal - Included in the International Serial Directories.
Page | 52 12. I am always motivated to complete any task on time
13. When I am faced with a problem, I would like to take as much as time needed to analyze and understand the problem before finding a solution
14. I am very confident in finding solutions and making decisions
References
1. Aiken, L.R.Groth-Marnat,G. (2009). Psychological testing and Assessment. Twelfth
Edition. Pearson Education India. 2-4, 22-23, 87-89, 286-290, 320-338
2. Bowling, A. (2014)Research Methods in Health: Investigating Health and Health
Services. McGrawHill Publication.306-307
3. Boyle, G.J. Matthews, G. Saklofske, D.H. (2008). The SAGE Handbook of Personality
Theory and Assessment: Personality Theories and Models, Volume 1. 174-180.
4. Breakwell, G.M. Smith, J.A. Wright, D.B (2012). Research methods in psychology. Sage
Publications. Fourth Edition. 10-11
5. Burger, J.(2010). Personality. Eighth Edition.Cengage learning.12-15,23-30
6. Burns, N. Grove, S.K. Gray, J.R(2014). Understanding Nursing Research: Building an
Evidence-Based Practice. Sixth Edition. 298-300
7. Denollet, J (2010). DS14: Standard Assessment of Negative Affectivity, Social
Inhibition, and Type D Personality. 67(1). 89-97
8. Ellis, A.17, Abrams, M, Abrams, L(2008). Sage Publications. 67-80
9. Elmes,D. Kantowiz, B. Rodeiger, H. Research methods in Psychology. Ninth Edition.
16-17
10.Field, A. (2007). Discovering Statistics Using SPSS. Third Edition. Sage
Publications. 623-640
11.Friedman, M., &Rosenman, R. H. (1959). Association of Specific Overt Behavior
Pattern with Blood and Cardiovascular Findings Blood Cholesterol Level, Blood
Clotting Time, incidence of ArcusSenilis, and Clinical Coronary Artery
Disease. Journal of the American Medical Association, 169(12), 1286-1296.
12.Gerber, S.B. Finn, K.V. (2005).Using SPSS for Windows: Data Analysis and
© Associated Asia Research Foundation (AARF)
A Monthly Double-Blind Peer Reviewed Refereed Open Access International e-Journal - Included in the International Serial Directories.
Page | 53 13.Gross, J.J., & John, O.P. (2003). Individual differences in two emotion regulation
processes: Implications for affect, relationships, and well-being. Journal of
Personality and Social Psychology, 85, 348-362.
14.Jenkins, C.D, Zyzanski, S.J.Rosenman, R.H. (1979). Jenkins Activity Survey.
Psychological Corporartion. 1-4
15.Johan, Denollet(2005). DS14: Standard Assessment of Negative Affectivity,
Social Inhibition, and Type D Personality. Psychosomatic Medicine. 67(1). 89-97
16.Kutty, B.A(2013). Psychology for BSc. Nursing. PHI learning Private limited.
178.
17.Pastorino,E. Doyle-Portillo, S. (2012) What is Psychology? Essentials. Cengage
Learning.443-445
18.Reddy, P. Philpot, B. Ford, D. Dunbar, J.A (2010). Identification of depression in
diabetes: the efficacy of PHQ-9 and HADS-D. British Journal of General
Practice. 239-245
19.Sanders,L.D.(2010). First Edition. Discovering Research methods in psychology: A
students Guide. Blackwell Publishing. 249-250
20.Schultz, D.P. Schultz, S.(2012). Theories of Personality. Tenth Edition. Cengage
learning.3-10
21.Shekelle, R.B. Gale, M.B. Norusis, Marija. (1985).Type A score (Jenkins activity
Survey) and risk of recurrent coronary heart disease in the aspirin myocardial infarction
study. The American Journal of Cardiology.
22.Temoshok, L.(1987). Personality, Coping Style, Emotion and Cancer: towards an
integrative model. Cancer Surveys. 6(3). 545-567
23.Tuckman, B.W. Harper, B.E(2012). Conducting Educational Research. Sixth Edition.