(RNA-seq) as a Diagnostic Method in Influenza Virus-Positive
Respiratory Samples
Nicole Fischer,a,bDaniela Indenbirken,cThomas Meyer,aMarc Lütgehetmann,aHeinrich Lellek,dMichael Spohn,c Martin Aepfelbacher,aMalik Alawi,c,eAdam Grundhoffb,c
Institute of Medical Microbiology, Virology and Hygiene, University Medical Center Hamburg-Eppendorf (UKE), Hamburg, Germanya; German Center for Infection Research (DZIF), partner site Hamburg-Borstel-Lübeck, Germanyb; Heinrich-Pette-Institute (HPI), Leibniz Institute for Experimental Virology, Research Group Virus Genomics, Hamburg, Germanyc; Department of Stem Cell Transplantation, University Medical Center Hamburg-Eppendorf, Hamburg, Germanyd; Bioinformatics Service Facility, University Medical Center Hamburg-Eppendorf, Hamburg, Germanye
Unbiased nontargeted metagenomic RNA sequencing (UMERS) has the advantage to detect known as well as unknown patho-gens and, thus, can significantly improve the detection of viral, bacterial, parasitic, and fungal sequences in public health set-tings. In particular, conventional diagnostic methods successfully identify the putative pathogenic agent in only 30% to 40% of respiratory specimens from patients with acute respiratory illness. Here, we applied UMERS to 24 diagnostic respiratory speci-mens (bronchoalveolar lavage [BAL] fluid, sputum samples, and a swab) from patients with seasonal influenza infection and 5 BAL fluid samples from patients with pneumonia that tested negative for influenza to validate RNA sequencing as an unbiased diagnostic tool in comparison to conventional diagnostic methods. In addition to our comparison to PCR, we evaluated the po-tential to retrieve comprehensive influenza virus genomic information and the capability to detect known superinfecting patho-gens. Compared to quantitative real-time PCR for influenza viral sequences, UMERS detected influenza viral sequences in 18 of 24 samples. Complete influenza virus genomes could be assembled from 8 samples. Furthermore, in 3 of 24 influenza-positive samples, additional viral pathogens could be detected, and 2 of 24 samples showed a significantly increased abundance of indi-vidual bacterial species known to cause superinfections during an influenza virus infection. Thus, analysis of respiratory samples from known or suspected influenza patients by UMERS provides valuable information that is relevant for clinical investigation.
I
nfluenza has a severe impact on our health system, not only owing to its potential to cause worldwide pandemics but also due to the high number of seasonal infections. Bacterial and/or viral coinfections and subsequent pneumonia can lead to en-hanced illness in elderly and immunosuppressed patients. Ap-proximately 0.5% of all influenza A infections in healthy younger adults and 2.5% of influenza A infections in the elderly and younger children are accompanied by severe bacterial-induced pneumonia (1,2). These numbers are significantly higher during pandemic episodes (3–5). The most common causes of coinfec-tions observed in both pandemic and seasonal episodes of influ-enza A infections are Streptococcus pneumoniae, Staphylococcus aureus,Haemophilus influenzae, andStreptococcus pyogenes(6,7). This relationship between influenza virus and bacterial pathogenicity is underlined by several studies using animal models. For example, mice infected with influenza virus or Streptococcus pneumoniae alone showed mortality rates of 35% and 15%, respectively, whereas mice coinfected with influenza virus andStreptococcus pneumoniaedisplayed a 100% mortality rate (8). Furthermore, several studies in humans indicate that colonization with Strepto-coccus pneumoniaeincreases the risk of severe complications asso-ciated with influenza A viral infection (9,10), thus highlighting the importance of rapid diagnosis of bacterial coinfections or su-perinfections.Next-generation sequencing (NGS) approaches hold a unique potential to overcome challenges in diagnostics and detection and likely will significantly improve our ability to detect and diagnose pathogenic infections. Recent advances in genome sequencing and bioinformatics, with declining costs of NGS methods, enable
the application of this technique in routine diagnostic settings, where gold-standard techniques fail to detect a putative pathogen. NGS techniques provide us with an unprecedented opportunity to directly identify pathogens in clinical samples of hitherto idio-pathic diseases.
The reliable, unbiased, and comprehensive metagenomic anal-ysis of clinical samples requires the establishment of streamlined protocols with regard to sample preparation (e.g., key variables, such as processing and handling of different diagnostic specimens, and preanalytical reduction of sample complexity by removal of host nucleic acids), usage of different sequencing platforms (e.g., preferential use of short-read/high-coverage versus long-read/ medium-coverage techniques, depending on the nature of the
Received28 August 2014 Returned for modification23 September 2014
Accepted1 May 2015
Accepted manuscript posted online13 May 2015
CitationFischer N, Indenbirken D, Meyer T, Lütgehetmann M, Lellek H, Spohn M, Aepfelbacher M, Alawi M, Grundhoff A. 2015. Evaluation of unbiased next-generation sequencing of RNA (RNA-seq) as a diagnostic method in influenza virus-positive respiratory samples. J Clin Microbiol 53:2238 –2250.
doi:10.1128/JCM.02495-14.
Editor:Y.-W. Tang
Address correspondence to Nicole Fischer, nfischer@uke.de.
Supplemental material for this article may be found athttp://dx.doi.org/10.1128 /JCM.02495-14.
Copyright © 2015, American Society for Microbiology. All Rights Reserved.
doi:10.1128/JCM.02495-14
on May 16, 2020 by guest
http://jcm.asm.org/
clinical sample and diagnostic question), as well as subsequent bioinformatic processing (e.g.,de novoassembly or phylogenetic analysis of viral or bacterial genomes).
Given the above, the goals of this study were to (i) compare the sensitivity of influenza virus quantitative PCR (qPCR) and met-agenomic sequencing of routine diagnostic material, (ii) evaluate the potential to extract full genome information of influenza vi-ruses from the latter, (iii) analyze the detection of pathogens known to cause superinfections in patients with influenza virus infection, and (iv) estimate the feasibility of RNA sequencing from respiratory specimens as a putative diagnostic application in spe-cific public health settings.
MATERIALS AND METHODS
Diagnostic samples.Samples were received from the University Medical Center Hamburg-Eppendorf, Institute for Medical Microbiology. Respi-ratory samples included bronchoalveolar lavage (BAL) fluid, sputum samples, or swabs from patients with respiratory illness and suspected influenza infection. Swab samples were received from ambulatory pa-tients with signs of influenza virus infection, whereas sputum samples, BAL fluid, and tracheal secretions were received from hospitalized pa-tients with underlying diseases (mostly immunosuppressed papa-tients) and suspected influenza virus infection. All samples were screened by standard diagnostic quantitative real-time PCR (RT-PCR) for influenza A and B virus.
Five BAL fluid samples collected from immunosuppressed patients (patients with hematopoietic stem cell transplantation) hospitalized be-cause of severe pneumonia were included. These samples tested negative for influenza A and B by routine diagnostic RT-PCR. The samples were analyzed in a blinded fashion; diagnostic findings received by conven-tional diagnostics were not known to the scientists performing library preparation, sequencing, or primary data analysis.
The study was approved in compliance with relevant laws and institu-tional guidelines by the local ethics committee, Freie Hansestadt Ham-burg, WF-025/12. The study was conducted retrospectively on anony-mously stored clinical samples. Information which would allow the identification of the patient (name, address, birth date, hospitalization number) was removed. The samples were collected between November 2012 and March 2013.
Nucleic acid extraction.Nucleic acid from 0.2 ml BAL fluid or spu-tum sample was extracted using an automated extraction system, NucliSens easyMag, from bioMérieux following the manufacturer’s in-structions. Swabs were incubated with 1 ml D solution containing guani-dine thiocyanate, 1 M Tris HCl (pH 6.4), and 1% beta-mercaptoethanol, followed by nucleic acid extraction as described above using 0.2 ml of the solution.
Library preparation and high-throughput sequencing.Illumina li-braries from RNA were generated using a modified protocol of the Script Seq v2 RNA-seq kit (Epicentre Biotechnologies) (11). A total of 15 ng total RNA quantified by Qubit (Invitrogen) after DNase treatment was sub-jected to size fragmentation, followed by cDNA synthesis and the addition of a terminal tagged oligonucleotide. Di-tagged cDNA was purified with Agencourt AMPure XP beads followed by amplification (15 cycles). Frag-ment length distribution of all libraries was analyzed on a BioAnalyzer high-sensitivity LabChip. Diluted libraries (2 nM) were multiplex se-quenced on the Illumina MiSeq (2- by 250-bp paired-end run, 2 to 3 million reads/sample) or HiSeq 2500 instrument (2- by 100-bp paired-end run, 30 to 40 million reads/sample).
De novocontig assembly and taxonomic classification.Analysis of
total RNA sequencing data were performed as recently described (11,12), with modifications to detect taxonomic ambiguity among the detected sequences. To subtract reads originating from the host, reads were first aligned to the human reference assembly (NCBI 37.2) using Bowtie2 (v2.1.0). Trinity (r2013-02-25) was used to assemble contigs from reads
not producing significant host alignments. Contigs assembled from 2- by 100-bp paired-end HiSeq reads were subsequently filtered for sequences of a minimal length of 300 bp. For MiSeq reads (2- by 250-bp paired-end reads), an increased length cutoff of 400 bp was used. To estimate contig abundance, all reads not aligning to human sequences were remapped to the filtered contigs using Bowtie2. Putative PCR duplicates were excluded from the abundance estimation.
For taxonomic classification, filtered contigs were aligned to the NCBI nucleotide database using the BLAST⫹package (v2.2.30). A first round of alignments was performed with megaBLAST. All sequences not produc-ing significant megaBLAST hits (E value cutoff, 0.01) were subsequently included in a second alignment round employing BLASTn. Contigs fail-ing to produce alignments with an E value ofⱕ0.01 in either round were classified as unknown sequences. For each of the remaining contigs, all BLAST hits with a maximum bit score difference of 7 (corresponding to a maximum difference ofPvalues of⬍0.01) relative to the hit with the highest observed bit score were retained. In order to establish the level of taxonomic ambiguity for each contig sequence, the lowest shared nomic ancestor was subsequently determined by moving up the taxo-nomic tree until an unambiguous assignment could be made for all re-tained BLAST hits. For downstream analysis on a given taxonomy level, only contigs with an unambiguous assignment at or below the chosen taxonomic level were used.
To avoid taxonomic assignments which are of doubtful significance (for example, due to sequences which exhibit nucleotide homology only across a minor fraction of the entire length of the contig), only contigs with at least one BLAST hit that extended over at least 80% of the entire contig length and exhibited at least 80% nucleotide identity were consid-ered principally classifiable and retained for downstream analysis.
Identification of rRNA contigs.All contigs were screened for 16S and 23S rRNA signatures using HMMER (v3.1b1) (13). Hidden Markov mod-els (HMMs) were derived from 732 and 1,409 sequences obtained from RefSeq. Using Usearch (v7.0.1090), (14), the sequences were clustered at 90% sequence similarity, and one representative centroid was selected for each resulting cluster. Multiple sequence alignments, of which the HMMs were eventually built, were generated with Muscle (v3.8.31) (15). The whole set of originally obtained sequences was used to verify the sensitivity of the models built. To increase power at the expense of speed, all heuristic filters were turned off whenever hmmsearch was invoked. All contigs with an observed E value of maximally 0.01 were considered to be of ribosomal origin.
In silicomodeling.The detection sensitivity of the analysis pipeline
was assessed using simulated influenza reads and, as a background, ran-domly selected reads from the pooled reads of the influenza virus-negative control samples (samples 1 to 5). The total number of paired-end reads to be included in each analysis was fixed as 50,000,000, whereas the absolute abundance of simulated influenza virus reads was increased in four steps from 125 up to 1,000 reads, corresponding to a relative abundance of 0.00025% up to 0.002%. In addition, different mutations rates, ranging from 0.05% to 25%, were introduced in the simulated influenza virus reads. The resulting 20 distinct combinations of relative abundance and mutation rates among the influenza virus reads were independently pro-cessed three times, each time with a newly generated set of simulated influenza virus reads and randomly selected background reads. To allow assessment of the background’s influence on viral read recovery, all sim-ulations were additionally carried out solely with simulated influenza reads.
For the simulation of 100-bp paired-end reads from the influenza reference sequences (GenBank accession numbersFJ966079.1,FJ966080.1, FJ966081.1,FJ966082.1,FJ966083.1,FJ966084.1,FJ966085.1, andFJ966086.1), the program wgsim of the SAMtools package (16) was employed in hap-lotype mode. Aside from parameters explicitly mentioned above, the pro-gram was invoked with default parameters.
All simulated data sets were analyzed by the same pipeline used for the analysis of clinical samples.
Metatranscriptome Analysis for Pathogen Detection
on May 16, 2020 by guest
http://jcm.asm.org/
Variant calling.Reads were aligned to the corresponding reference assemblies using Bowtie2 (v2.2.3). SAMtools (v0.1.18) was employed to remove putative PCR duplicates. Alignments of samples belonging to the same reference assemblies were merged. For each of the resulting two pools, variants were called with FreeBayes (v0.9.18-1-g4233a23) (17). Pu-tative variants were filtered for quality (threshold 20), and positions at which at least one sample supported both the reference and an alternative sequence with at least five reads were visually assessed using the integrative genomics viewer (v2.3.40) (18).
RT-PCR.The PCR primers and specific probes for influenza virus quantitative PCR used have been described previously (19–21). The fol-lowing primers and probes were used: InflA_F (GACAAGACCAATC CTGTCACYTCTG), InflA_R (AAGCGTCTACGCTGCAGTCC and HEX-TTCACGCTCACCGTGCCCAGTGAGC-BHQ2 [HEX indicates 5= -hexachlorofluorescein; BHQ2, black hole quencher 2]), InflB_F (TCGCTGT TTGCAGACACAAT), InflB_R (TTCTTTCCCACCGAACCA and Cya n500-AGAAGATGGAGAAGGCAAAGCAGAACT-dabcyl-dT [DB]) (19), M_InflA_F (AAGACCAATCCTGTCACCTCTGA), M_InflA_R (CAAA GCGTCTACGCTGCAGTCC and FAM-TTTGTGTTCACGCTCACCGT-BHQ1 [FAM indicates 6-carboxyfluorescein], for the detection of the FLU A matrix protein) (21), HA_H1SWAS (ATGCTGCCGTTACACCTTTGT), and HA_H1SWS (CATTTGAAAGGTTTGAGATATTCC and FAM-ACAA GTTCATGGCCCAATCATGACTCG-BHQ1, for H1N1 subtyping) (20).
PCRs were performed using the Quantifast pathogen RT-PCR kit⫹IC (Qiagen). A total of 5l of eluted nucleic acid was amplified in a total volume of 25l on Roche Lightcycler 480 instruments using the following conditions: 20 min at 50°C, 5 min at 95°C, 45⫻15 s at 95°C, and 30 s at 60°C. PCRs were carried out in a routine diagnostic environment which underlies internal and external quality controls. With regard to diagnostic accreditation, all diagnostic PCR tests are validated with clinical speci-mens and multicenter tests.
Sequence alignments and phylogenetic trees.Maximum likelihood phylogeny analysis was performed using CLC main work bench 6.6.1.
Sequence data for all 29 samples have been submitted to the European Nucleotide Archive (ENA) and will be publicly available athttp://www.ebi .ac.uk/ena/data/view.
RESULTS
Influenza RT-qPCR.The influenza-positive specimens analyzed in our study represented 24 respiratory samples (from BAL fluid, n ⫽7; sputum sample,n ⫽5; swabs, n ⫽11; and a tracheal secretion,n⫽1) from patients with seasonal influenza virus in-fection collected during the winter season of 2012-2013. All sam-ples had previously tested positive for influenza A or B virus by routine diagnostic RT-qPCR using influenza-specific TaqMan probes and were stored at⫺80°C. To exclude false-negative find-ings resulting from degradation of stored samples, RT-qPCR for influenza A or B virus was repeated using three primer pairs and TaqMan probes: (i) influenza A primers (FluA) able to detect both H1N1 and H3N2 genotypes, (ii) a primer set specific for H1N1, and (iii) primers specific for influenza B virus (FluB). As shown in
Table 1, a single sample was influenza B positive, while 23 samples
were positive for influenza A viral sequences; 11 samples produced significant threshold cycle (CT) values for H1N1 specific primers, while 12 samples were negative in the H1N1 PCR. These se-quences were not further genotyped, assuming that the subtypes of influenza A currently circulating in the human population are H1N1 and H3N2. In general,CTvalues ranged between 23 and 40, with 5 samples (samples 677, 2,535, 1,689, 768, and 2,544) exhib-itingCTvaluesⱖ35. In addition to the influenza-positive samples, 5 respiratory samples (BAL fluid) from patients with respiratory infections which had tested negative for influenza A or B se-quences were included in our study.
RNA sequencing to detect influenza virus sequences in diag-nostic samples.From each sample, strand-specific RNA-seq librar-ies were constructed and multiplex sequenced with 1.5 to 3.5 million or 25 to 45 million reads per sample on an Illumina MiSeq or HiSeq2500 instrument, respectively (see Table S1 in the supplemen-tal material). Reads passing quality filters were aligned to the human reference genome to deplete sequences of host origin. The complete workflow is outlined in Fig. S1 in the supplemental material. As ex-pected, the samples exhibited marked variation with regard to the frequency of human sequences (Fig. 1; see also Table S2 in the sup-plemental material). The BAL fluid samples contained an average 60.77% of human reads (minimum, 13.06%; maximum, 83.86%), sputum sample, an average of 16.3% (minimum, 1.2%; maximum, 40.91%), and swab samples, an average of 33.61% (minimum, 0.93%; maximum, 79.34%).
[image:3.585.298.543.78.350.2]Filtered reads were subjected tode novocontig assembly, pro-ducing between 510,402 and 17,953,404 contigs from HiSeq data sets and between 129,072 and 1,175,340 contigs from MiSeq data sets (see Table S1 in the supplemental material). After filtering for contigs of at least 300 or 400 nucleotides (HiSeq and MiSeq data sets, respectively), between 369 and 29,688 contigs of nonhuman origin remained for samples processed on the HiSeq, whereas be-tween 16 and 2,799 contigs were retained for samples processed on the MiSeq instrument. The complete set of host-depleted reads was then aligned to the contigs to allow estimation of the abun-dance of individual sequences. For each contig, we calculated a normalized value representing the number of reads per million mapped reads (RPM). For homology-based taxonomic classifica-tion, all contigs were compared to the NCBI nucleotide database.
TABLE 1Summary of clinical samples and routine diagnostic results
Sample no.
Diagnostic entity
PCR influenzaCTvaluesa Influenza
genotype
FluA Matrix H1
104 BAL fluid 26 28 Neg fluAb
755 BAL fluid 33 32 30 H1N1
1,116 BAL fluid 30 28 29 H1N1
1,721 BAL fluid 26 28 Neg fluAb
2,535 BAL fluid 40 NT Neg fluAb
2,292 BAL fluid 24 NT 23 H1N1
3,157 BAL fluid 30 NT Neg fluAb
1,773 Sputum 25 27 Neg fluAb
1,168 Sputum 23 24 Neg fluAb
853 Sputum 27 25 25 H1N1
677 Sputum Neg 35 34 H1N1
208 Sputum 30 Neg 27 H1N1
2,373 Swab 31 NT Neg fluAb
2,098 Swab 33 NT Neg fluAb
1,689 Swab 36 40 Neg fluAb
1,647 Swab 31 34 Neg fluAb
1,539 Swab 30 30 28 H1N1
1,538 Swab 30 29 29 H1N1
768 Swab 36 35 34 H1N1
83 Swab 29 29 25 H1N1
848 Swab 28 26 26 H1N1
2,295 Swab 32 28 Neg fluAb
2,544 Swab 35 NT Neg fluAb
14,087 Secretion Neg NT NT InflB (CTof 29)
aNeg, negative; NT, not tested. b
These sequences were negative in H1N1 genotyping; influenza A subtypes currently circulating in the human population are H1N1 and H3N2. InflB, influenza B.
on May 16, 2020 by guest
http://jcm.asm.org/
Contigs with more than one BLAST hit were classified according to the lowest common taxonomic ancestor of individual hits (see the Material and Methods section for details). When visualizing the taxonomic assignment of the contigs to cellular organisms, viruses, or unclassified sequences (Fig. 2and3;Table 2; see also Table S2 in the supplemental material), it was obvious that 18 of the 24 samples contained a significant number of reads matching ssRNA viruses, family Orthomyxoviridae, genus Influenzavirus, encompassing 0.0003% to 29.6% of reads in matched contigs (RPM values between 4 and 365,373;Table 2). In accordance with the RT-qPCR results, 17 libraries contained contigs matching fluenza A, whereas the library from sample 14,087 contained in-fluenza B sequences. Among the 6 libraries which had been posi-tive by PCR but negaposi-tive by NGS, all but one (sample 1,116) had CTvalues above 35, indicating that failure to detect influenza virus infection was due to a very low abundance of viral sequences.
High correlation between the numbers of influenza virus NGS reads and theCTvalues of real-time influenza PCR in BAL
fluid samples.We calculated Pearson correlation coefficients be-tweenCTvalues observed by RT-qPCR and the relative abundance of influenza-specific reads. While we found a strong relationship between unbiased nontargeted metagenomic RNA sequencing (UMERS) and RT-qPCR for BAL fluid samples (Pearson correla-tion coefficient,⫺0.8112) (Fig. 4A), we found only a weak associ-ation for sputum samples and swabs, with Pearson correlassoci-ation coefficients of⫺0.433 and⫺0.456, respectively (Fig. 4BandC).
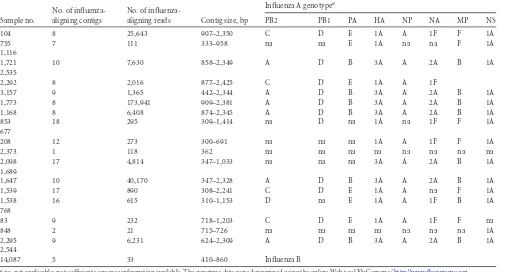
Recovery of influenza virus genomic segments.Contig as-sembly allowed the recovery of influenza genomic fragments in all influenza virus-positive samples. In 8 of 17 cases, we were able to assemble full-length genome sequences, while, in 3 additional samples (samples 1,538, 1,539, and 83), 7 of 8 influenza A seg-ments were successfully assembled. We applied the Web tool FluGenome (http://flugenome.org/) to assign the lineage and ge-notype of influenza A sequences and to perform a comprehensive genetic analysis of the entire viral genome. As shown inTable 3, the analysis confirmed the presence of seasonal circulating geno-types H3N2 (A [PB2], D [PB1], B [PA], 3A [HA], A [NP], 2A [NA], B [MP], and 1A [NS]) and H1N1 (C, D, E, 1A, A, 1F, F, and 1A). Different from the circulating strain, in sample 1,538, we observed segment 7 (MP) assigned to the B lineage.
Sensitivity of UMERS detection algorithm calculated byin
silicoanalysis.Given that our bioinformatic detection pipeline
employs the analysis of sequence contigs, failure to assemble con-tigs of appropriate length (for example, due to the presence of interfering background sequences) may potentially lead to false-negative results. We therefore applied a benchmarking analysis to measure the performance of our bioinformatics analysis. As shown in Fig. S2A and Table S3 in the supplemental material, the analysis pipeline reliably detects influenza at abundances of only 250 simulated paired-end reads of a 100-bp size.
Employingⱖ500 viral reads exhibited marked robustness even at the highest mutation rate. While 500 reads correspond to a
FIG 1Diagnostic sample composition at the phylum level for digitally subtracted host reads as well as reads mapped to taxonomically classified sequence contigs. Phylum profiles (proportion of all reads) for bacteria, fungi, and viruses are shown for the individual samples. Sample 14,087 (labeled with *) originated from a tracheal secretion.
Metatranscriptome Analysis for Pathogen Detection
on May 16, 2020 by guest
http://jcm.asm.org/
[image:4.585.115.475.65.388.2]relative abundance of only 0.001%, it is worth pointing out that relative abundance has no immediate impact on the detection capability of the pipeline. The integrated assembly step requires a minimal absolute number of influenza reads which allows effi-cient generation of sequence contigs, whereas the presence of background sequences is not expected to impair the assembly of viral contigs. In support of this notion, similar results were ob-tained when we repeated the analysis without the background of transcriptome reads (see Fig. S2B and Table S4 in the supplemen-tal material).
Phylogenetic analysis of the hemagglutinin- and neuramin-idase-encoding genes.Phylogenetic analysis was performed to elucidate the sequence variation of the antigenic epitopes hemag-glutinin (HA) and neuraminidase (NA) during the 2012-2013 sea-son. Overall, 1,400 nucleotides of the NA-encoding gene (Fig. 5A
andB) and 1,701 nucleotides of the HA-encoding gene (Fig. 5C
andD) were aligned to the HA- and NA-encoding genes of the corresponding vaccine strains of that season (A_Victoria_361_ 2011_H3N2 and A_California_2009_H1N1). A 99.3% to 99.8% sequence identity was observed between NA gene fragments of the NA2 lineage (Fig. 5A), while a 98.9% to 99.5% sequence identity was observed for the fragments of the NA1 lineage (Fig. 5B). For the HA-encoding gene alignment, we observe a 99.8% sequence identity between the HA sequences isolated from the different patients and a 99% sequence identity to the corresponding HA sequence of the vaccine strain A_Victoria_361_2011 (Fig. 5C).
Detection of viral sequence variants and therapy resistance markers.We analyzed influenza sequences from 6 patients (only samples with influenza sequence reads⬎20,000 RPM were in-cluded) to search for genomic subpopulations identified by single nucleotide polymorphisms at specific nucleotide positions. For H3N2 and H1N1 sequences, samples from 4 (samples 104, 1,721, 1,773, and 1,647) and 2 (samples 2,292 and 83) patients, respec-tively, were included. Using a frequency cutoff of 10%, we did not find any evidence for quasispecies among the H1N1 sequences analyzed. In the case of H3N2 sequences, we identified in sample 1,773 one variant in the HA segment at nucleotide position 441 (T to C) resulting in a silent mutation in the triplet encoding amino acid (aa) 147. Likewise, in sample 1,647, a silent mutation at nu-cleotide position 1,050 (A to G) in the region encoding the HA segment was identified.
We analyzed all H1N1 and H3N2 NA segments for mutations previously described to contribute to NA inhibitor resistance (see Table S5 in the supplemental material). We found all H3N2 strains to likely be sensitive to neuraminidase inhibitors (oselta-mivir, zana(oselta-mivir, peramivir) (22). The H1N1 strains for which sufficient sequence information was available were found to likely be sensitive to oseltamivir and peramivir, since an H275Y muta-tion was not present. Furthermore, all strains were predicted to exhibit medium resistance against zanamivir due to the presence of the N70S mutation (22). Additionally, for all sequences with sufficient sequence information, we detected the presence of the
FIG 2Diagnostic sample composition at the phylum level without host sequences. Phylum profiles (percentage of reads mapping to nonhost contigs) for bacteria, fungi, and viruses are shown for the individual samples. Sample 14,087 (labeled with *) originated from a tracheal secretion.
on May 16, 2020 by guest
http://jcm.asm.org/
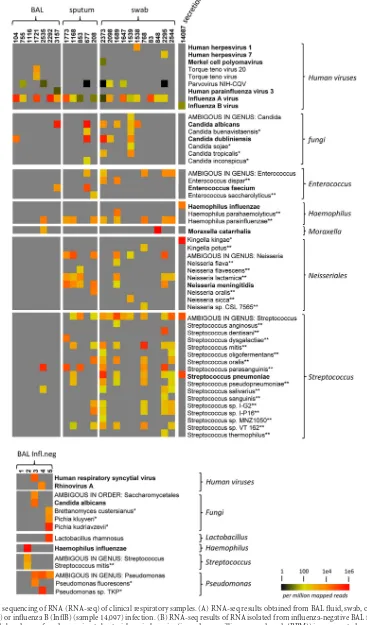
[image:5.585.113.477.65.386.2]FIG 3Next-generation sequencing of RNA (RNA-seq) of clinical respiratory samples. (A) RNA-seq results obtained from BAL fluid, swab, or sputum samples with influenza A (InflA) or influenza B (InflB) (sample 14,097) infection. (B) RNA-seq results of RNA isolated from influenza-negative BAL fluid samples. The relative and normalized abundance of reads mapping to bacterial or viral species (in reads per million mapped reads [RPM]) is represented according to the heat map legend shown in the lower right corner. A gray rectangle indicates no reads were detected. For bacteria and fungi, only contigs with⬎2,000 RPM and BLAST hits covering at least 80% of the contig sequence with at least 80% sequence identity, were included. In addition, only contigs with an unambiguous classification on the selected taxonomy level were considered. Bacteria, fungi, or viruses associated with respiratory diseases are indicated in bold letters. *, common environmental microorganism; **, nonpathogenic commensal bacteria.
on May 16, 2020 by guest
http://jcm.asm.org/
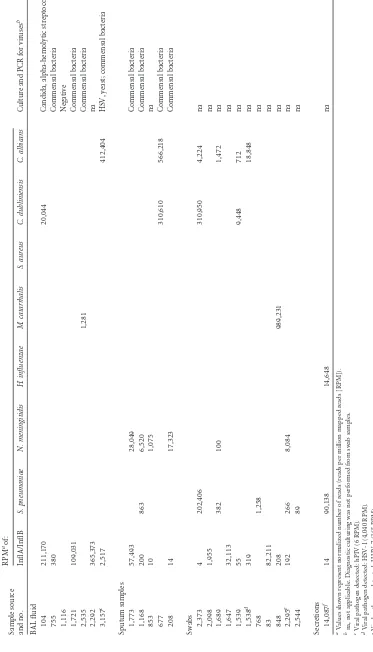
[image:6.585.113.480.39.664.2]TABLE 2 NGS data (on influenza-positive samples) showing pathogens known to cause respiratory infections and results of diagnostic culture Sample source and no. RPM aof: Culture and PCR for viruses b InflA/InflB S. pneumoniae N. meningitidis H. influenzae M. catarrhalis S. aureus C. dubliniensis C. albicans BAL fluid 104 211,170 20,044 Candida, alpha-hemolytic streptococci 755 380 Commensal bacteria 1,116 Negative 1,721 109,031 Commensal bacteria 2,535 1,281 Commensal bacteria 2,292 365,373 na 3,157 c 2,517 412,404 HSV, yeast; commensal bacteria Sputum samples 1,773 57,493 28,049 Commensal bacteria 1,168 200 863 6,520 Commensal bacteria 853 10 1,075 na 677 310,610 566,218 Commensal bacteria 208 14 17,323 Commensal bacteria Swabs 2,373 4 202,406 310,950 4,224 na 2,098 1,955 na 1,689 382 100 1,472 na 1,647 32,113 na 1,539 55 9,448 712 na 1,538 d 319 18,848 na 768 1,258 na 83 82,211 na 848 208 989,231 na 2,295 e 192 266 8,084 na 2,544 89 na Secretions 14,087 f 14 90,138 14,648 na aValues shown represent normalized number of reads (reads per million mapped reads [RPM]). bna, not applicable. Diagnostic culturing was not performed from swab samples. cViral pathogen detected: hPIV (6 RPM). dViral pathogen detected: HSV-1 (4,040 RPM). eViral pathogen detected: HHV-7 (365 RPM). fInfluenza virus b; Kingella kingae (536,079 RPM).
on May 16, 2020 by guest
http://jcm.asm.org/
[image:7.585.101.474.77.729.2]S31 mutation in the M2 segment, which is responsible for ada-mantane resistance (data not shown).
Recovery of viral sequences other thanOrthomyxoviridae from RNA libraries.We recovered sequences of human viruses other than influenza virus in 5 of 24 samples. In 1 of the samples, we identified viral sequences matching to the human herpesvirus 1 (HSV-1) (4,040 RPM). One sample contained sequences corre-sponding to human parainfluenzavirus 3 (hPIV-3) (6 RPM), and we identified human herpesvirus 7 (365 RPM) in another sample
(Fig. 3A). One sample showed a significant number of reads (902
RPM) belonging to the highly abundant, nonpathogenic anello-virus family TT anello-virus. Furthermore, one sample exhibited 53 RPM for the human Merkel cell polyomavirus (MCPyV). This virus has previously been detected in respiratory samples (23); however, whether it may potentially play a role in respiratory disease re-mains unknown.
Furthermore, sequences of human-pathogenic viruses other than influenza were recovered in 2 of the 5 analyzed influenza negative samples. Sample 3 contained viral reads corresponding to human respiratory syncytial virus, and sample 4 contained se-quences with significant homology to human rhinovirus A (Fig. 3B; see also Table S6 in the supplemental material).
In the majority of samples, viral sequences corresponding to retroviral sequences can be detected (data not shown). These se-quences showed high identity to alpha-retroviruses, murine leu-kemia virus, or avian leuleu-kemia virus-related sequences, which can be explained by the fact that reverse transcriptase enzyme prepa-rations (as used during the preparation of sequencing libraries) are frequently contaminated with retroviral sequences. All sam-ples displayed sequences with significant homologies to
Circoviri-dae, which was recently shown to be a common contaminant in commercial silica gel-based nucleic acid extraction spin columns (24,25).
Bacterial sequences in influenza-positive respiratory speci-mens.NGS reads corresponding to bacterial sequences, mostly representing commensal flora, were recovered in each of the RNA samples from respiratory material (Table 2; see also Table S2 in the supplemental material) in a range of 4,829 to 999,446 RPM (nor-malized numbers of reads per million mapped reads on nonhost origin). In accordance with previous studies, the phylogenetic composition of the upper respiratory samples (from sputum and swabs) at the phylum level is dominated by proteobacteria, acin-etobacteria, and firmicutes (Fig. 1and2). By comparison, BAL fluid samples representing the lower respiratory tract were gener-ally lower on bacterial sequences (Fig. 1and3). While some of the detected sequences may result from contamination with saliva, we also detected bacteria with the potential to cause severe coinfec-tions or superinfeccoinfec-tions (Fig. 3, Table 2). Streptococcus pneu-moniae,Neisseria meningitidis,Haemophilus influenzae, Staphylo-coccus aureus, andMoraxella catarrhaliswere identified in most sputum and swab samples, while BAL fluid samples were generally low on bacterial sequences. Since all of these bacteria are part of the commensal flora of the respiratory tract, discrimination be-tween colonization and infection cannot be achieved by labora-tory detection alone but ultimately requires further evaluation of the clinical data. However, two samples displayed significant numbers of reads of a single individual bacterial species: in sample 2,373, 20.2% of all nonhuman reads (202,406 RPM) could be contributed toStreptococcus pneumoniae, which is part of the nor-mal upper respiratory tract flora but can contribute to respiratory
FIG 4Correlation between reads per million mapped reads (RPM) matching influenza A virus sequences andCTvalues of influenza A virus-specific RT-qPCR in BAL fluid samples (A), sputum samples (B), and swab samples (C).
Metatranscriptome Analysis for Pathogen Detection
on May 16, 2020 by guest
http://jcm.asm.org/
[image:8.585.113.475.67.338.2]infections under certain conditions. In sample 848, 98.9% of all nonhuman reads (989,231 RPM) were mapped toMoraxella ca-tarrhalis, which is a common respiratory tract pathogen in chil-dren and adults. Interestingly, in sample 14,087, 536,079 RPM corresponded toKingella kingae, which in rare cases can contrib-ute to respiratory infection in immunosuppressed patients.
Table 2summarizes the results of diagnostic bacterial and
fun-gal culture assays which were part of the routine diagnostics of the sputum and BAL fluid samples of patients with influenza infec-tion. In all samples included in diagnostic culturing, commensal flora of the respiratory tract was detected. In general, swab sam-ples were not subjected to routine culturing processes.
Analysis of bacterial ribosomal sequences.Given that a large fraction of bacterial reads is likely to stem from highly conserved ribosomal sequences, we analyzed our data sets to identify se-quence contigs of ribosomal origin. These contigs were evaluated to determine to what extent the corresponding sequences allow classification on different taxonomic levels. As shown in Table S7 in the supplemental material, although ribosomal contigs repre-sented only a minor fraction of the total number of assembled sequences (on average, 3.3%), they contributed disproportionally large to the number of reads that were of nonhuman origin (av-erage, 27%). However, determination of the lowest common an-cestor among all BLAST alignments also shows that the majority of assembled sequences allow taxonomic classification on the spe-cies level. Hence, similar to targeted amplicon sequencing of bac-terial rRNAs, UMERS-derived contigs originating from highly conserved sequences can hold sufficient discriminatory power to allow accurate taxonomic classification.
Recovery of fungal sequences.We found fungal sequences
with significant homology toCandida albicansandCandida dub-liniensisin 7 of 24 samples. Three of these samples (BAL fluid sample 3,157, sputum sample 677, and swab sample 2,373) exhib-ited RPM values between 310,610 and 566,218, suggesting high abundance of theseCandidasequences (Table 2).Candida dub-liniensiswas also detected by culture in 3 samples (BAL fluid sam-ples 104 and 3,157 and sputum sample 677).
DISCUSSION
Unbiased DNA and/or RNA sequencing by NGS from diagnostic samples could be superior to current diagnostic technologies, since it has the potential to detect known as well as unknown pathogens (viruses, bacteria, fungi, and parasites) in a single ap-plication. NGS techniques to detect infectious agents have been used in the past; however, a systematic analysis of this technique in the detection of pathogens from different diagnostic entities is lacking. Furthermore, most studies searching for novel viruses applied specific strategies to enrich for viral particles or viral se-quences (e.g., ultracentrifugation, filtration, or amplification strategies) (26) or applied amplicon sequencing to describe the microbiome associated with specific diseases (27–29). However, with regard to diagnostic application in the clinic, standard oper-ating procedures for nucleic extraction, library preparation, and bioinformatics analysis together with validation of NGS are ur-gently needed. Since large-scale validation of NGS with regard to costs and complexity is rather challenging and hardly feasible for individual groups, small-scale studies applying this technique to different diagnostic entities are of significant value (30–32).
Assuming that a particular pathogen should be of relatively high abundance in an acute disease-associated metabiome, we
ap-TABLE 3Summary of contigs aligning to influenza A or B
Sample no.
No. of influenza-aligning contigs
No. of
influenza-aligning reads Contig size, bp
Influenza A genotypea
PB2 PB1 PA HA NP NA MP NS
104 8 25,643 907–2,350 C D E 1A A 1F F 1A
755 7 111 333–958 na na E 1A na na F 1A
1,116
1,721 10 7,630 858–2,349 A D B 3A A 2A B 1A
2,535
2,292 8 2,016 877–2,425 C D E 1A A 1F
3,157 9 1,365 442–2,344 A D B 3A A 2A B 1A
1,773 8 173,941 909–2,381 A D B 3A A 2A B 1A
1,168 8 6,408 874–2,345 A D B 3A A 2A B 1A
853 18 295 309–1,414 na D na 1A na 1F F 1A
677
208 12 273 300–691 na na na 1A A 1F F 1A
2,373 1 118 362 na na na na na na na na
2,098 17 4,814 347–1,033 na na na 3A A 2A B 1A
1,689
1,647 10 40,170 347–2,328 A D B 3A A 2A B 1A
1,539 17 890 308–2,241 C D E 1A A na F 1A
1,538 16 615 310–1,153 D na E 1A A 1F B 1A
768
83 9 232 718–1,203 C D E 1A A 1F F na
848 2 21 715–726 na na na na na na na 1A
2,295 9 6,231 624–2,309 A D B 3A A 2A B 1A
2,544
14,087 5 33 410–860 Influenza B
ana, not applicable; not sufficient sequence information available. The genotype data were determined using the online Web tool FluGenome (http://www.flugenome.org /genotyping.php) with the following settings: BLAST, 75% identity and 75% coverage.
on May 16, 2020 by guest
http://jcm.asm.org/
[image:9.585.40.552.78.350.2]plied unbiased metagenomic analysis to routine diagnostic respi-ratory samples (n⫽29) to test this method as a putative diagnostic strategy in respiratory specimens in specific public health or clin-ical settings where unbiased diagnostic methods can efficiently complement classical diagnostic methods.
The objective of this study was to evaluate the potential of metagenomic analysis performed directly from RNA material iso-lated from diagnostic samples of patients suffering from seasonal influenza virus infection. For BAL fluid samples, we were able to show that there is high concordance between the sensitivity of influenza virus qPCR and metagenomic sequencing, which is in line with previous observations applying NGS to nasopharyngeal aspirates subtracted for host sequences (32). Our results clearly demonstrate that the application of NGS methods is strongly de-pendent on the type of diagnostic entity which is analyzed. BAL
fluid samples, a generally reliable source of material for the diag-nosis of pneumonia and other pulmonary infections, show a strong correlation between the percentage of NGS influenza se-quence reads and influenza qPCRCTvalues. In contrast, there was no (or only a very poor) correlation between qPCR and relative read abundance values in sputum and swab samples, even though influenza virus sequence contigs were readily recovered from these specimens. The absence of correlation is most likely the re-sult of greater heterogeneity among microbial sequences (seeFig. 1to3): Since the currently available NGS platforms can only pro-vide relative abundance values, it is to be expected that correlation with absolute quantitation values as determined by qPCR will de-crease as the variability of the nonhuman background inde-creases.
The greater heterogeneity among nonhuman sequences in swab and sputum samples is likely to reflect differences of the
FIG 5Phylogenetic tree summarizing NA sequence alignment to vaccine strain NA A/Victoria/361/2011 (GenBank accession numberKC342647.1), H3N2, and vaccine strain A/Texas/21/2012 (KC891013.1) (A) and vaccine strain A/California/4/2009 (FJ966084), H1N1 (B). (A) A total of 1,400 nucleotides were aligned by applying Clustal W alignment. The phylogenetic tree was created using neighbor-joining tree alignment and CLC workbench. Phylogenetic tree summarizing HA sequence alignment to vaccine strain HA A/Victoria/361/2011 (KC306165.1), H3N2, and vaccine strain A/Texas/21/2012 (KC891060.1) (C) and vaccine strain A/California/4/2009 (FJ966082), H1N1 (D). (C) A total of 1,701 nucleotides were aligned using Clustal W alignment. The phylogenetic tree was created using neighbor-joining tree alignment and CLC workbench. Scale bar represents substitutions per site; numbers at node points indicate the branch length.
Metatranscriptome Analysis for Pathogen Detection
on May 16, 2020 by guest
http://jcm.asm.org/
[image:10.585.75.502.70.486.2]interindividual microbiome composition as well as relatively poor sample uniformity (e.g., due to frequent but variable contamina-tion of induced sputum samples with bacteria or viruses from the pharynx). Until single-molecule high-throughput sequencing technologies which do not require library amplification (and thus will allow a more direct determination of absolute sequence abun-dance) are available, our observations thus underline the fact that, especially for highly variable diagnostic samples, classical methods such as qPCR are still required to further evaluate the results of diagnostic metagenomic or metatranscriptomic analyses.
In addition, our results demonstrate that swab samples signif-icantly differ in the amount of human sequences. While, accord-ing to ourin silicoanalysis, the human background does not gen-erally hinder the detection of pathogen reads, it nevertheless reduces the total number of nonhuman reads at a given read depth such that either the sequencing depth has to be increased or the human sequences have to be physically subtracted prior to se-quencing.
Notably, we deliberately did not employ strategies such as en-richment of viral particles by ultracentrifugation, filtration, and nuclease digestion of nucleic acid outside virion particles (33). Our goal, rather, was to use the automatic nucleic acid extraction protocols which are commonly used in routine diagnostics and to subject these diagnostic specimens to unbiased sequencing to de-tect not only viruses but also other putative pathogens. A similar approach has recently been used by Kuroda and colleagues, who analyzed a lung biopsy specimen of a patient who died because of H1N1 pneumonia (34). Unlike in our study, Kuroda et al. ana-lyzed a single sample which presumably showed a rather high viral load compared to the samples used in our study.
We successfully performed whole-genome genotyping from 8 of 17 influenza-positive samples, thereby confirming the seasonal circulating genotypes H3N2 and H1N1. Since we succeeded in recovering influenza virus whole genomes in 47% of the samples, we were able to immediately recognize new influenza virus types as a consequence of reassortment.
Furthermore, phylogenetic analysis of influenza HA and NA sequences was performed in all influenza A-positive cases to elu-cidate the sequence variation of the antigenic epitopes HA and NA during the 2012-2013 season. To our knowledge, this is the first comprehensive study to sequence complete genomes of seasonal influenza virus infections directly from diagnostic nucleic acid samples. Previous studies applying NGS with regard to influenza genome analysis were performed from smaller cohorts of pan-demic influenza cases (30), from lung tissue (34), or after subcul-turing of the virus (35–37), which is laborious; in addition, depen-dent on the viral load, not all subculturing is successful. Other approaches applied amplicon sequencing approaches to selec-tively sequence all influenza genome segments (38).
Variant calling performed on samples with higher influenza virus sequence reads identified one variant in two samples. Con-sidering the high error rates of RNA polymerase during influenza virus replication, one may expect more intrahost variants to be generated within a single infection. However, our results are in concordance with previously published studies (with most of them preselecting for influenza virus sequences) reporting a rela-tively low genetic diversity of influenza virus in patients (34,39,
40).
With regard to sensitivity, we find our results to be in concor-dance with observations made in previously published studies (30,
32,41,42). Similar to these reports, we find a strong correlation between the percentages of NGS reads mapping to influenza A sequences andCTvalues from qPCR. With the exception of one sample (sample 1,116), the influenza virus sequences from sam-ples withCTvalues⬍35 were detected by UMERS, which is com-parable to the results obtained by Greninger and colleagues. They included 17 samples (nasopharyngeal swabs) in the NGS analysis, with 15 of 17 samples containing between 105and 109viral parti-cles/ml (30). Furthermore, in a study focusing on the analysis of the human virome in febrile children, the sensitivity of unbiased NGS compared to qPCR was estimated for human adenovirus and human bocavirus sequences. A strong correlation between NGS reads andCTvalues was observed, and adenoviral sequences were detected up to aCTof 35, while human bocavirus was detected up to only aCTvalue of 30 (42). Similar results were obtained by a very recent study, in which enterovirus and rhinovirus sequences were detectable by NGS up to aCTvalue of 30 (32).
In BAL fluid samples, we observed a generally high correlation between the percentages of NGS reads matching to influenza ge-nomes and theCTvalues of RT-qPCR. We were able to detect influenza virus sequences up to aCTof 35 and assembled full-length viral genomes from samples withCTvalues as high as 31. Furthermore, our benchmarking analysis employing different numbers of influenza virus reads and mutation rates clearly dem-onstrates that our bioinformatics analysis is highly capable of de-tecting influenza viral reads at a very low abundance.
Clearly, a major advantage of sequencing total RNA moieties is the ability to analyze the presence of putative superinfecting bac-terial, viral, and fungal pathogens in a single approach. We recov-ered sequences of human-pathogenic viruses other than influenza virus in 7 samples. Human herpesvirus 1 (HSV-1), human her-pesvirus 7 (HHV-7), human parainfluenzavirus 3 (hPIV-3), hu-man rhinovirus (hRV), and respiratory syncytial virus (RSV) were identified. These viruses are well known to cause respiratory in-fections in immunocompetent patients, and HSV-1 and HHV-7 are well-known causes of respiratory infections in immunodefi-cient patients. In cases where a high viral load was observed, whole-genome information for viruses was recovered, which al-lows epidemiological evaluation of the viral infection as well as statements about putative treatments in cases where treatment is available. Interestingly, we were able to recover in one case (sam-ple 1,538)⬎56% of the HSV-1 genome, which allowed us to an-alyze the potential resistance of this virus against acyclovir. More-over, the UL23 open reading frame, encoding thymidine kinase (TK), showed 100% sequence identity (data not shown) to an HSV-1 strain recently recovered from a bone marrow transplant patient which was clinically resistant against acyclovir treatment (43).
Furthermore, we detected significant numbers of reads belong-ing to the nonpathogenic anellovirus family TT virus in one pa-tient and, in another sample, the human Merkel cell polyomavirus (MCPyV). TT viruses and MCPyV have been described in respi-ratory samples before (23,32); however, to date, there is no indi-cation that these viruses play a role in respiratory diseases.
Although one previous study by Greninger et al. included mi-crobiome analyses of pandemic influenza H1N1-positive samples (30), to our knowledge this is the first study using an unbiased NGS approach to investigate the microbiome of seasonal influ-enza A-positive diagnostic specimens. We did not observe differ-ences in the microbiome at the phylum level between the
on May 16, 2020 by guest
http://jcm.asm.org/
za-positive specimens and respiratory samples from healthy patients, as previously published (44).
BAL fluid and sputum samples were routinely analyzed by cul-ture to detect bacteria and fungi known to be involved in pneu-monia or pulmonary infections. There is a generally high concor-dance between the results obtained by culture and NGS for bacteria and fungi showing a high abundance of reads. In addi-tion, we identified 2 swab samples (which are not routinely ana-lyzed by culture) that exhibited a high abundance of reads (with 20.2% to 98.9% of all nonhuman reads belonging to a single bac-terial species) of the putative bacbac-terial pathogensS. pneumoniaeor M. catarrhalis.
Given that a large number of bacteria can colonize the naso-pharynx, a caveat of NGS-based analyses of respiratory tract sam-ples is that it is challenging to discriminate between colonization and coinfection events which may be of putative clinical relevance. While the detection of only a few unambiguously mapped reads may be sufficient to conclude that a sample is positive for a given agent, owing to the limited amount of presently available data, it is difficult to define abundance thresholds that may indicate a pathogenic infection, even if the clinical context is supportive of such a conclusion. While established conventional diagnostics, such as qPCR, suffer from the same principal limitations, exten-sive optimization and validation over several decades has led to the empirical determination of universally agreed-upon conven-tions as to when a given PCR result may be sufficient to identify a potential pathogenic infection. Hence, to implement NGS tech-nology in the clinical laboratory, there is an urgent need for studies that systematically address the standardization of NGS methods and the definition of parameters for analytical and clinical valida-tion. In addition, comparative studies are needed to determine the relative abundance of viral, bacterial, and fungal sequences not only in diagnostic specimens from patients suffering from infec-tious diseases but also in cohorts of healthy individuals.
Nevertheless, the results reported in this pilot study demon-strate that unbiased RNA sequencing is a valuable tool for com-plementing routine diagnostics, in particular in clinical or public health settings where routine diagnostics remain repeatedly neg-ative and comprehensive surveillance for emerging viruses is needed.
ACKNOWLEDGMENTS
This work was supported in part by a project grant of the German Center for Infection Research (DZIF) given to Nicole Fischer and Adam Grund-hoff.
REFERENCES
1.Metersky ML, Masterton RG, Lode H, File TM, Jr, Babinchak T.2012. Epidemiology, microbiology, and treatment considerations for bacterial pneumonia complicating influenza. Int J Infect Dis16:e321–331.http://dx .doi.org/10.1016/j.ijid.2012.01.003.
2.Seki M, Kosai K, Yanagihara K, Higashiyama Y, Kurihara S, Izumikawa K, Miyazaki Y, Hirakata Y, Tashiro T, Kohno S.2007. Disease severity in patients with simultaneous influenza and bacterial pneumonia. Intern Med46:953–958.http://dx.doi.org/10.2169/internalmedicine.46.6364. 3.Chertow DS, Memoli MJ. 2013. Bacterial coinfection in influenza: a
grand rounds review. JAMA309:275–282.http://dx.doi.org/10.1001/jama .2012.194139.
4.Dawood FS, Iuliano AD, Reed C, Meltzer MI, Shay DK, Cheng PY, Bandaranayake D, Breiman RF, Brooks WA, Buchy P, Feikin DR, Fowler KB, Gordon A, Hien NT, Horby P, Huang QS, Katz MA, Krishnan A, Lal R, Montgomery JM, Molbak K, Pebody R, Presanis AM, Razuri H, Steens A, Tinoco YO, Wallinga J, Yu H, Vong S, Bresee
J, Widdowson MA.2012. Estimated global mortality associated with the first 12 months of 2009 pandemic influenza A H1N1 virus circulation: a modelling study. Lancet Infect Dis12:687– 695.http://dx.doi.org/10.1016 /S1473-3099(12)70121-4.
5.Joseph C, Togawa Y, Shindo N. 2013. Bacterial and viral infections associated with influenza. Influenza Other Respir Viruses7(Suppl 2): S105–S113.http://dx.doi.org/10.1111/irv.12089.
6.Bartlett JG, Mundy LM.1995. Community-acquired pneumonia. N Engl J Med 333:1618–1624.http://dx.doi.org/10.1056/NEJM199512143332408.
7.Morens DM, Taubenberger JK, Fauci AS.2008. Predominant role of bacterial pneumonia as a cause of death in pandemic influenza: implica-tions for pandemic influenza preparedness. J Infect Dis198:962–970.http: //dx.doi.org/10.1086/591708.
8.McCullers JA, Rehg JE.2002. Lethal synergism between influenza virus andStreptococcus pneumoniae: characterization of a mouse model and the role of platelet-activating factor receptor. J Infect Dis186:341–350.http: //dx.doi.org/10.1086/341462.
9.McCullers JA.2006. Insights into the interaction between influenza virus and pneumococcus. Clin Microbiol Rev19:571–582.http://dx.doi.org/10 .1128/CMR.00058-05.
10. Palacios G, Hornig M, Cisterna D, Savji N, Bussetti AV, Kapoor V, Hui J, Tokarz R, Briese T, Baumeister E, Lipkin WI.2009.Streptococcus pneu-moniaecoinfection is correlated with the severity of H1N1 pandemic in-fluenza. PLoS One 4:e8540. http://dx.doi.org/10.1371/journal.pone .0008540.
11. Fischer N, Rohde H, Indenbirken D, Gunther T, Reumann K, Lutge-hetmann M, Meyer T, Kluge S, Aepfelbacher M, Alawi M, Grundhoff A. 2014. Rapid metagenomic diagnostics for suspected outbreak of severe pneumonia. Emerg Infect Dis20:1072–1075.http://dx.doi.org/10.3201 /eid2006.131526.
12. Becher P, Fischer N, Grundhoff A, Stalder H, Schweizer M, Postel A. 2014. Complete genome sequence of bovine pestivirus strain PG-2, a sec-ond member of the tentative pestivirus species giraffe. Genome Announc 2:e00376 – e00314.http://dx.doi.org/10.1128/genomeA.00376-14. 13. Eddy SR.2011. Accelerated profile HMM searches. PLoS Comput Biol
7:e1002195.http://dx.doi.org/10.1371/journal.pcbi.1002195.
14. Edgar RC.2010. Search and clustering orders of magnitude faster than BLAST. Bioinformatics26:2460–2461.http://dx.doi.org/10.1093/bioinformatics/btq461. 15. Edgar RC.2004. MUSCLE: multiple sequence alignment with high accu-racy and high throughput. Nucleic Acids Res32:1792–1797.http://dx.doi .org/10.1093/nar/gkh340.
16. Li H, Handsaker B, Wysoker A, Fennell T, Ruan J, Homer N, Marth G, Abecasis G, Durbin R.2009. The sequence alignment/map format and SAMtools. Bioinformatics 25:2078 –2079. http://dx.doi.org/10 .1093/bioinformatics/btp352.
17. Garrison E, Marth G. 2012. Haplotype-based variant detection from short-read sequencing. arXiv:1207.3907 [q-bio.GN].http://arxiv.org/abs /1207.3907
18. Robinson JT, Thorvaldsdottir H, Winckler W, Guttman M, Lander ES, Getz G, Mesirov JP.2011. Integrative genomics viewer. Nat Biotechnol 29:24 –26.http://dx.doi.org/10.1038/nbt.1754.
19. Jansen RR, Schinkel J, Koekkoek S, Pajkrt D, Beld M, de Jong MD, Molenkamp R.2011. Development and evaluation of a four-tube real-time multiplex PCR assay covering fourteen respiratory viruses, and com-parison to its corresponding single-target counterparts. J Clin Virol51: 179 –185.http://dx.doi.org/10.1016/j.jcv.2011.04.010.
20. Panning M, Eickmann M, Landt O, Monazahian M, Olschlager S, Baumgarte S, Reischl U, Wenzel JJ, Niller HH, Gunther S, Hollmann B, Huzly D, Drexler JF, Helmer A, Becker S, Matz B, Eis-Hubinger A, Drosten C.2009. Detection of influenza A(H1N1)v virus by real-time RT-PCR. Euro Surveill14:pii⫽19329.http://www.eurosurveillance.org /ViewArticle.aspx?ArticleId⫽19329.
21. Ward CL, Dempsey MH, Ring CJ, Kempson RE, Zhang L, Gor D, Snowden BW, Tisdale M.2004. Design and performance testing of quan-titative real-time PCR assays for influenza A and B viral load measure-ment. J Clin Virol 29:179 –188. http://dx.doi.org/10.1016/S1386-6532 (03)00122-7.
22. Kamali A, Holodniy M.2013. Influenza treatment and prophylaxis with neuraminidase inhibitors: a review. Infect Drug Resist6:187–198.http: //dx.doi.org/10.2147/IDR.S36601.
23. Babakir-Mina M, Ciccozzi M, Lo Presti A, Greco F, Perno CF, Ciotti M. 2010. Identification of Merkel cell polyomavirus in the lower respiratory Metatranscriptome Analysis for Pathogen Detection
on May 16, 2020 by guest
http://jcm.asm.org/
tract of Italian patients. J Med Virol82:505–509.http://dx.doi.org/10.1002 /jmv.21711.
24. Naccache SN, Greninger AL, Lee D, Coffey LL, Phan T, Rein-Weston A, Aronsohn A, Hackett J, Jr, Delwart EL, Chiu CY.2013. The perils of pathogen discovery: origin of a novel parvovirus-like hybrid genome traced to nucleic acid extraction spin columns. J Virol87:11966 –11977. http://dx.doi.org/10.1128/JVI.02323-13.
25. Smuts H, Kew M, Khan A, Korsman S.2014. Novel hybrid parvovirus-like virus, NIH-CQV/PHV, contaminants in silica column-based nucleic acid ex-traction kits. J Virol88:1398.http://dx.doi.org/10.1128/JVI.03206-13. 26. Mokili JL, Rohwer F, Dutilh BE.2012. Metagenomics and future
per-spectives in virus discovery. Curr Opin Virol2:63–77.http://dx.doi.org/10 .1016/j.coviro.2011.12.004.
27. Cox AJ, West NP, Cripps AW.2015. Obesity, inflammation, and the gut microbiota. Lancet Diabetes Endocrinol3:207–215.http://dx.doi.org/10 .1016/S2213-8587(14)70134-2.
28. Hill JM, Bhattacharjee S, Pogue AI, Lukiw WJ.2014. The gastrointesti-nal tract microbiome and potential link to Alzheimer’s disease. Front Neurol5:43.http://dx.doi.org/10.3389/fneur.2014.00043.
29. Irrazábal T, Belcheva A, Girardin SE, Martin A, Philpott DJ.2014. The multifaceted role of the intestinal microbiota in colon cancer. Mol Cell 54:309 –320.http://dx.doi.org/10.1016/j.molcel.2014.03.039.
30. Greninger AL, Chen EC, Sittler T, Scheinerman A, Roubinian N, Yu G, Kim E, Pillai DR, Guyard C, Mazzulli T, Isa P, Arias CF, Hackett J, Schochetman G, Miller S, Tang P, Chiu CY. 2010. A metagenomic analysis of pandemic influenza A (2009 H1N1) infection in patients from North America. PLoS One5:e13381.http://dx.doi.org/10.1371/journal .pone.0013381.
31. Loman NJ, Constantinidou C, Christner M, Rohde H, Chan JZ, Quick J, Weir JC, Quince C, Smith GP, Betley JR, Aepfelbacher M, Pallen MJ. 2013. A culture-independent sequence-based metagenomics approach to the investigation of an outbreak of Shiga-toxigenicEscherichia coliO104: H4. JAMA309:1502–1510.http://dx.doi.org/10.1001/jama.2013.3231. 32. Prachayangprecha S, Schapendonk CM, Koopmans MP, Osterhaus AD,
Schurch AC, Pas SD, van der Eijk AA, Povoorawan Y, Haagmans BL, Smits SL.2014. Exploring the potential of next-generation sequencing in diagnosis of respiratory viruses. J Clin Microbiol52:3722–3730.http://dx .doi.org/10.1128/JCM.01641-14.
33. Ren X, Yang F, Hu Y, Zhang T, Liu L, Dong J, Sun L, Zhu Y, Xiao Y, Li L, Yang J, Wang J, Jin Q.2013. Full genome of influenza A (H7N9) virus derived by direct sequencing without culture. Emerg Infect Dis19: 1881–1884.http://dx.doi.org/10.3201/eid1911.130664.
34. Kuroda M, Katano H, Nakajima N, Tobiume M, Ainai A, Sekizuka T, Hasegawa H, Tashiro M, Sasaki Y, Arakawa Y, Hata S, Watanabe M, Sata T.2010. Characterization of quasispecies of pandemic 2009 influenza A virus (A/H1N1/2009) byde novosequencing using a next-generation DNA sequencer. PLoS One5:e10256.http://dx.doi.org/10.1371/journal .pone.0010256.
35. Kampmann ML, Fordyce SL, Avila-Arcos MC, Rasmussen M, Willer-slev E, Nielsen LP, Gilbert MT.2011. A simple method for the parallel deep sequencing of full influenza A genomes. J Virol Methods178:243– 248.http://dx.doi.org/10.1016/j.jviromet.2011.09.001.
36. Lee HK, Tang JW, Kong DH, Loh TP, Chiang DK, Lam TT, Koay ES. 2013. Comparison of mutation patterns in full-genome A/H3N2 influ-enza sequences obtained directly from clinical samples and the same sam-ples after a single MDCK passage. PLoS One8:e79252.http://dx.doi.org /10.1371/journal.pone.0079252.
37. Rutvisuttinunt W, Chinnawirotpisan P, Simasathien S, Shrestha SK, Yoon IK, Klungthong C, Fernandez S.2013. Simultaneous and complete genome sequencing of influenza A and B with high coverage by Illumina MiSeq platform. J Virol Methods193:394 – 404.http://dx.doi.org/10.1016 /j.jviromet.2013.07.001.
38. Hoper D, Hoffmann B, Beer M. 2011. A comprehensive deep-sequencing strategy for full-length genomes of influenza A. PLoS One 6:e19075.http://dx.doi.org/10.1371/journal.pone.0019075.
39. Fordyce SL, Bragstad K, Pedersen SS, Jensen TG, Gahrn-Hansen B, Daniels R, Hay A, Kampmann ML, Bruhn CA, Moreno-Mayar JV, Avila-Arcos MC, Gilbert MT, Nielsen LP.2013. Genetic diversity among pandemic 2009 influenza viruses isolated from a transmission chain. Virol J10:116.http://dx.doi.org/10.1186/1743-422X-10-116.
40. Ramakrishnan MA, Tu ZJ, Singh S, Chockalingam AK, Gramer MR, Wang P, Goyal SM, Yang M, Halvorson DA, Sreevatsan S.2009. The feasibility of using high-resolution genome sequencing of influenza A vi-ruses to detect mixed infections and quasispecies. PLoS One4:e7105.http: //dx.doi.org/10.1371/journal.pone.0007105.
41. Cheval J, Sauvage V, Frangeul L, Dacheux L, Guigon G, Dumey N, Pariente K, Rousseaux C, Dorange F, Berthet N, Brisse S, Moszer I, Bourhy H, Manuguerra CJ, Lecuit M, Burguiere A, Caro V, Eloit M. 2011. Evaluation of high-throughput sequencing for identifying known and unknown viruses in biological samples. J Clin Microbiol49:3268 – 3275.http://dx.doi.org/10.1128/JCM.00850-11.
42.Wylie KM, Mihindukulasuriya KA, Sodergren E, Weinstock GM, Storch GA.2012. Sequence analysis of the human virome in febrile and afebrile children. PLoS One7:e27735.http://dx.doi.org/10.1371/journal .pone.0027735.
43. Sauerbrei A, Bohn K, Heim A, Hofmann J, Weissbrich B, Schnitzler P, Hoffmann D, Zell R, Jahn G, Wutzler P, Hamprecht K.2011. Novel resistance-associated mutations of thymidine kinase and DNA polymer-ase genes of herpes simplex virus type 1 and type 2. Antivir Ther16:1297– 1308.http://dx.doi.org/10.3851/IMP1870.
44. Lemon KP, Klepac-Ceraj V, Schiffer HK, Brodie EL, Lynch SV, Kolter R.2010. Comparative analyses of the bacterial microbiota of the human nostril and oropharynx. MBio 1:pii⫽e00129-10. http://dx.doi.org/10 .1128/mBio.00129-10.