Hungarian Association of Agricultural Informatics European Federation for Information Technology in Agriculture, Food and the Environment
Journal of Agricultural Informatics. 2015 Vol. 6, No. 2 journal.magisz.org
Gender Analysis of Agricultural Innovation and Decision Making among Rice
Farming Household in Nigeria
Oluwafemi Ajewole
1, Opeyemi Ayinde Eyitayo
2,
Vivian Ojehomon
3,
Rita
Agboh-Noameshie
4,
Aliou Diagne
5I N F O
Received 26 Febr 2015 Accepted 22 Apr 2015 Available on-line 29 Jun 2015 Responsible Editor: M. Herdon
Keywords:
Decision Making, Gender, Innovation, Nigeria, Rice farming households.
A B S T R A C T
Rice importance in food security and contribution to Nigeria economy cannot be overlooked, rice is produced in Nigeria but productivity increase has been a challenge due to many factors. Actors involved in the production process include women who are faced with formidable obstacles. This research analyze agricultural innovation, constraints faced by male and female rice farming households and decision making among rice farming household in Nigeria rice hub. A 3-stage stratified random sampling procedure were used, descriptive statistics, Ordinal Ranking, Least Significant Difference and Women empowerment index were the tool of analysis. The study showed that 23.81% of the respondents are feheaded and 76.19% are male-headed; more than half of the women (54.29%) are without formal education as compared to men (25.89%). Only 13.39% and 8.57% of the male and female headed household use rice innovation; access to credit, high cost of input and poor soil fertility are the major constraints; women empowerment results showed 76.60% of decision is made by solely by male head, 7.80% is made by female and 7.09% of decisions are jointly made. The study recommends that; innovation usage should be advocated, subsidy should be intensified and gender consideration in decision making be made a priority.
1.
Introduction
Nigeria is the most populous country in Africa, with a population of about 168 million people. Its domestic economy is dominated by agriculture, which accounts for about 40% of the Gross Domestic Product (GDP) and two-thirds of the labour force. Agriculture supplies food, raw materials and generates household income for the majority of the people (Federal Office of Statistics, 2012). Over the years, improvement in agricultural production has led to specializing in certain crops or products; maize, cowpea, sorghum, rice, etc. (Plucknett et al., 2000). Rice has emerged as one of the fastest growing agricultural sub-sector, it has moved from a ceremonial to a staple food in many homes, such that some families cannot do without rice in a day. (Idiong et al., 2006). Rice is produced in Nigeria using a variety of rice production systems and technological levels coexisting together, the production involve a chain of activities ranging from land clearing to post harvest activities such as winnowing,
1Oluwafemi Ajewole University of Ilorin
[email protected] 2Opeyemi Ayinde Eyitayo University of Ilorin [email protected] 3Ojehomon Vivian E. Titilayo
National Cereals Research Institute (NCRI) Badeggi, Bida, Niger State, Nigeria [email protected]
4Rita Agboh-Noameshie
Leader, Gender Task force, Africa Rice Centre, Cotonou, Benin, Republic [email protected]
5Aliou A. Diagne
threshing among others which is been done by male and female small holder farmers who use traditional manual methods that are characterized with problems of low productivity and consequently poor livelihood (World Bank, 2013). Increase in production has been achieved largely through extending the area under cultivation rather than using productivity-improving technologies (FAO, 1999). Within this production cycle, women have been reported playing vital roles in rice production, processing and marketing.(Rahman 2004) However, women have limited access to a wide range of physical assets including agricultural inputs, technological resources, land, and so forth (Arndt & Tarp, 2000). Women are a key part of the mainstream in agriculture, yet they face formidable obstacles (Kandiwa, 2013). Ayinde et al. (2013a) opined that, it is of importance to have strategy to put men and women’s concerns and experiences at the centre of research design, implementation, monitoring, and evaluation. This involves looking at the socioeconomic settings of men and women to ensure that they benefit equally – often referred to as “gender mainstreaming”. Bridging the gap in access to technology between men and women, we could increase productivity; Ayinde et.al. (2013b) further affirmed that technological adoption among male and female farmers is crucial to improving the productivity in the face of climate change. Transformation lies in using innovation to improve the products and services delivered by men and women who are actors in rice production. However, the prevailing condition in Nigeria is characterized with gender blindness, deafness and dumbness in the formulation and implementation of most rice productivity policies (Ajani, 2008). Despite the effort to intensify increase in rice productivity, the demand for rice has been on the increase in the country and sadly Nigeria has not been able to produce enough rice for the domestic need of her teaming increasing population. Recognition of gender disaggregated constraints, gender imbalances, differentials in gender roles and decision making as related to rice production, technological transfer; input used, method of farming, processing is important for any transformation of Nigeria rice sector. It is against this background the study to answer the following; what are the socio-economic characteristics of male and female headed rice farming household in the study area? What are the available rice innovations? and the level of women participation in decision making within the rice farming households which has not been carried out in this rice hub before now.
2.
Theoretical Framework
This study is based on the theory of production, which states that, given level of technology and production inputs, an efficient producer will achieve maximum production of outputs. This theory assumed effects of external and internal factors on different households (especially smallholder farmers) in agricultural production (Quisumbing, 1996). A production function is a technical relationship between inputs and outputs that specifies the maximum level of output possible, given input levels. The production function shows the ability of a farm manager to critically consider available production resources, make necessary decisions and produce output, given level of technology (Auma, 2010).
There are two approaches to production function, the primal (direct estimation of production function) and dual approach (indirect estimation of production function through profit or cost function). Most studies on analysis of gender effects on agricultural productivity used primal approach to production function and the application of dual approach is quite recent (Quisumbing, 1995). Primal-approach to production function analyzes and estimates directly the production functions of a farm manager (gender of household head) i in household j
Yij = f (Vij, Xij, Zj)
Where Yij is quantity produced,
Vij is a matrix of inputs used by farm manager in household j, including land, labour, capital, and extension advice;
Xij is a matrix of individual attributes, including gender; and
Zj are household-and community–level variables. Correlation of input use with individual and household characteristics can be captured by interaction terms ViXi and ViZj respectively.
The study used the dual approach to production analysis, it estimates profit function as a function of input and output prices, and derives the input demand and output supply functions from the restricted profit function. This approach has its advantages when there are multiple outputs and inputs, as in a multi-crop farming system. Modelling input choice explicitly also allows for the possibility that farmer characteristic influence the decision making process of conventional inputs.
Y = α0Lα1Tα2 Where Y is output,
L is labour input (hired or family),
T is a matrix of land, capital, and other conventional inputs which include decision making.
Usually the equation is estimated by ordinary least squares (OLS) by linearizing the Cobb-Douglas production function:
lnY = α0+ α1lnL+ α2lnT+ βlnE+ δSEX+ ε Where Y, L, and T are as defined above;
E is educational attainment or indicator variable for level of schooling (of farm manager, or household head);
SEX is the sex of household head or farm manager; and
2.1.
Conceptual Framework
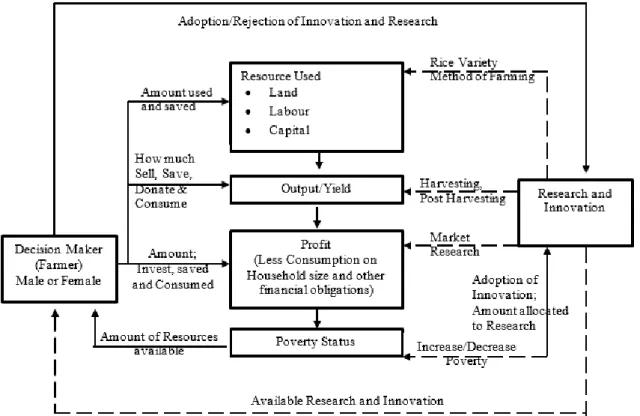
Figure 1. Source (Author, 2013) adapted from Olayide and Heady input-output process (1982)
The concept of this study is presented in Figure 1, agricultural activity as it shown as the combination of resources to yield an output and subsequent profit. These however determine the poverty status of the farmer. Decision maker (which represent the farmer with their respective sex), Research and Innovation envelopes agricultural activities. The effect of farmer’s decision on the adoption of Innovation; the use of productive resources; output; profit and subsequent poverty status of any decision maker is represented above with undotted arrows; the effect of Innovation on; productive resources; Output; profit; poverty status; and its subsequent effect on the decision maker is represented by the dotted arrows.
3.
Methodology
3.1.
Study area
The study was carried out in the Nasarawa/Benue rice hub of Nigeria. Rice Sector Development Hubs are zones where rice research outputs are integrated across the rice value chain to achieve development outcomes and impact. The Hub involves large groups of farmers and other value-chain actors, such as rice millers, input dealers and rice marketers (Cisse & Diagne 2012). The rice hub shares in the benefits of the Benue river valley for rice production. The Nasarawa/Benue hub is made up of four local government areas of Guma and Gwer-west in Benue state and Lafia and Obi Local government areas in Nasarawa state. Benue state is located within longitude 7° 47’ and 10° 0’ East and Latitude 6° 25’ and 8° 8’ North while Nasarawa state is located within 8°32′ and 8.533°North and 8°18′ and 8.3°East. The states are among the North Central States of Nigeria and are highly agrarian with a large percentage of their populace engaged in rice farming and other agricultural activities. Both states share a common boundary and have rich and diverse agricultural produce.
3.2.
Sampling
A three-stage stratified random sampling procedure was used for this study. Local extension offices were visited to collect the list of villages and household in each village in the two states (the hub).Villages where rice is not produced or grown was dropped. The remaining list of villages was stratified based on; dominance of rice production. The villages were grouped into two; (rice in the target ecology as major crop; rice in the target ecology as minor crop). This resulted into two strata. In each stratum, eight villages was randomly selected using Microsoft excel worksheet to form a total of sixteen villages. Within these sixteen villages, ten households was randomly selected with a minimum of three household headed by women giving a total one hundred and sixty respondents (160) and at least thirty per cent of women headed household farmers.
3.3.
Source of data
The study used primary data from the NCRI/Africa Rice baseline survey during which tablet computers were used to obtain information from the rice farming households. Africa Rice Centre in 2012 developed the Mlax application in Tablet computers to collect baseline data in the Rice Sector in Africa. The Mlax application is designed with such flexibility such that data collected are automatically sent to a cloud server after connecting the tablets to the internet.
3.4.
Method of Data Analysis
Descriptive Statistics was used to investigate the socio-economic characteristics of male headed and female-headed rice farming household and available rice innovation, Likert ranking was done to rank the constraints faced by rice farmers while Least Significant Difference (LSD) was used to test for the significance level of the ordinal ranking of the constraints at 5% level of significance. Women empowerment index was used to examine the participation of women in agricultural decision within the households.
3.5.
Likert scale and Least Significant Difference (LSD)
Constraints facing the rice farmers were asked to be listed and the three most important constraints to the farmers was identified in their order of occurrence. The relative frequency with which a constraint was experienced was used to establish its ordinal rank. Least significance difference (LSD) was used to test the ranking for statistical significance using the method represented in pair-wise comparison at 5% level of significant. The LSD expression is given by:
LSD (at α = 0.05) = 1.96 x (SF(n) x (n+1)/6)1/2, Where:
3.6.
Computation of the Women Empowerment Index (WEI) following International
Food Policy Research Institute (IFPRI 2011)
The WEI sub-index shows how empowered women are, capturing the roles and extent of women’s engagement in the agricultural sector in five domains: (1) decisions over agricultural production, (2) access to and decision-making power over productive resources, (3) control over use of income, (4) leadership in the community, and (5) time use. It assesses the degree to which women are empowered in these domains, and for those who are not empowered, the percentage of domains in which they are empowered.
𝑊𝐸𝐼𝑎𝑙𝑙 =
∑𝑛𝑗=1𝑥𝑗
𝑑
Where:
WEI all = women empowerment index for all decisions per respondent
x = value of decision maker
j = code for the specific decision matter
d = total number of decisions replied by the respondent n = number of decisions.
The value ranges from 1.00 to 5.00
• A value of 1.00 means that the male head tend to be the sole decision maker.
• Any value below 3.00 but higher than 2.00 means that female heads join in making the decisions but the decision of the male head dominates.
• A value of 3.00 means both the female and the male head makes the decision jointly with equal contribution.
• A value near 5.00 and higher than 3.00 means that the female head dominates in decision making than the male head.
• A value of 5.00 means the female head is the sole decision maker.
4.
Results and Discussion
Majority of the respondent’s household (76.19%) are male-headed, only about 23.81% of the respondents are female-headed suggesting that the involvement of women in rice farming in the study area is low; more than half of the women (54.29%) are without any form of formal education as compared to the men (25.89%). More than half of the male (52.68%) and female (68.57%) farmers do not belong to any form of association. This implies that they do not have the advantages of what groups could offer in term of; training, credits, mobilization of resources and dissemination of necessary information. On the average the rice area cultivated by both male headed household and female headed household are 3.05Ha and 2.58Ha and the mean household is 9 members for male-headed households and 7 for female-male-headed households. Averagely, 85.71% and 88.59% of male and female rice farmers have access to one form of improve variety or the other as shown in Table 1.
Table (1). Socio-Economic Characteristics of rice farming households
Householdhead Sex
Frequency Percentage
Female 35 23.81
Male 112 76.19
Total 147 100
Male Female
Age Frequency Percentage Age Frequency Percentage
≤30 8 7.13 ≤30 0 0
31-40 27 24.12 31-40 3 8.57
51-60 24 21.44 51-60 12 34.29
61-70 17 15.17 61-70 5 14.3
≥71 5 4.45 ≥71 1 2.83
Total 112 100 Total 35 100
Mean 49.08929 Mean 54.17143
Std. Dev. 13.64713 Std. Dev. 8.678865
Membership of Association Membership of Association
No 59 52.68 No 24 68.57
Yes 53 47.32 Yes 11 31.43
Total 112 100 Total 35 100
Education Level Education Level
Junior high school 8 7.14 Junior high
school 3 8.57
Literate/Koranic 9 8.04 Literate/Koranic 0 0
None 29 25.89 None 19 54.29
Primary 23 20.54 Primary 6 17.14
Senior high school 24 21.43 Senior high
school 4 11.43
Tertiary 19 16.96 Tertiary 3 8.57
Total 112 100 Total 35 100
Household Size Household Size
≤5 27 24.1 ≤5 12 34.29
6 – 10 50 44.65 6 – 10 17 48.55
11 – 15 28 25 11 – 15 4 11.44
16 -20 6 5.36 16 -20 1 2.86
≥21 1 0.89 ≥21 1 2.86
Total 112 100 Total 35 100
Mean 8.839286 Mean 7.257143
Std. Dev. 3.960511 Std. Dev. 4.513658
Rice Cultivated Area Rice Cultivated Area
≤2 62 55.36 ≤2 21 60
3 – 4 31 27.68 3 – 4 11 31.43
5- 6 8 7.14 5- 6 2 5.71
7-8 5 4.46 7-8 0 0
≥9 6 5.36 ≥9 1 2.86
Total 112 100 Total 35 100
Mean 3.047411 Mean 2.577143
Std. Dev. 2.539682 Std. Dev. 2.11338
4.1.
Analysis of Rice Innovation in the study area
study area. The result shows that male and female rice farming household considerably uses most of the improved varieties present in the study area. Larger percentage of the surveyed female rice farming households (88.57%) use improved varieties than the male rice farming household (85.71%) 13.39% and 8.57% respectively. Further test shows that there is no significant difference in the use of the NERICA variety by both male and female rice farming households. The implication of this is that innovation in rice farming has not been properly utilized in the study area.
Table 2. Technology and Innovation in Rice Farming
Distribution of Rice farming Household according to the use of All Improved Variety except NERICA
Gender Frequency Percentage t-value
Female
Non-use 32 91.43
Use 3 8.57
0.118
Total 35 100
Male
Non-use 97 86.61
Use 15 13.39
Total 112 100
Distribution of Rice farming Household according to Use of NERICA Variety
Gender Frequency Percentage t-value
Female
Non-use 4 11.43
0.383
Use 31 88.57
Total 35 100
Male
Non-use 16 14.29
Use 96 85.71
Total 112 100
4.2.
Decision Making Analysis
Level of Women control over productive resources; ownership of the land and other productive assets. Decision making is important in productive process. Ability to make decision as to the use of resource and product from farm is important to know the gender empowerment within the household. Table 3 presents the women involvement about decision making within the household, the decision studied include; control over productive resources (land, capital structures as well as their involvement in decision as to the use, acquisition, rent or sale of such resources); decision of types of variety to be grown by the household and the ecology; plot management (planting, fertilizer application, irrigation, weeding and harvesting); distribution of farm output; decision about income from plot; total household income; other general agricultural decisions.
male dominating such decisions represent 3.68%. 79.31% of decisions of choice of innovation to be used in rice farming (type of variety and ecology) is solely taken by the male, 0.86% of the decision is made by the female, 7.76% is jointly made with equal contribution from both the male and the female, 2.59% is jointly made with male dominating the decision, 0.86% are jointly made with the female dominating. 81.88% of the plot management decision is solely made by males, 8.70% is solely made by females, 7.24% is jointly and equally made while 2.17% of plot management decision is made jointly but the male dominates. Farmers after harvesting distribute the output into categories; the amount to be sold, the amount to be saved as seed, the amount to be given as donation and the amount to consume within the household. 80.70% of distribution decisions are solely made by the male head, 10.53% are solely made by the female head, 6.14% of such decisions are jointly made with equal contribution, 1.75% is jointly made with the female head dominating, 0.88% is jointly made with the male head dominating. More than half of the decision as touching the income generated from the plot is solely made by male head (80.74%), 8.89% is solely made by the female head; 7.41% is jointly made with the male and female head having the same percentage of contribution. 2.22% of farm income decision is jointly made but the male dominates while 0.74% of the decision is jointly made but with women dominating. On household income, 78.44% of the income decisions are solely made by the male head, 10.34% of the decision is made by the female head, 6.90% are jointly decided, 2.59% are jointly made with the male dominating and 1.74% are jointly decided with the female dominating. On the general agricultural decision made, 76.60% of agricultural decision is made by solely by male head, 7.80% of agricultural decision is solely made by female, 7.09% of the agricultural decision is made jointly by both male and female head of the household. Decisions made jointly by the male and the female household head with male dominating such decision represent 6.38% while only 2.13% of the household decision as related to agricultural activities are jointly decided by females with males dominating. The result of the women empowerment index shows the marginalization of women in decision making as touching agricultural activities in the household. These results agree with (Rahman, 2008; Ani, 2003)
Table 3. Results of the Women Empowerment Index (Decision Making)
Decision Making About; Freq. Percentage Cum.
Productive Resources
Male Alone 109 80.15 80.15
Joint but male Dominating 5 3.68 83.82
Joint with equal contribution 11 8.09 91.91
Female alone 11 8.09 100
Total 136 100
Choice of innovation
Male Alone 92 79.31 79.31
Joint but male Dominating 3 2.59 81.9
Joint with equal contribution 9 7.76 89.66
Joint with female dominating 1 0.86 90.52
Female alone 11 9.48 100
Total 116 100
Plot management plot
Male Alone 113 81.88 81.88
Joint but male Dominating 3 2.17 84.06
Joint with equal contribution 10 7.25 91.3
Female alone 12 8.7 100
Total 138 100
Male Alone 92 80.7 80.7
Joint but male Dominating 1 0.88 81.58
Joint with equal contribution 7 6.14 87.72
Joint with female dominating 2 1.75 89.47
Female alone 12 10.53 100
Total 114 100
Distribution of income from plots
Male Alone 109 80.74 80.74
Joint but male Dominating 3 2.22 82.96
Joint with equal contribution 10 7.41 90.37
Joint with female dominating 1 0.74 91.11
Female alone 12 8.89 100
Total 135 100
Household income
Male Alone 91 78.45 78.45
Joint but male Dominating 3 2.59 81.03
Joint with equal contribution 8 6.9 87.93
Joint with female dominating 2 1.72 89.66
Female alone 12 10.34 100
Total 116 100
General agricultural practices
Male Alone 108 76.1 76.6
Joint but male Dominating 9 6.3 83
Joint with equal contribution 10 7 90.1
Joint with female dominating 3 2.1 92.2
Female alone 11 7.7 100
Total 141 99.3
5.
Summary and Conclusion
The study revealed that despite the available rice technologies present, the use of recent rice innovation (NERICA variety) by farming household is low; Technological interventions aiming to improve livelihoods that bring gender equity can become successful only when the prevailing gender roles in society and access to different livelihood opportunities are fully understood. Aside households whose head are majorly women, the result of the women empowerment index women are not justifiably included in decision making as touching agricultural activities in the household. It is therefore recommended that if progress will be made in rice production across the value chain, innovation usage should be properly advocate, subsidy should be intensified and women consideration in decision making to foster their empowerment should not be a matter of propaganda in policy, it should rather be a priority.
Acknowledgement
References
Ajani O.I.Y. (2008) Gender Dimensions of Agriculture, Poverty, Nutrition, and Food Security in Nigeria. Available online at [email protected]. Accessed on 30th January 2013.
Ani, A.O. (2003). Taking farm decisions and socioeconomic characteristics of rural women farmers in Southern Ebonyi State, Nigeria. International Journal of Agriculture and Biology. Vol 5, No 4, pp. 645-649.
Arndt C. & Tarp F. (2000) Agricultural technology, risk and gender: A CGE analysis of Mozambique, World Development. Vol. 28, No.7, pp. 1307-1326. doi: 10.1016/s0305-750x(00)00017-6
Ayinde, O.E, Abduolaye T., Olaoye, G., Akangbe, J.A. (2013a) Gender and Innovation in Agriculture: A Case Study of Farmers’ Varietal Preference of Drought Tolerant Maize in Southern Guinea Savannah Region of Nigeria. Albanian J. Agric. Sci. Vol.12, No 4, pp. 617-625.
Ayinde O.E., Ojehomon V.E.T., Daramola, F. S. Falaki, A.A. (2013b) Evaluation of the Effects of Climate Change on Rice Production in Niger State, Nigeria. Ethiopian Journal of Environmental Studies and Management. Vol 6., pp. 763 – 773. doi: 10.4314/ejesm.v6i6.7s
Cisse B., Arouna, A., Diagne A. (2012) Rice Sector Development Hubs; Overview of Hub Activities and Selected sites in the countries. 2012 AfricaRice Science Week and GRiSP-Africa Science Forum 1-5 October 2012, Cotonou, Benin, p 3.
Federal Office of Statistics. (2013) Poverty Profile for Nigeria 1980-1996 (19990Lagos: www.nigerianstat.gov.ng. Accessed April 14th, 2013.
Federal Office of Statistics. (2012) Gross Domestic Product for Nigeria. Available at www.nigerianstat.gov.ng. Accessed April 14th, 2013.
Idiong, C. I., Damian, J.A., Susan, B. O. (2006) Comparative Analysis of Technical Efficiency in Swamp and Upland Rice Production System in Cross River State, Nigeria. Proceedings of Farm Management Association of Nigeria (FAMAN), September, 18th – 21st 2006, Jos, Plateau State, pp. 30-38.
International Food and Policy Research IFPRI. (2011) Engendering Agricultural Research, Development, and Extension, Washington, DC 20006-1002, USA, pp. 1-54. Available online at http://www.ifpri.org/sites/default/files/publications/rr176.pdf. Accessed October 12th, 2013. doi: 10.2499/9780896291904
Kandiwa V. (2013) Mainstreaming gender in maize improvement research CIMMYT Report. http://dtma.cimmyt.org/index.ptent/article/110-news-articles/158-mainstreaming gender-in-maize-improvement-research-MMKN. (Accessed January 12, 2013).
Plucknett D.L., Philips, T.P., Kagbo, R.B. (2000) A Global Development Strategy for Cassava: Transforming a Traditional Tropical Root Crops. Spurring Rural Industrial Development and Raising Incomes for the Rural Poor. pp. 1-130.
Rahman, S.A., Gabriel, J., Marcus. N.D. (2004) Gender differentials in labour, contribution and productivity infarm production. Empirical evidence from Kaduna State of Nigeria. Paper presented at the National Conference on Family at makurdi, Nigeria. 1st-5th March 2004.
Rahman, S.A. (2008) Women's involvement in agriculture in Northern and Southern Kaduna State, Nigeria. Journal of Gender Studies. Vol 17, No 1, pp. 17–26. doi: 10.1080/09589230701838347
Tavva, S., Abdelali-Martini, M., Aw-Hassan, A. Rischkowsky, B., Tibbo, M., Rizvi, J. (2013) Gender Roles in Agriculture: The Case of Afghanistan. Indian Journal of Gender Studies. Vol 20, No 1, pp. 111-134. doi: 10.1177/0971521512465939
World Bank. (2013) Poverty Overview. Available online at