ARTICLE
Type 1 diabetes mellitus (T1DM) is among the most frequent chronic non-infectious diseases in children.[1] There appears to be
a worldwide increase in T1DM in children and adolescents.[2] The
incidence of T1DM is currently estimated at 5 new cases per 100 000 in the Western Cape, South Africa (SA), compared to 2 - 35 new cases per 100 000 worldwide.[3]
Once a patient has been diagnosed with T1DM, it is important to gain adequate metabolic control to delay the onset and limit the progression of complications resulting from the disease.[4] To this
end, the International Society for Pediatric and Adolescent Diabetes (ISPAD) recommends that a multidisciplinary diabetes care team (DCT) should be established, consisting of a diabetes specialist, a diabetes nurse educator (DNE), a dietitian and a social worker.[5,6]
Including a DNE in the team has been shown to be effective in reducing the error rate in blood glucose measurements[7] and the
duration of hospitalisation in both children and adults.[8-11] In adult type
2 diabetes patients, marked improvements in glycated haemoglobin (HbA1c) levels have been observed after a DNE had participated in their routine diabetes care.[11-14] This result is supported by
findings that showed a primary nurse practitioner succeeding in implementing the recommendations of the Diabetes Control and Complications Trial (DCCT) in paediatric diabetes patients within 1 year, resulting in a significant decrease in HbA1c.[15] It has further been
shown that a DNE’s regular telephone contact with poorly controlled T1DM patients had a delayed rather than an immediate beneficial effect.[16] A direct link between HbA1c levels and the number of visits
to a DCT per year has been shown in the paediatric population.[17]
In adult T1DM patients, onset of complications was delayed when specialist care was maintained after childhood[18] and a decrease
in retinopathy and microalbuminuria has been demonstrated in adolescent patients irrespective of better glycaemic control.[19,20] The
impact of management by a DNE or DCT on hospital admission and diabetic ketoacidosis (DKA) rates, especially in the paediatric age group, seems to be poorly documented.
Tygerberg Children’s Hospital (TCH) introduced a DCT consisting of a paediatric endocrinologist, a dietitian and a social worker in August 2007. Owing to financial constraints, a DNE could be appointed only in August 2009. It was hypothesised that the introduction of a full DCT for children and adolescents with T1DM at TCH would improve patients’ HbA1c levels, reduce hospital admission and DKA rates, and decrease the prevalence of complications.
Methods
Study design
This was a retrospective cohort study (with cross-sectional elements) of 190 T1DM children and adolescents attending the paediatric diabetes clinic at TCH, Cape Town, from August 2004 to July 2011. Participants were included if:
• they required insulin therapy after the neonatal period but before adolescence, irrespective of whether T1DM was confirmed on low serum C-peptide levels and elevated antiglutamic acid decarboxylase/islet antigen 2 antibodies
Background. A diabetes care team (DCT) may contribute to improved glycaemic control in type 1 diabetes mellitus (T1DM) patients. Hence a DCT was introduced at Tygerberg Children’s Hospital (TCH) in 2009.
Hypothesis. A DCT for T1DM patients improves HbA1c, reduces admission and diabetic ketoacidosis (DKA) rates and insulin dose, and decreases the prevalence of complications.
Methods. In this retrospective cohort study, records of 190 T1DM patients attending the paediatric diabetic clinic at TCH between August 2004 and July 2011 were reviewed. Data extracted include: glycated haemoglobin (HbA1c) levels; total number of admissions; DKA and recurrent DKA (rDKA) admissions; insulin regimen and dose; and presence of complications. Four periods, in which specific changes to team composition occurred, were compared.
Results. HbA1c levels increased from 9.0% (7.85 - 10.15) in P1 to 10.9% (9.6 - 12.2) in P2, but decreased to 9.3% (8.75 - 9.75) in P4 (p=0.02). The number of admissions decreased from 0.79 (0.46 - 1.12) to 0.18 (0.02 - 0.34) (p=0.01). The DKA rate decreased from 32.5/100 patient years to 23.5/100 patient years. The rDKA rate decreased from 18.8% in P1 to 9.6% in P4. Daily insulin injections increased from 2.97 (2.85 - 3.01) to 3.06 (3.06 - 3.23) (p=0.01). The mean insulin dose decreased from 1.19 (1.08 - 1.31) to 0.93 (0.87 - 1.00) units/kg/day (p=0.00). Conclusion. After the introduction of the DCT, HbA1c levels were less variable and hospital admission and DKA rates decreased. Improvements were achieved with a multiple injection regimen at a lower daily insulin dose.
S Afr J Child Health 2019;13(1):11-16. DOI:10.7196/SAJCH.2019.v13i1.1492
The impact of a diabetes care team on the glycaemic
control of paediatric and adolescent patients with
type 1 diabetes mellitus at Tygerberg Children’s
Hospital
Z Kajee,
1MB ChB, FCPaed (SA), MMed (Paeds), Cert Neonatology; J Harvey,
2MCom, PhD;
E W Zöllner,
1MB ChB, DCH, DTM&H, DPH, MMed (Paeds), PhD (Paeds)
1 Department of Paediatrics and Child Health, Faculty of Medicine and Health Sciences, Tygerberg Hospital and Stellenbosch University,
Cape Town, South Africa
2 Department of Statistics and Actuarial Science, Faculty of Economics and Management Sciences, Stellenbosch University, Stellenbosch,
South Africa
Corresponding author: E W Zöllner ([email protected])
ARTICLE
• they were managed during the following periods:
August 2004 - July 2005 (P1) – only a paediatric endocrinologist
on site
August 2007 - July 2008 (P2) – introduction of the DCT August 2009 - July 2010 (P3) – DNE included in the team September 2010 - July 2011 (P4) –DNE changed.
Patients with type 2, neonatal or monogenetic diabetes were excluded from the study.
The diabetes care team
The paediatric endocrinologist, registrar and intern were primarily responsible for the medical care of each patient, while the DNE educated the patients about diabetes and trained them in the necessary skills for managing the condition. The dietitian provided dietetic input. The social worker intervened whenever social or behavioural issues were identified. Patients were seen at least 4 times per year.
Data collection
The hospital records of the identified patients were reviewed to capture the following data: age; sex; age at diagnosis; ethnicity; types of insulin; number of injections per day; insulin dose; mean HbA1c level at the end of each period; hospital admissions due to DKA or poor control; prevalence of DKA and recurrent DKA (rDKA); mean urine albumin–creatinine ratio (UAC) at the end of each period; presence of retinopathy, neuropathy and limited joint mobility (LJM); fasting total serum cholesterol; low-density lipoprotein (LDL) cholesterol; high-density lipoprotein (HDL) cholesterol; and triglycerides. The cholesterol and triglyceride levels were categorised as high or normal according to Mayo Clinic criteria.[21]
Complication assessment was performed annually, starting 5 years after onset of T1DM in prepubertal patients and 2 years after onset of T1DM in pubertal patients. Microalbuminuria was defined by a UAC level >2 mg/mmol in two early-morning urine samples (taken at consecutive clinic visits). Retinopathy was initially confirmed visually by an ophthalmologist, but replaced by fundal photography from P4. Neuropathy was initially tested for by assessing pain and touch sensation. Vibration sense testing was introduced late in P3. LJM was determined qualitatively according to the prayer manoeuvre.
Glycated haemoglobin measurements
Before 2009, HbA1c levels were measured by the local laboratory using an assay standardised to the DCCT assay and certified by the National Glycohemoglobin Standardization Program. From 2009, HbA1c levels were analysed with the DCA Vantage Analyzer point-of-care device (Siemens, USA). The results of the two methods were compared in 35 subjects. The within-assay coefficient of variation (CV) was 1.2% for an HbA1c level of 5.1% and 4.3% for an HbA1c level of 12.9%. The between-assay CV was 2.4% and 3.2% for the two reference levels, respectively (personal communication from MA van Rensburg).
Statistical analysis
Data were collated in a spreadsheet and analysed using Statistica version 12 (Dell, USA). Continuous data were analysed descriptively using means and standard deviations with 95% confidence intervals (CIs) to estimate the true population mean. Frequency distributions were used to describe ordinal and nominal data. A significance level of p<0.05 was applied throughout.
The primary objective was to compare variables between the four treatment periods. As the same patient was observed in more than one period, the observations between periods for a particular patient are dependent. The Friedman analysis of variance (ANOVA) was therefore used to compare changes between the
different periods. However, owing to missing data, recruitment over time and patient dropout, there were only a few patients who had observations in all four periods for all variables. Combinations of the periods were therefore tested. Periods P1, P2 and P3 were compared using Friedman’s ANOVA, as were P2, P3 and P4. Box-and-whisker plots were used to illustrate these comparisons graphically.
For all other comparisons of continuous variables between two groups, the Mann–Whitney U test was used, and for more than two groups the Kruskal–Wallis ANOVA was applied. Comparison of two nominal variables was performed using a chi-square test and a Fisher’s exact test for the 2x2 contingency tables. HbA1c levels were compared against sex and LJM (including the interaction) using multiple regression (this comparison was necessary because of a sex difference in the prevalence of LJM).
Ethical approval
Ethical approval was obtained from the Health Research Ethics Committee at Stellenbosch University (ref. no. N11/09/273).
Results
The records of 190 paediatric and adolescent T1DM patients were assessed over the four periods. In each period, new patients were diagnosed, others were lost to follow-up and some were transferred to the adult service. Not every patient was seen during every period, resulting in varying patient numbers per period. Patient numbers increased cumulatively over time: we saw 77 patients in P1 and 139 patients in P4. Ethnic or gender composition of the sample (Table 1) did not affect the outcome of the statistical analysis, except with regard to LJM, found in 60% (95% CI 43.3 - 75.1) of boys and 37.5% (95% CI 26.4 - 50.0) of girls (p=0.0291). This difference was not related to worse glycaemic control in boys.
Table 1. Patient characteristics at study entry (N=190)
Characteristic n (%)
Age at diagnosis (years)*
<2 15 (8)
2 - 10 88 (46.3)
≥10 86 (45)
Age category organised according to gender (years)*
Boys <12 49 (25.8)
Boys >12 17 (8.9)
Girls <11 88 (46.3)
Girls >11 35 (18.4)
Gender
Male 66 (34.7)
Female 124 (65.3)
Ethnicity
Mixed ancestry 143 (75.3)
Black 25 (13.2)
White 22 (11.6)
Types of insulin therapy* Short-acting
Human soluble insulin 164 (86.8)
Rapid-acting insulin analogue 25 (13.2) Longer-acting
NPH† insulin 181 (95.3)
Long-acting insulin analogue 9 (4.7)
ARTICLE
Glycaemic control
The mean HbA1c level across all patients was 9.9% (95% CI 9.1 - 10.8) in P1, 11.7% (95% CI 10.9 - 12.6) in P2, 10.2% (95% CI 9.8 - 10.5) in P3 and 9.8% (95% CI 9.4 - 10.1) in P4 (Fig. 1). Only 22 patients had HbA1c data in all four periods. Their mean HbA1c levels followed a similar pattern over time, but were significantly different (p=0.02).
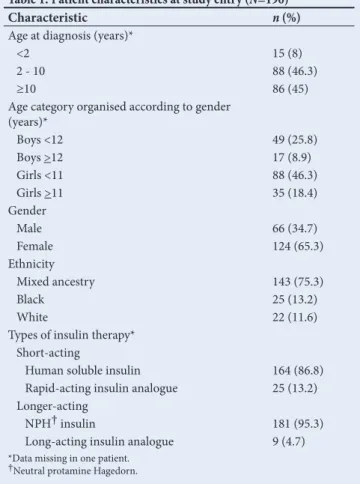
Number of hospital admissions
The number of admissions of the 34 patients seen in all four periods decreased progressively (p=0.01) (Fig. 2). Some were not admitted at all during a period, thereby reducing the mean number of admissions to <1.
Diabetic ketoacidosis and recurrent diabetic
ketoacidosis
The DKA rate improved progressively over the four periods, from 32.5/100 patient years in P1 to 23.5/100 patient years in P4. A similar
pattern was observed for the rDKA rate, which decreased from 18.8% in P1 to 9.6% in P4. More girls presented with rDKA.
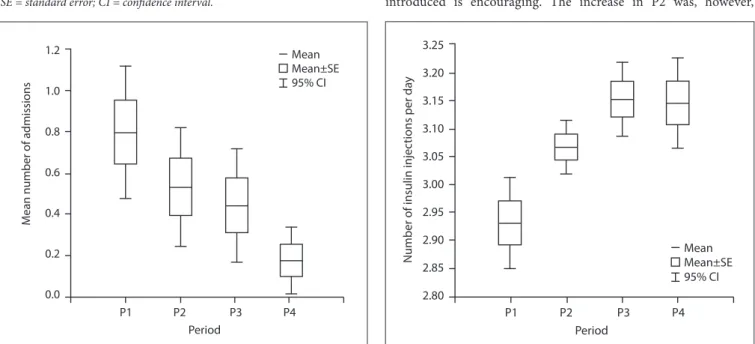
Insulin therapy
Human soluble and neutral protamine Hagedorn (NPH) insulin were used most often, as these are more readily available in public hospitals (Table 1). The number of insulin injections per day increased over time (p=0.01) from 2.93 (95% CI 2.85 - 3.01) in P1 to 3.14 (95% CI 3.06 - 3.23) in P4 (Fig. 3). Most patients received 3 injections per day, i.e. 63 (87.5%) during P1 and 112 (81.8%) during P4. The number of patients managed on >4 insulin injections per day increased from two (2.8%) in P1 to 24 (17.5%) in P4, while the number treated with 2 insulin injections per day dropped from seven patients (9.7%) to one from P1 to P4, respectively.
In P1, the mean insulin dose was significantly higher (p=0.00) than in the other three periods (Fig. 4) for all patients. The dose dropped from a maximum of 1.19 (95% CI 1.08 - 1.31) units/kg/day in P1 to a minimum of 0.88 (95% CI 0.82 - 0.93) units/kg/day in P2. The dose was subsequently adjusted to 0.93 (95% CI 0.87 - 1.00) units/kg/day in P4.
Complications
The number of patients with documented complications over the four periods was small, but increased gradually as the number being screened increased (Table 2). This is presumably due to initial underdetection. For example, in P1 the presence of LJM was not assessed and only a single lipogram was requested. Complication detection improved when an aide-memoire was implemented in P2. Owing to low numbers, statistical analysis of complications was not possible, except for microalbuminuria and LDL cholesterol levels. The UAC was similar throughout all periods, i.e. 3.2 (95% CI 1.1 - 5.3), 3.4 (95% CI 0.3 - 6.5), 4.5 (95% CI 2.1 - 6.8) and 3.4 (95% CI 1.2-5.7) mg/mmol in P1, P2, P3 and P4, respectively. The LDL cholesterol level changed significantly from 3.4 (95% CI 3.0 - 3.8) mmol/L in P2 to 2.6 (95% CI 2.4 - 2.8) mmol/L in P3. LJM was shown not to be associated with HbA1c. Presence of retinopathy, all non-proliferative except for one case, was only documented in P3 and P4. Only one case of neuropathy was diagnosed (in P4).
Discussion
The improvement in HbA1c levels after the DCT had been introduced is encouraging. The increase in P2 was, however,
M
ean H
bA1c lev
el
, %
Period 12.5
12.0
11.5
11.0
10.5
10.0
9.5
9.0
8.5
8.0
7.5
P1 P2 P3 P4 Mean Mean±SE 95% CI
Fig. 1. HbA1c levels per period (N=22 per period). SE = standard error; CI = confidence interval.
M
ean number of admissions
Period 1.2
1.0
0.8
0.6
0.4
0.2
0.0
P1 P2 P3 P4 Mean Mean±SE 95% CI
Fig. 2. Number of admissions per period (N=34 per period). SE = standard error; CI = confidence interval.
Number of insulin injec
tions per da
y
Period 3.25
3.20
3.15
3.10
3.05
3.00
2.95
2.90
2.85
2.80
P1 P2 P3 P4 Mean Mean±SE 95% CI
ARTICLE
somewhat unexpected (Fig. 1). Resolution of the honeymoon period cannot account for this observation, because it would have occurred before the commencement of P2. However, in the unstudied period prior to P2, diabetes management was suboptimal because a full-time diabetes specialist was not available for the last 8 months and inexperienced staff were tasked with diabetes care. After a paediatric endocrinologist was reappointed and the DCT had been introduced, mean HbA1c levels improved again, with a total decrease of close to 2% being achieved.
In line with the recommendations of the DCCT, all patients were converted to a regimen of at least 3 injections per day.[22] A
significant drop in mean insulin dose, maintained over all periods, was observed. This drop may have been due to improved injection technique, therapy adherence and the introduction of a point-of-care HbA1c analyser, which facilitated immediate management discussions with the families. A similar decrease in HbA1c levels was achieved in another study when a primary nurse educator implemented DCCT recommendations,[15] although the total daily
dose had to be increased to achieve this effect. However, the effect of the DNE’s involvement may be hard to separate from that of
changing to a multiple injection regimen. Maintaining the beneficial effect over the long term may be difficult: a 10-year study surveying the introduction of both a DCT and a multiple injection regimen at a higher dose showed no effect on median HbA1c levels.[19]
Improved HbA1c levels reported in other studies after a DCT was introduced varied between 0% and 1.3%.[11,12-14,16,23-26] However, these
studies are not comparable to ours, for several reasons. Firstly, the time span in those studies was considerably shorter than in ours (i.e. 6 - 12 months v. 6 years). Secondly, most of those studies assessed the impact of a DCT or DNE on the glycaemic control of adults with type 2 diabetes, and this patient population is likely to respond differently to therapeutic interventions. Thirdly, the combined effect of the reintroduction of specialist services, the appointment of a DNE and the standardisation of treatment to a multiple-dose injection regime resulted in a greater HbA1c decrease in our study. Lastly, institutionalisation of poorly controlled patients in our study may also have contributed to the observed results.
Despite the improvement, the attained glycaemic control is still far above the HbA1c target of 7.5% proposed by ISPAD.[5,6,27] However,
metabolic control is expected to continue to improve over time. The observation that the mean HbA1c levels were similar in P1 and P4 should not detract from the impact of introducing a DNE to the team. The marked difference in variability between the two periods may be attributed to the DNE’s effectiveness in reaching the group, as opposed to the restricted efforts of the paediatric endocrinologist alone.
In P4, 10 of the 11 girls (90.9%) and 7 of the 11 boys (63.6%) had reached puberty, a period known to be associated with poor glycaemic control. Insulin resistance and high insulin clearance usually necessitate a higher insulin dose.[28] Adolescents are also well
known to be resistant to change.[16] Psychiatric disturbances, resulting
in poor adherence and consequently poorer glycaemic control, are frequent. In a large study from Germany and Austria, median HbA1c levels in adolescents were found to be about 2% higher than in preschoolers.[29] In contrast, in the present study, children (mostly
adolescents) from predominantly poor socioeconomic backgrounds achieved improved glycaemic control with even less variation on a lower insulin dose.
A steady decline in the number of hospital admissions (about 75%) was seen over the study period. This pattern mirrors the change seen in HbA1c levels and translates to cost saving for the hospital. So far, studies assessing the effectiveness of a DCT have concentrated on documenting the reduced duration of hospitalisation.[7-10] To our
knowledge, only one study has previously assessed admission rates and found no effect on readmissions.[7]
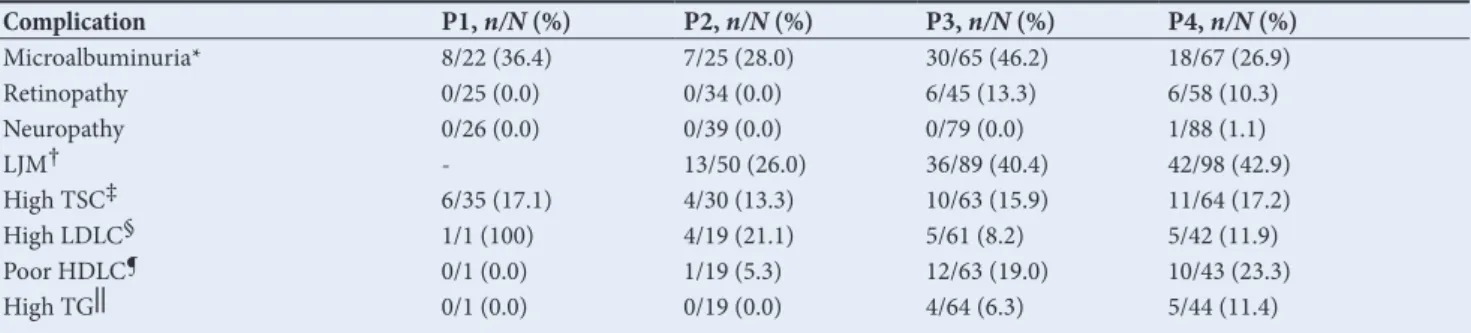
Table 2. Prevalence of complications
Complication P1, n/N (%) P2, n/N (%) P3, n/N (%) P4, n/N (%)
Microalbuminuria* 8/22 (36.4) 7/25 (28.0) 30/65 (46.2) 18/67 (26.9)
Retinopathy 0/25 (0.0) 0/34 (0.0) 6/45 (13.3) 6/58 (10.3)
Neuropathy 0/26 (0.0) 0/39 (0.0) 0/79 (0.0) 1/88 (1.1)
LJM† - 13/50 (26.0) 36/89 (40.4) 42/98 (42.9)
High TSC‡ 6/35 (17.1) 4/30 (13.3) 10/63 (15.9) 11/64 (17.2)
High LDLC§ 1/1 (100) 4/19 (21.1) 5/61 (8.2) 5/42 (11.9)
Poor HDLC¶ 0/1 (0.0) 1/19 (5.3) 12/63 (19.0) 10/43 (23.3)
High TG|| 0/1 (0.0) 0/19 (0.0) 4/64 (6.3) 5/44 (11.4)
P1 = August 2004 - July 2005; P2 = August 2007 - July 2008; P3 = August 2009 - July 2010; P4 = September 2010 - July 2011.
UAC = urine albumin–creatinine; LJM = limited joint mobility; TSC = total serum cholesterol; LDLC = low-density lipoprotein cholesterol; HDLC = high-density lipoprotein cholesterol; TG = triglycerides.
*Defined as UAC >2 mg/mmol in two consecutive early-morning urine samples. † Not assessed in P1.
‡ >6.2 mmol/L. § ≥4.1 mmol/L.
¶ Boys: <1 mmol/L; Girls: <1.3 mmol/L. || ≥2.3 mmol/L.
M
ean insulin dose/da
y (units/kg/da
y)
Period 1.4
1.3
1.2
1.1
1.0
0.9
0.8
0.7
P1 P2 P3 P4 Mean Mean±SE 95% CI
ARTICLE
The decreasing admission rate seen in the present study further attests to the effectiveness of a full DCT. Patients were mainly admitted because they developed DKA. As shown earlier, the DKA rate decreased in each period, affecting overall admission rates. The number of rDKA admissions also improved. A decrease in rDKA rate generally would not be expected, because children presenting with rDKA frequently have underlying social or behavioural pathology not amenable to intervention. However, a drop in the rDKA rate was probably achieved because patients were being institutionalised once the pathology had been detected. To our knowledge, such a reduction in DKA rates has not been demonstrated before.
Although HbA1c levels improved progressively over time, the prevalence of microalbuminuria did not change accordingly. Other studies suggest that a longer period of observation may be required for any effect on renal function to manifest. For example, it took 10 years before a 50% difference in nephropathy prevalence could be demonstrated in adult T1DM patients managed by diabetologists over those managed by generalists.[17] A similar reduction was
achieved in diabetic adolescents 5 years after DCT institution and implementation of DCCT recommendations.[19,20]
Over time, LJM was more commonly recognised, with an actual prevalence of about 40%. In other studies, the reported prevalence of LJM ranges from 3.9% - 55%. This wide range probably relates to examination technique, the age of the population and the duration of diabetes.[30] As in other studies, an association between HbA1c levels
and the occurrence of LJM could not be established.
Triglyceride levels remained constant during the assessed periods. A decrease in LDL cholesterol levels was seen in the short term, which probably reflects better glycaemic control. Similar changes, together with improved HDL cholesterol levels, were seen in another study following the introduction of a mobile DCT for adult type 2 diabetes patients.[12]
Circumstantial evidence suggests that many patients did not attend their ophthalmology appointments before the introduction of fundal photography in P4, which may explain why no retinopathy was identified during the first two periods. The actual prevalence may therefore be higher than what was observed. Presumably this is also true for neuropathy, as only one patient was identified after four periods. Inadequate screening is not unique to this service.[8] Both
adult and paediatric literature suggest that the prevalence of these two complications is 12% at best,[8,18,19] i.e. considerably higher than
what was observed in the current study. Efforts to detect all possible complications therefore need to be intensified. Furthermore, a prospective study would be more effective in detecting complications.
The limitations alluded to here are typical of any retrospective study. For example, some patients may have escaped repeat testing for microalbuminuria, which may have artificially inflated the microalbuminuria rate and could consequently have been interpreted as a lack of improvement. Data on the duration of the honeymoon period or the duration of illness, puberty and body mass index, all of which could have affected glycaemic control, were not collected. However, a significant improvement in HbA1c levels was seen over time, suggesting that these factors were fairly inconsequential. As about a quarter of our patient population resides in rural areas, patients who had developed DKA could have presented at peripheral hospitals, resulting in under-reporting of the DKA rate at our centre. This bias should, however, be fairly constant across all periods.
Conclusion
A significant improvement in glycaemic control of paediatric and adolescent T1DM patients from a lower socioeconomic background was achieved in a resource-poor environment by re-establishing specialist care and introducing a full DCT. Switching all patients to a multiple-dose injection regimen probably contributed to the improvement. Low variation in HbA1c levels was achieved in
predominantly pubertal patients at a lower daily insulin dose. The effect of improved metabolic control was mirrored by a reduction in admission and DKA rates over time, confirming the value of a DCT in the management of T1DM patients.
Declaration. This manuscript was submitted in partial fulfilment of the requirements for the degree of Master of Medicine.
Acknowledgements. The authors kindly acknowledge S. Zöllner for language support, Dr M.A. van Rensburg, Tygerberg Hospital, for chemical pathology support and the DNEs at Tygerberg Hospital who provided some of the data.
Author contributions. As the principal investigator, ZK performed the study, collected and summarised all the data, assisted with interpretation of data and wrote the manuscript. JH analysed data and assisted with interpretation, and wrote the section on statistical analysis. EZ contributed substantially to the conception and design of the study, interpretation of the data and preparing the manuscript.
Funding. None.
Conflicts of interest. None.
1. Majaliwa ES, Elusiyan BE, Adesiyun OO, et al. Type 1 diabetes mellitus in the African population: Epidemiology and management challenges. Acta Biomed 2008;79(3):255-259.
2. Chong JW, Craig ME, Cameron FJ, et al. Marked increase in type 1 diabetes mellitus incidence in children aged 0-14 yr in Victoria, Australia, from 1999 to 2002. Pediatr Diabetes 2007;8(2):67-73. https://doi.org/10.1111/j.1399-5448.2007.00229.x
3. Robertson A. Chronic conditions in children. S Afr Health Rev 2006;15:257-270.
4. Cardwell CR, Patterson CC, Allen M, Carson DJ, Northern Ireland Paediatric Diabetes Study Group. Diabetes care provision and glycaemic control in Northern Ireland: A UK regional audit. Arch Dis Child 2005;90(5):468-473. https://doi.org/10.1136/adc.2004.061150
5. Pihoker C, Forsander G, Wolfsdorf J, Klingensmith GJ. The delivery of ambulatory diabetes care: Structures, processes, and outcomes of ambulatory diabetes care. Pediatr Diabetes 2008;9(6):609-620. https://doi.org/10.1111/ j.1399-5448.2008.00480.x
6. Chiarelli F, Dahl-Jorgensen K, Kiess W. Diabetes in childhood and adolescence. Pediatr Adolesc Med 2005;10:163-180.
7. Ward WK, Haas LB, Beard JC. A randomized, controlled comparison of instruction by a diabetes educator versus self-instruction in self-monitoring of blood glucose. Diabetes Care 1985;8(3):284-286. https://doi.org/10.2337/ diacare.8.3.284
8. Cowan FJ, Warner JT, Lowes LM, Riberio JP, Gregory JW. Auditing paediatric diabetes care and the impact of a specialist nurse trained in paediatric diabetes. Arch Dis Child 1997;77(2):109-114. https://doi.org/10.1136/adc.77.2.109 9. Levetan CS, Salas JR, Wilets IF, Zumoff B. Impact of endocrine and diabetes
team consultation on hospital length of stay for patients with diabetes. Am J Med 1995;99(1):22-28. https://doi.org/10.1016/s0002-9343(99)80100-4 10. Feddersen E, Lockwood DH. An inpatient diabetes educator’s impact on
length of hospital stay. Diabetes Educ 1994;20(2):125-128. https://doi. org/10.1177/014572179402000207
11. Koproski J, Pretto Z, Poretsky L. Effects of an intervention by a diabetes team in hospitalized patients with diabetes. Diabetes Care 1997;20(10):1553-1555. https://doi.org/10.2337/diacare.20.10.1553
12. Maislos M, Weisman D, Sherf D. Western Negev Mobile Diabetes Care Program: A model for interdisciplinary diabetes care in a semi-rural setting. Acta Diabetol 2002;39(1):49-53. https://doi.org/10.1007/s005920200012 13. Thompson DM, Kozak SE, Sheps S. Insulin adjustment by a diabetes nurse
educator improves glucose control in insulin-requiring diabetic patients: A randomized trial. CMAJ 1999;161(8):959-962.
14. Redhead J, Hussain A, Gedling P, McCulloch AJ. The effectiveness of a primary-care-based diabetes education service. Diabet Med 1993;10(7):672-675. https:// doi.org/10.1111/j.1464-5491.1993.tb00143.x
15. Ahern JA, Ramchandani N, Cooper J, Himmel A, Silver D, Tamborlane WV. Using a primary nurse manager to implement DCCT recommendations in a large pediatric program. Diabetes Educ 2000;26(6):990-994. https://doi. org/10.1177/014572170002600611
16. Lawson ML, Cohen N, Richardson C, Orrbine E, Pham B. A randomized trial of regular standardized telephone contact by a diabetes nurse educator in adolescents with poor diabetes control. Pediatr Diabetes 2005;6(1):32-40. https://doi.org/10.1111/j.1399-543x.2005.00091.x
ARTICLE
18. Zgibor JC, Songer TJ, Kelsey SF, Drash AL, Orchard TJ. Influence of health care providers on the development of diabetes complications: Long-term follow-up from the Pittsburgh Epidemiology of Diabetes Complications Study. Diabetes Care 2002;25(9):1584-1590. https://doi.org/10.2337/diacare.25.9.1584 19. Mohsin F, Craig ME, Cusumano J, et al. Discordant trends in microvascular
complications in adolescents with type 1 diabetes from 1990 to 2002. Diabetes Care 2005;28(8):1974-1980. https://doi.org/10.2337/diacare.28.8.1974 20. Downie E, Craig ME, Hing S, Cusumano J, Chan AK, Donaghue KC. Continued
reduction in the prevalence of retinopathy in adolescents with type 1 diabetes. Diabetes Care 2011;34(11):2368-2373. https://doi.org/10.2337/dc11-0102 21. Mayo Clinic. High cholesterol – Diagnosis and treatment. https://www.
mayoclinic.org/diseases-conditions/high-blood-cholesterol/diagnosis-treatment/drc-20350806 (accessed 14 May 2018).
22. The Diabetes Control and Complications Trial Research Group, Nathan DM, Genuth S, et al. The effect of intensive treatment of diabetes on the development and progression of long-term complications in insulin-dependent diabetes mellitus. N Engl J Med 1993;329(14):977-986. https://doi.org/10.1056/ nejm199309303291401
23. Krier BP, Parker RD, Grayson D, Byrd G. Effect of diabetes education on glucose control. J La State Med Soc 1999;151(2):86-92.
24. Sadur CN, Moline N, Costa M, et al. Diabetes management in a health maintenance organization: Efficacy of care management using cluster visits. Diabetes Care 1999;22(12):2011-2017. https://doi.org/10.2337/ diacare.22.12.2011
25. Rashed OA, Al Sabbah H, Younis MZ, Kisa A, Parkash J. Diabetes education program for people with type 2 diabetes: An international perspective. Eval Program Plann 2016;56:64-68. https://doi.org/10.1016/j. evalprogplan.2016.02.002
26. Garg R, Hurwitz S, Rein R, Shuman B, Underwood P, Bhandari S. Effect of follow-up by a hospital diabetes care team on diabetes control at one year after discharge from the hospital. Diabetes Res Clin Pract 2017;133:78-84. https:// doi.org/10.1016/j.diabres.2017.08.014
27. Rosenbauer J, Dost A, Karges B, et al. Improved metabolic control in children and adolescents with type 1 diabetes: A trend analysis using prospective multicenter data from Germany and Austria. Diabetes Care 2012;35(1):80-86. https://doi.org/10.2337/dc12-er11b
28. Acerini CL, Cheetham TD, Edge JA, Dunger DB. Both insulin sensitivity and insulin clearance in children and young adults with type I (insulin-dependent) diabetes vary with growth hormone concentrations and age. Diabetologia 2000;43(1):61-68. https://doi.org/10.1007/s001250050008
29. Gerstl E-M, Rabl W, Rosenbauer J, et al. Metabolic control as reflected by HbA1c in children, adolescents and young adults with type-1 diabetes mellitus: Combined longitudinal analysis including 27,035 patients from 207 centers in Germany and Austria during the last decade. Eur J Pediatr 2008;167(4):447-453. https://doi.org/10.1007/s00431-007-0586-9
30. Rosenbloom AL. Limited joint mobility in insulin dependent childhood diabetes. Eur J Pediatr 1990;149(6):380-388. https://doi.org/10.1007/ bf02009653