International Journal of Research in Engineering & Applied Sciences Email: [email protected], http://www.euroasiapub.org
(An open access scholarly, peer-reviewed, interdisciplinary, monthly, and fully refereed journal.)
14
THE EFFECTS OF ACTIVATING AGENTS ON THE CHARACTERISTICS OF ACTIVATED CARBON PRODUCED FROM SUB-BITUMINOUS COAL
Echegi, Christian Uche Department of Chemical Engineering, Institute of Management and Technology, Enugu
Abstract
In this work, the effect of activating agents on activated carbon produced from sub-bitumous coal was investigated. Chemical method of activation was employed. The coal sample was subjected to pretreatment and later activation and carbonization. The pretreated coal was impregnated with activating agent at ratios of combination ranging from 1/1 to 1/4 and then heated to a given temperature at specific time intervals. The resulting product was carbonized in a furnace at a temperature of 6000-10000C for 2 hours. The characterization tests conducted on the activated carbon products showed that the adsorptive properties vary with the nature of activating agent, impregnation ratio of activating agent and temperature of activation. The assessed parameters of surface area, iodine number, porosity, fixed carbon etc recorded substantial increment for the most of the activating agents. The KOH activating agent produced the best performance in all the conditions investigated. FTIR analysis indicates significant variations in the functional groups while SEM-morphology study of the surface of the activated carbon produced shows remarkable pore volume development.
Keywords: Activating agents, Characteristics, Activated carbon, Sub-Bituminous Coal
1. Introduction
Activated Carbon (AC) is one of the most attractive adsorbent which has a wide area of applications based on its characteristic properties of high adsorption capacity, effective pore distribution, high degree of surface reactivity and mechanical strength etc [Zhang, 2013; Nilgun et al, 2008]. AC applications range from the treatment of domestic and industrial waters to the production of refined sugar, decolourization of petroleum products, purification of vegetable oils as well as in pharmaceutical industries for drug production. Recent research interest has been shifted from advanced water treatment to its use in direct contact with blood as an artificial kidney, remediation of the contaminated soil and as catalyst and catalytic support in process industries for catalytic reaction optimization, [Echegi et al, 2017; Eze et al, 2017].
International Journal of Research in Engineering & Applied Sciences Email: [email protected], http://www.euroasiapub.org
(An open access scholarly, peer-reviewed, interdisciplinary, monthly, and fully refereed journal.)
15
Basically, there are two classified methods of activation of coal called physical and chemical activation. In physical activation, the first step is carbonization of the raw material and is conducted in an oxygen free environment at temperature of 4000 – 8500C at a slow heating rate in order to
optimize the yield of char [Cuhadaroglu et al, 2008; Echegi, 2017]
However, the carbon (char) obtained from carbonization process possesses a poor adsorptive property. Due to the blockage of the pores by tars, the internal surface area of the char is too low and it does not have a developed porous structure [Azargohar, 2009]. Therefore, the char should be subjected to activation in order to increase porosity, create and widen the existing micropores and some mesopores. According to Yusuf et al (2012) and Cuhadaroglu et al (2008), activation can be physical/thermal with the use of air, carbondioxide, water vapour etc at high temperatures or a chemical process employing activating agents such phosphoric acid, zinc chloride etc. As reported by many researchers, activation temperature significantly affects the yield and adsorptive capacity of the AC. The optimum temperature ranges from 2000 – 6000C [McDougall, 1991; Yusuf et al, 2012; Marsh et al 2006]. In chemical activation, both carbonization and activation processes are conducted simultaneously at the same temperature. It involves the impregnation of starting precursor by mixing it with an excess amount of a given chemical, usually in the form of concentrated solution. Like the physical activation, the commonly used activating agents are KOH, NaOH, H3PO4, ZnCl2, HCl, H2SO4, Na2CO3, K2CO3, etc. During the activation process, the space
between the elementary crystallites, becomes cleared of less organized bound carbonaceous materials. The resulting channels expands through the graphitic regions, the spaces between the elementary crystallities, together with fissures within and parallel to graphitic planes constitutes the porous structure with large internal surface area [Echegi, 2017; Amir, 2012].
The nature of activating agent, type of starting raw material, mode of activation and impregnation ratio are the key factors to the determinant of the properties of the derivable AC [Mc Enanney, 2012; Robau-Sanchez et al 2005]. Alkali compound such as hydroxides or carbonates of potassium and sodium develop micropores while transition metals and alkaline – earth compounds promote the formation of mesoporosity [Azargohar, 2009]. The activated carbon produced by ZnCl2 activation are predominantly microporous, but with significant mesopores which increases
with the impregnation ratio. However, its uses are restricted due to hazardous nature of the product. H3PO4 produces finer pores in comparison to ZnCl2 and it is widely applied due to the
improvement in the process of acid recovery in recent years [Echegi, 2013]. Activated Carbon with highly developed microstructures and high surface area greater than 2000m2/g can be produced by KOH or NaOH chemical activation [Cuhadaroglu et al, 2008]. The development of porosity in KOH activation is somehow different from that of ZnCl2 and H3PO4. This may be attributed to the
reduction of KOH to potassium by this spontaneous reaction [Azargohar, 2009; Lillo-Rodena et al, 2004].
International Journal of Research in Engineering & Applied Sciences Email: [email protected], http://www.euroasiapub.org
(An open access scholarly, peer-reviewed, interdisciplinary, monthly, and fully refereed journal.)
16
Then, this free metal (K) penetrates between the graphene layers of the carbon which leads to the expansion of the structural graphene layers. Finally, with increasing temperature, the free metal is removed rapidly from the graphene layers thus creating the porosity (micro-porosity).
In this study, the effect of various activating agents on the production of coal-based AC from sub-bitumous coal obtained from Enugu coal mine in Nigeria was investigated. The choice of chemical activation in this work is due to the economy of the process as well as the enhanced structural and adsorptive properties accruable from its product.
2.0 MATERIALS AND METHOD
2.1 Pre-activation Treatment
The coal sample obtained from Onyema mine in Enugu was ground with a rock Crusher/grinder for about 10 minutes. The ground coal was dried in an oven at 1000C for 24 hours and later sieved to a mesh size 500φm.
2.2 Chemical Activation
Chemical activation process was carried out in two steps, namely activation followed by carbonization. Activation studies were conducted at low temperature and high temperature conditions as described in experiments 1 and 2. The details are outlined below.
2.3 Experiment 1
The pre-treated coal sample was activated by mixing and heating it with activating agent at low temperatures. The activating agents employed were KOH, NaOH, ZnCl2 and H3PO4.
The activating agent and the precursor were measured out and mixed together in a given impregnation ratio as 4/1, 2/1 and 1/1. The resulting mixture was stirred continuously in each activating agent of 50% solution at a temperature of 800C for 30 minutes. The activated sample was later filtered by vacuum and dried in oven at 1000C for 24 hours.
After the activation process, the sample was subjected to carbonization. The sample was places in a programmeable tube furnace. The furnace was programmed in such a way that the heating rate of 50C per minute was maintained. During carbonization, nitrogen was introduced to the system at a flow rate of 1000 cm3/min and the heating continued to a temperature of 8000C. The heating was maintained constant at this temperature for 2 hours. Later, the furnace and its content were allowed to cool to ambient temperature.
International Journal of Research in Engineering & Applied Sciences Email: [email protected], http://www.euroasiapub.org
(An open access scholarly, peer-reviewed, interdisciplinary, monthly, and fully refereed journal.)
17
2.4 Experiment 2
In this experiment, reference was made to the first experiment with regards to the characteristic properties of the activated carbon obtained from different activating agents vis-a-viz their impregnation ratio. As observed, the activating agents of H3PO4 and ZnCl2 produced lower values
of the parameters assessed irrespective of the impregnation ratio employed. Therefore, they are considered unsuitable for this process and subsequently eliminated for further works.
A measured amount of 2g of pre-treated coal sample was put into a volumetric flask and mixed with 50% activating agent solution of KOH at a ratio of 1/1. A condenser was mounted to the flask to prevent evaporation. The mixture was boiled at a temperature of 1500C for 5 hours in an oil bath. At the end of this period, the mixture was cooled to ambient temperature, filtered by vacuum and the dried at 1000C for 24 hours in an oven. A similar procedure of carbonization as described in first experiment was adopted as follows:
The sample was placed in a tube furnace where N2 was introduced to the system at a flow
rate of 1000cm3/min. The heating of the furnace was maintained at 50C per minute. At a final temperature of 6000C, 7000C, 8000C, 9000C, and 10000C, the heating was allowed to remain constant for 2 hours. At the end of this period, the furnace was left to cool to room temperature. The carbonized sample was mixed with 250cm3 of 0.5N HCl and the mixture was subjected to heating accompanied by constant stirring at 850C for 30 minutes. Later, it was filtered by vacuum and the sample of activated carbon obtained rinsed with distilled water several times until pH of the activated carbon-distilled water mixture has exceeded 6. The activated carbon obtained was dried in an oven at 1000C for 24 hours. Thereafter, the characterized properties of surface area, iodine value, pore volume, porosity etc of the AC evaluated. The same procedure was repeated using activating agent of sodium hydroxide NaOH.
3 RESULTS AND DISCUSSION
Param et er Moi st ur e C onte nt (% ) A sh C onte nt (% ) B ulk D ensi ty (g /cm 3 ) pH Iodi ne V al ue (m g /g) Su rf ac e ar ea (m 2 /g) V ol at il e Mat ter ( % ) Fixe d C arb on (%) Pore V ol u m e (cm 3 /g) Porosi ty
Value 9.86 15.63 0.798 6.8 138 206 33.71 41.80 0.111 0.441
International Journal of Research in Engineering & Applied Sciences Email: [email protected], http://www.euroasiapub.org
(An open access scholarly, peer-reviewed, interdisciplinary, monthly, and fully refereed journal.)
18
PARAMETERS NaOH 4/1 NaOH 2/1 NaOH 1/1 KOH 4/1 KOH 2/1 KOH 1/1Moisture content (%) 1.3475 1.7403 2.231 1.3261 1.536 2.175
Ash content (%) 15.2 15.0 13.2 14.8 14.2 13.5
Bulk Density (g/ml) 0.3317 0.5050 0.5905 0.3575 0.6518 0.6683
pH 7.2 7.0 7.0 7.1 6.9 7.0
Iodine number (mg/g) 1419.7 962.57 687.64 1711.74 1013.69 743.67
Surface Area (m2/g) 1530.4 1030.0 718.2 1862.3 1138.1 850.0
Volatile matter (%) 18.4 19.5 20.2 19.2 20.5 21.7
Fixed carbon (%) 65.05 63.76 64.37 64.67 63.76 62.63
Pore Volume (cm3/g) 0.560 0.540 0.479 0.697 0.589 0.516
Porosity 0.8174 0.8063 0.7617 0.8737 0.8688 0.8149
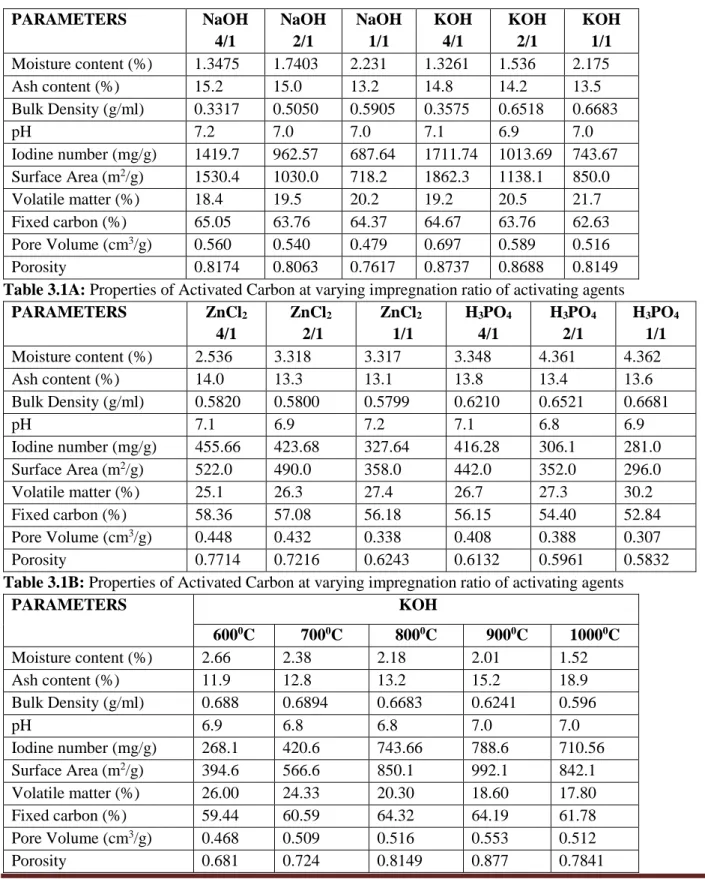
Table 3.1A: Properties of Activated Carbon at varying impregnation ratio of activating agents
PARAMETERS ZnCl2
4/1
ZnCl2
2/1
ZnCl2
1/1
H3PO4
4/1
H3PO4
2/1
H3PO4
1/1
Moisture content (%) 2.536 3.318 3.317 3.348 4.361 4.362
Ash content (%) 14.0 13.3 13.1 13.8 13.4 13.6
Bulk Density (g/ml) 0.5820 0.5800 0.5799 0.6210 0.6521 0.6681
pH 7.1 6.9 7.2 7.1 6.8 6.9
Iodine number (mg/g) 455.66 423.68 327.64 416.28 306.1 281.0
Surface Area (m2/g) 522.0 490.0 358.0 442.0 352.0 296.0
Volatile matter (%) 25.1 26.3 27.4 26.7 27.3 30.2
Fixed carbon (%) 58.36 57.08 56.18 56.15 54.40 52.84
Pore Volume (cm3/g) 0.448 0.432 0.338 0.408 0.388 0.307
Porosity 0.7714 0.7216 0.6243 0.6132 0.5961 0.5832
Table 3.1B: Properties of Activated Carbon at varying impregnation ratio of activating agents
PARAMETERS KOH
6000C 7000C 8000C 9000C 10000C
Moisture content (%) 2.66 2.38 2.18 2.01 1.52
Ash content (%) 11.9 12.8 13.2 15.2 18.9
Bulk Density (g/ml) 0.688 0.6894 0.6683 0.6241 0.596
pH 6.9 6.8 6.8 7.0 7.0
Iodine number (mg/g) 268.1 420.6 743.66 788.6 710.56
Surface Area (m2/g) 394.6 566.6 850.1 992.1 842.1
Volatile matter (%) 26.00 24.33 20.30 18.60 17.80
Fixed carbon (%) 59.44 60.59 64.32 64.19 61.78
Pore Volume (cm3/g) 0.468 0.509 0.516 0.553 0.512
International Journal of Research in Engineering & Applied Sciences Email: [email protected], http://www.euroasiapub.org
(An open access scholarly, peer-reviewed, interdisciplinary, monthly, and fully refereed journal.)
19
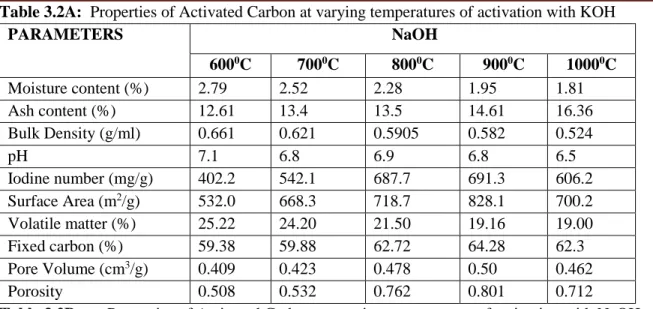
Table 3.2A: Properties of Activated Carbon at varying temperatures of activation with KOH
PARAMETERS NaOH
6000C 7000C 8000C 9000C 10000C
Moisture content (%) 2.79 2.52 2.28 1.95 1.81
Ash content (%) 12.61 13.4 13.5 14.61 16.36
Bulk Density (g/ml) 0.661 0.621 0.5905 0.582 0.524
pH 7.1 6.8 6.9 6.8 6.5
Iodine number (mg/g) 402.2 542.1 687.7 691.3 606.2
Surface Area (m2/g) 532.0 668.3 718.7 828.1 700.2
Volatile matter (%) 25.22 24.20 21.50 19.16 19.00
Fixed carbon (%) 59.38 59.88 62.72 64.28 62.3
Pore Volume (cm3/g) 0.409 0.423 0.478 0.50 0.462
Porosity 0.508 0.532 0.762 0.801 0.712
Table 3.2B: Properties of Activated Carbon at varying temperatures of activation with NaOH.
The characteristics of AC prepared from Enugu coal by different activation methods were presented in Tables 3.1 and 3.2. A comparison of the result with raw coal contained in Table 3.0 shows that there are significant improvement in all the assessed properties of the activated carbon produced. Similarly, the evolution of characteristics of carbon obtained from activation processes indicated a substantial variation from one another. These variations were dictated by the process factors involved in the carbonization and activation such as impregnation ratio of activating agent to coal sample, temperature, nature of the activating agent and method of activation. However, the major factors of characterization such as iodine, surface area, porosity etc. of AC obtained by using ZnCl2, and H3PO4 in the first experiment were very low in comparison to those of KOH and NaOH.
Therefore, further studies on these activating agents were considered unnecessary.
In the first group of experiments – Tables 3.1A and 3.1B, the effects of the impregnation ratio of the different activating agents were studied. The result shows that the surface area, pore volume, iodine value and other important adsorptive properties of AC recorded the highest values at the apex mark of impregnation ratio of the activating agents employed in the experiment. For instance, at the impregnation ratio of KOH to coal sample, the surface areas obtained were 1862 and 850 m2/g for 4/1 and 1/1 combination respectively. While for NaOH the values obtained were 1530 and 718 m2/g at the same ratios mentioned above. As stated earlier, a similar trend was
International Journal of Research in Engineering & Applied Sciences Email: [email protected], http://www.euroasiapub.org
(An open access scholarly, peer-reviewed, interdisciplinary, monthly, and fully refereed journal.)
20
porosity and bulk density. For instance, the least substantive difference in surface area is evaluated as 34% from the ratios of 1/1 and 2/1 for KOH, while a value of 43% was obtained for the activating agent of NaOH at the same range of impregnation ratio. For the iodine value and activating agent of NaOH, the trend produced a result of 1419.7, 962.6 and 687.4mg/g at the ratio of 4/1, 2/1 and 1/1 respectively. It is the same observation for the KOH as the values of 1712, 1014 and 744 mg/g were recorded at the ratio of 4/1, 2/1 and 1/1 in that order. The analysis of the effect of activating agents vis-a-viz the values obtained shows that KOH recorded the best performance followed by NaOH and then ZnCl2 while H3PO4 takes the ray. The observation is in agreement
with the work of Fierro and co-workers (2007) who reported that BET surface areas of activated carbon produced from Kraft Lignin by chemical activation using KOH is higher than that of NaOH. These findings were also corroborated by other researchers including Amir (2012) and Lillo-Roden and Co-workers (2004) in their individual works on the comparative analysis of various AC produced from different activating agents on carbonaceous materials. The observed analytical differences in these parameters may be attributed to the differing actions of activating agents on coal sample. At appropriate conditions, the oxidizing action of these activating agents will lead to discretive removal of successive layers of atoms from the carbon matrix. The oxidation selectively erodes the surfaces and creates spaces between elementary crystallites. The less organized, loosely bound carbonaceous materials are oxidized and cleared with the creation of channels, together with fissures within and parallel to graphitic planes, constituting the porous structure with large internal surface areas [Amir, 2012]. However, the emergence of KOH as the leader in performance rating for these parameters investigated does not imply that other activating agents in this study did not meet the required standard specifications. The mode of interaction of acid with coal was reported [Baba et al, 2007] to be mainly through oxygen functional groups leading to dehydrogenation and repolymerization reactions with carbon structure. On the other hand, KOH and NaOH, acting as bases, involve the process of both dehydrogenation and oxidation reactions. As reported by Azargohar [2009], the overall stoichiometric reaction of KOH involves direct attack on the carbon centre resulting in more aliphatic chains, hence higher porosity and surface area, among others.
International Journal of Research in Engineering & Applied Sciences Email: [email protected], http://www.euroasiapub.org
(An open access scholarly, peer-reviewed, interdisciplinary, monthly, and fully refereed journal.)
21
range and subsequently the value decreased to 0.512cm3/g from 0.553cm3/g at the temperature of 10000 to 9000C. These findings are in conformity with those of Yusuf and co-workers [2012] who observed that in some selected raw materials of coconut shells and cattle bones, the surface area of the AC produced increased with temperature up to a maximum of 9000C and thereafter decreased beyond 9000C. The increment at the above mentioned temperature range may be due to the volatilization of melted ashes that results in the opening of the blocked pore channels, which will subsequently lead to the creation of larger amount of micropores and mespores [Amir, 2012]. But the reduction in adsorptive capacity after attaining maximum values is an indication of the occurrence of the structural deformation of the already formed AC. Thus, structural deformation might have risen from the significant melting of the ash fraction in char at a temperature greater than 9000C, that plausibly blocked the pores in the char when the char was cooled to ambient temperature. This may also have been enhanced by the collapse of the pore walls that created resistance to the diffusion of the molten ash out of the pore channels of the AC [Echegi, 2017].
The low ash content of the AC obtained after activation process as presented in Tables 3.1 – 3.2 is an indication that Enugu coal is a potential material for the preparation of high quality activated carbons. Ash layer reduces the adsorptive power of AC and the efficiency of reactivation. The ash which serves as one of the impurities forms complexes on the surface of the AC and covers the existing pores and thereby reducing the pore volume distributions [Baba et al, 2007]. Secondly, the manner in which the oxygen atoms are combined with the surface, can alter the pH nature of the surface and hence its adsorptive capacity. In Tables 3.1A and 3.1B, the ash content values decreased to comparatively lesser values after activation. But the variation across the Tables with increasing impregnation ratio of activating agent is relatively insignificant. However, the story is different on the study of the effect of temperature of activation. For stance, in Tables 3.2A and 3.2B, the percentage ash content increases substantially with temperature. At temperature of 6000C, the least value of 11.9% was recorded by using KOH, while the value increased to 18.9% at a temperature of 10000C. The same trend was exhibited with the activating agent of NaOH (Table 3.2). The pronounced effect of temperature on ash yield is an indication of high rate of devolatilization of carbonaceous substances of the coal sample due to increased temperature. Nevertheless, the effect of ash content may not have serious impact on the adsorptive properties of AC as much as the major determining factors of surface area, iodine value, pore volume, moisture content maintained their standard values [Echegi, 2017].
International Journal of Research in Engineering & Applied Sciences Email: [email protected], http://www.euroasiapub.org
(An open access scholarly, peer-reviewed, interdisciplinary, monthly, and fully refereed journal.)
22
of 1/1. Similarly, the results in Tables 3.2A and 3.2B show that at a temperature of 6000C, the bulk density recorded the highest value of 0.688 g/cm3 for KOH. The value decreased to 0.596 g/cm3 at the maximum temperature of 10000C. Also, the NaOH-activated carbon produced a similar trend
of result. The findings may be due to the devolatilization which increases with the temperature until some of the species and their linkages in the impregnated sample attain their limit of thermal stability. This leads to structural expansion, widening and re-opening of existing pores and hence a decrease in true density [Echegi, 2017]. After the release of lighter components, mainly due to oxidative action on the sample, the remaining solid matrix developed a relatively increased porosity thereby exhibiting increase in pore volume. This invariably leads to decrease in bulk density. This observation is however, contrary to the work of Baba et al (2007) that obtained reduced volume of activated carbon produced from the activating agents of H3PO4 and KOH on
the pyrolysis of Bituminous coal. Remarkably, the general result is a confirmation of the fact that lower density provides greater volume activity and normally indicates better quality activated carbon [Echegi, 2017].
The moisture content of the various activated carbon decreased with the concentration of activating agents and temperature of activation. In Table 3.1A, the highest value of 2.231% was obtained for NaOH at the ratio of 1/1. The decrease from the ratio of 4/1 to 1/1 for NaOH and KOH were evaluated as 39.62% and 39.03% respectively. The effect may be attributed to the dehydration action of the activating agent which is more intensified at high concentration. In a similar manner, the reduction in moisture content increases with temperature. As observed in Tables 3.2A and 3.2B, the moisture content at a temperature of 6000C was obtained as 1.66% for KOH. At the same concentration of this reagent, the value decreased to 1.32% at a high temperature of 10000C. Expectedly, the effect of temperature on moisture content may be linked to increased thermal activity leading to high rate of scorching on the carbon. As one of the factors that characterizes adsorbent [Echegi, 2017], the moisture content of activated carbon bears influential index on the rating of its performance. The adsorption capacity of any adsorbent increases with the decrease in moisture content. At higher value of moisture content, the pores will be easily blinded, the surface area decreases and the bulk density increases.
Fourier transform infrared (FTIR) analysis was used to investigate the variation in functional groups of the raw coal and the activated carbon samples produced from different modes of activation. FTIR technique is a powerful tool for the analytical method of identification of constituents of activated coal samples. It shows the carbon of any adsorbent in the range of 4000 – 400cm-1 wave number. The existence of different wave bands that are characterized by variations
International Journal of Research in Engineering & Applied Sciences Email: [email protected], http://www.euroasiapub.org
(An open access scholarly, peer-reviewed, interdisciplinary, monthly, and fully refereed journal.)
23
– 2800 cm-1, C = O and C – O stretching in between 1750 – 1640 cm-1, C=C aromatic skeletal
stretching 1640-1610 cm-1, C = C stretching band 1580-1570 cm-1, C – H asymmetric bending in 1500 – 1400 cm-1, while 900 – 500 cm-1 contains various bands related to aromatic, out of plane
C – H bending with different degrees of substitution.
The raw coal exhibited hydroxyl functional groups, including hydrogen bonding O-H stretching between 3770 – 3680 cm-1, which is much less prevalent in all the AC samples. The reduction in hydrogen bonding shows that the activating agents acted as dehydrating agents in reacting with the raw coal during the production of AC [Hesas et al, 2013; Suarez-Garcia et al, 2002]. The intense band at the range of 2920 – 2850 cm-1 in raw coal is assigned to asymmetric C – H stretching, which is reduced in the derived (activated) carbon as shown in figures 2 and 3-3. This observation reflects a true confirmation that activation process removed a substantial amount of hydrogen. The stretching absorption band at 1740 cm-1 observed in the raw coal is associated with C = O group in configurations such as lactones, quinine and COOH groups which indicates the presence of ester, carboxylic acid and conjugated ketonic structures. This band was virtually absent in the prepared activated carbons, indicating that chemical activation broke many bonds in aliphatic and aromatic species and eliminated many volatile and light substances [Hesas et al, 2013]. The peak at approximately 1440 -1420cm-1 in the raw coal may be attributed to the presence of C – H as asymmetric bending while the peaks at the range of 1580 – 1520 cm-1 obtained in both activated carbons with activating agents of KOH and NaOH indicate the C = C stretching band and aromatic skeletal stretching vibration of Lactone and Carbonyl groups [Mastalerz and Bustin, 1995; Cuhadaroglu and Uygun, 2008].
Most of the AC produced from different modes of activation at various temperatures exhibited similar IR spectroscopic features. In figures 3-2 and 3-3, the characteristic broad coal absorptions which were observed in precursor are virtually absent at the temperatures of activation above 7000C which is indicative of the complete carbonization of the samples. Also, the analysis of figures 3-2 and 3-3 reveals that the two activating agents exhibited remarkable differences in FTIR spectra absorption at the activation temperatures of 8000 -10000C.
At the above temperature range, the AC produced with the activating agent of NaOH is characterized with various wave bands of different functional groups. There are high intensity H – bond and –OH stretching of the carboxyl, phenol and alcohol vibration of 3500 – 3400 cm-1 and
International Journal of Research in Engineering & Applied Sciences Email: [email protected], http://www.euroasiapub.org
(An open access scholarly, peer-reviewed, interdisciplinary, monthly, and fully refereed journal.)
24
corroborative evidence of higher degree of activation of the sample in favour of KOH. But the main differences between the carbonization products are observed from the characteristics of the band of C – H aromatic stretching. From figures 3-2 and 3-3, the result shows that NaOH activated carbon samples have much higher content to C – H than KOH activated carbon samples. Some weak bands also appeared in the range of 900 – 600 cm-1 which associated with out-of-plane bending mode of C – H and O – H groups.
Scanning electron microscopy (SEM) was used to investigate the variation in the surface of derived (activated) carbon samples. Figure 3-4 shows the SEM images of the microstructure of the raw coal while figures 3-5 to 3-6 are those of the activated samples obtained from different modes of activation. From the analysis, the surface topology of the precursor differed significantly from the activated samples. The surfaces of the raw coal were fairly smooth with few cracks or voids, but in activated carbon, the external surfaces were characterized by irregular cavities and pores. Thus, the activation process produced many large pores of varying shapes and sizes at the entire surface of the every sample.
In comparing the SEM images of the activated carbon samples produced at the temperature range of 6000 – 10000C, one can notice that the pore channels become wider and the pore walls become thinner as the temperature increases. This can be explained by the increase in the burn-off of the volatile substances. The more organic matter is removed from the activated carbon the wider and thinner will be the pore channels and the walls respectively. Hence, the observation revealed that the carbonization temperature from 9000 to 10000C seemed to produce the climax of pore development. According to Zawawi and co-workers [2017], the pore development may be caused by the breakdown of some materials in the precursor due to thermal expansion during the activation step.
4. Conclusion
The chemical activation process which was employed in this study proved to be one of the most efficacious methods of synthesizing AC from carbonaceous materials. The quality of AC produced from most of the activating agents is substantially improved and much higher than the adsorptive rating of average standard adsorbent. The characteristic properties were observed to be function of nature of activating agent, impregnation ratio and carbonization temperature. The highest values of the adsorptive parameters of surface area, iodine value, pore volume, fixed carbon etc were recorded by KOH activating agent while H3PO4 produced the least. These assessed parameters as
International Journal of Research in Engineering & Applied Sciences Email: [email protected], http://www.euroasiapub.org
(An open access scholarly, peer-reviewed, interdisciplinary, monthly, and fully refereed journal.)
International Journal of Research in Engineering & Applied Sciences Email: [email protected], http://www.euroasiapub.org
(An open access scholarly, peer-reviewed, interdisciplinary, monthly, and fully refereed journal.)
International Journal of Research in Engineering & Applied Sciences Email: [email protected], http://www.euroasiapub.org
(An open access scholarly, peer-reviewed, interdisciplinary, monthly, and fully refereed journal.)
27
ACKNOWLEDGEMENT
International Journal of Research in Engineering & Applied Sciences Email: [email protected], http://www.euroasiapub.org
(An open access scholarly, peer-reviewed, interdisciplinary, monthly, and fully refereed journal.)
28
Reference
Amir, S. (2012), Production of Activated Carbon within the indirect Gasification Process, Master’s Thesis, Chalmers University of Technology, Gothenburg, Sweden, 3 -12.
Azargohar, R. (2009), Production of Activated Carbon and Its Catalytic Applications for Oxidation of Hydrogen Sulphide, Ph.D Thesis, University of Saskatchewan, Canada, 14-20.
Cuhadaroglu, D. and Uygun, O. A. (2008), Production and Characterization of Activated Carbon from a Bituminous Coal by Chemical Activation, African Journal of Bio-technology Vol.7 (20), 3703 – 3710.
Echegi U.S.C. (2017), Activated Carbon; Production, Properties and Applic-ations: A Review, International Journal of the Arts and the Sciences, Vol. 3, No.1, 61-68.
Echegi U.S.C (2013), Kinetics of Adsorption of Carotene from Palm Oil on Activated Carbon from Enugu Coal, Ph.D Thesis, Enugu State University of Science and Technology, Enugu, Nigeria, 21 – 40.
Echegi U.S.C, Ejikeme P.C.N and Okoye J.O (2017), Studies of Effect of Temperature, pH and Particle sizes on the Removal of Carotene from Palm Oil by Activated Carbon, International Journal of Advanced Research in Science, Engineering and Technology, Vol. 4, Issue I, 3217 – 3224. Eze K.A, Echegi U.S.C and Aneke N.A.G (2017), Bioavailability Study of Heavy Metals in ESWAMA
Central Dump site, Enugu, IJOJAS, Vol. 4. No 2, 48-57
Fierro V., Torneo Fernandez V. and Celzard (2007), Methodical Study of Chemical Activation of Kraft Lignin with KOH and NaOH; Microporous – Mesoporous Mater.
Hassler J.W. (1988), Purification with Activated Carbon, Chemical Publishing Co., New York, 135 – 152.
Hesas R. H., Arami-Nuja A., Ashri W.M., and Sahu J.N (2013), Preparation and Characterization of Activated Carbon from Apple Waste by Microwave Assisted Phospho-ric Acid Activation. Application in Methylene Blue, Bioresources 8(2), 2950 – 2966.
Lillo-Rodena M.A., Juan-Juan J., Cazorla-Amorous D., Linares-Solon A., (2004) About Reactions Occurring during Chemical activation with Hydroxides, Carbon 42: 1371-1375.
Mastalerz M., and Bustin R.M (1995), Application of Reflection Micro-Transform Infrared Spectrometry in studying Coal Macereals, Fuel, 74, 536 – 542
Marsh H. and Rodriguez-Rarioso F. (2006), Activation Processes (Thermal or Physical) in Activated Carbon, Elsevier Science Ltd, Oxford, 243 – 321.
McDougall G.J. (1991), The Physical Nature and Manufacture of Activated Carbon, J.S. African Institute of Mining and Metallurgy, Vol 91, No 4., 109 – 120.
McEnanney B., and Mays T.J., (2002) Porosity in Carbons: Characterization and Applications, Halsted
Press, London, UK, 1st edition, Chapter 4.
Mousa Al-Aamri and Al-Mustasim Al-Qalhati (2017), Effects of H3PO4 and KOH on Pyrolysis of
International Journal of Research in Engineering & Applied Sciences Email: [email protected], http://www.euroasiapub.org
(An open access scholarly, peer-reviewed, interdisciplinary, monthly, and fully refereed journal.)
29
Nilgun K.O., Likun Y, Reha and Ayse, O (2008/), Sulphurdioxide Adsorption by Activated Carbons having different Effect of Microporous Carbon on Ordered Structure of Confined SO2, Chem. Phys. Lett. 329(1- 2): 71-75.
Rafsanjani H.H., Kamandari H., Najjarzadeh H. (2013), Study on Pore and Surface Development of Activated Carbon Produced from Iranian Coal in a Rotary Kiln Rector, Iranian Journal of Chemical Engineering, Vol. 10. No. 3, 27 – 33.
Robau-Sanchez A., Aguilar-Elguezabal A., and Aguilar-Pliego (2005), Chemical Activation of Quercus Agrifolia Char using KOH: Microporous and Mesoporous Materials, 85, 331 – 339. Santamaria J.C, Klevin K.C., Wang Y.H., and Prencke E.C (2006), Specific Surface Determination
and Relevance. Can.Geotech; J. 39, 233 -241.
Suarez-Garcia F., Martinez-Alonso A., and Tascon J.M.D (2002), A Comparative study of the Thermal Decomposition of Apple Pulp with phosphoric acid, polymer degradation and stability 75, 375 – 383.
Supaluknari S., Larkin F.P., Redlich P., Jackson W.R (1998), An FTIR Study of Australian Coals: Characterization of Oxygen Functional groups, Fuel Proc. Technology 19: 123 – 140.
Yufus M.I, Ariahu C.C and Igbabul B.D., (2012), Production and Characterization of Activated Carbon from Selected Local Raw Materials, African Journal of Pure and Applied Chemistry, Vol. 6. (6), 123-.131.
Zawawi N.M, Hamzah Faszlena, Sarif M., Manaf Shareena F.A and Idris A (2017); Characterization of Activated Carbon using Chemical Activation Microwave Ultrasonic System, Malaysian Journal of Analytical Sciences, Vol. 21, No 1., 159 – 165.
Zhang Liqiang, Mi Mi, Bing Li and Yang Dong (2013), Modification of Activated Carbon by Means of Microwave Heating and its Effects on the Pore Texture and Surface Chemistry, Research Journal of Applied Sciences, Engineering and Technology 5(5): 1836 – 1840.
American Society for Testing and Materials (2004), Standard Test Method for Moisture Content Determination in Activated Carbon D280.
American Society for Testing Materials (2008), Standard Test Method for Total Ash Content Determination in Activated Carbon, Designation D2866 – 94.