285
Effect of Parity on Dynamics of Milk Yield and Composition
during Normal Lactation in Dairy Cows
Simona Baul
1, Ludovic-Toma Cziszter
1, Stelian Acatincai
1, Traian Cismas
1,2,
Dinu Gavojdian
3, Iulian Tripon
1, Silvia Erina
1, Genoveva Buzamat
11
Faculty of Animal Science and Biotechnologies, Banat University of Agricultural Sciences and Veterinary Medicine, 300645, Timisoara, Romania
2
Direction for Agriculture of Braila County, 810209, Braila, Romania
3
Research and Development Station for Sheep and Goats of the Romanian Academy for Agricultural Sciences and Forestry, 325400, Caransebes, Romania
Abstract
The purpose of the research was to study the effect of lactation order on milk quality and quantity for 125 lactations of Romanian Black and White cows breed, data were recorded and statistically analyzed by ANOVA / MANOVA method determining the average values and dispersion indices. Based on averages parameters of lactation curves were calculated using the mathematical model proposed by Wood called incomplete gamma function. For the order of lactation there were significant differences (p<0.05) for the evolution of milk daily quantity (parameter a) between 1st and 3rd lactation (-4.39805 kg), for the daily milk growth rate (parameter b) the difference was significant (p<0.05) between lactation 1 and 3 (-0.07683 kg) and for daily milk loss rate (parameter c) there were distinct significant differences (p <0.01) between lactation 1st and lactation 3rd (-0.00254). There were significant differences (p<0.05) for the rate of decrease in the amount of milk between lactation 2 and lactation 3 (-0.00093 kg). Also, there were significant differences (p<0.05) for the growth rate of daily milk between lactation 3 and lactation 5 and above (0.02134 kg) and for daily rate of decrease in the amount of milk the difference being 0.00045 kg.
Keywords: dairy cows, lactation order, milk dry matter, milk quality, Romanian Black and White breed
1. Introduction
Lactation order is generally correlated with age of the cows, milk yield during production life varying from on lactation to another. Lowest production per lactation is achieved at the first lactation. With advancing age, milk production increase to reach the maximum at the 3rd 4th lactations, then starts again to decrease [1].
At the beginning of their productive lives, when anabolic processes predominate, general metabolism is excessive, milk production increases until adulthood, when anabolic-catabolic ratio is balanced, and then dropping it becomes
* Corresponding author: Baul Simona, Tel 0040-256
277 084, Email [email protected]
negative. Also udder is not fully formed at first calving, increasing its weight and capacity for a certain period of time depending on the breed and individuality. To reach morphological maturity and increases digestive capacity, multiparous cows are able to consume more feed and thus synthesize more milk [2-4].
The purpose of the research was to study the effect of lactation order on milk quality and quantity in Romanian Black and White Spotted cows breed.
2. Materials and methods
286 Data were recorded and statistically analyzed by means of ANOVA / MANOVA determining the average values and dispersion indices.
Based on averages parameters of lactation curves were calculated using the mathematical model proposed by Wood, called the incomplete gamma function [5].
3. Results and discussion
In Table 1 are presented the average values and dispersion indices for incomplete gamma function parameters on the daily milk production on normal lactation according to the lactation order in cows from the Romanian Black and White Spotted breed studied.
The amount of milk in the first day of control (parameter a) was the lowest in primiparous cows, 13.03 kg, followed by secundiparous cows with 14.83 kg.
Highest initial quantity of milk has been produced by cows that were in their 3rd lactation with 17.43 kg of milk. For lactation 4 and above this, the quantity of milk in early lactation was 16.19 kg milk.
Daily growth rate of milk (parameter b) was only 0053 kg to 0087 kg cows in primiparous cows and ones from 4th lactation.
The value of this parameter was obtained from cows in 3rd lactation, namely 0129 kg. Values of the parameter b, which describes the growth rate of the milk to reach peak lactation curve for lactation 2 and lactation 5 and over were relatively equal, approximate of 0.11 kg.
Daily drop rate of milk (parameter c) was the lowest in primiparous cows of 0.00102 kg, increasing to a value of 0.00263 kg during second lactation.
The highest rate of daily decrease in the quantity of milk after reaching peak lactation curve was obtained from cows in lactation 3, being 0.00356 kg. Cows in lactation 4 had the smallest parameter of only 0.00227 kg, increasing to five cows with more than five lactations the value of 0.00311 kg. Lactation curve aspect is of particular importance in the nutritional management of dairy cows being preferred in this regard cows that have high initial production, with a growth rate lower production to peak is reached as late and a lower rate of decline in production after peak lactation curve.
Therefore are preferred cows with good persistence of milk production, especially in the second half of lactation.
From this point of view, primiparous cows do not fit because they have a low initial production and growth rate and decrease the amount of milk less. In contrast, cows in third lactation, although they have a high initial amount of milk very quickly reaches maximum and then decreases rapidly as it is, with so a weaker persistence of lactation.
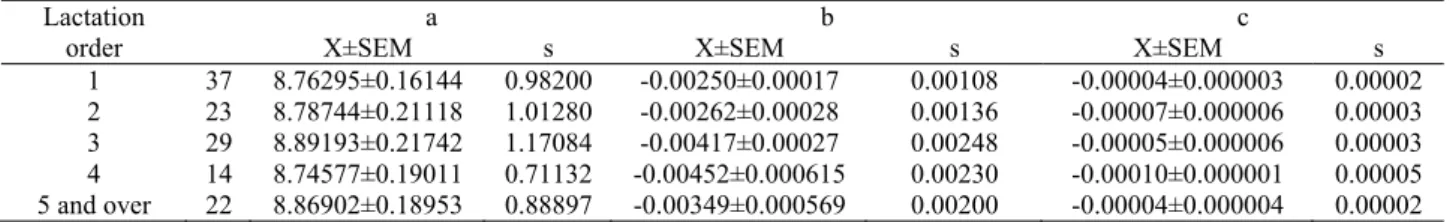
Table 3 presented the average values and dispersion indices for incomplete gamma function parameters to the percentage of total solids (percent) per day of normal lactation based of the lactation order of cows from the Romanian Black and White Spotted breed.
The percentage of total solids in milk on the first day of control (parameter a) was highest in cows in lactation 5 and above being 13.28%, the value is approximately equal to that of cows in lactation 3 (13.17%) and value minimum percentage of total solids was obtained from cows in lactation 4 (12.57%).
Daily rate of decrease in the percentage of total solids (parameter b) had the minimum value in primiparous cows (-0.0029%) nearly double was obtained from secundiparous cows (-0.0044%), increased in lactation 3 (- 0.0076%) and reaches peak in lactation 4 (-0.0112%), then gradually start to decline in lactation 5 and over (-0.0086%). Daily growth rate of the percentage of total solids (parameter c) had the lowest value in primiparous cows (-0.00010%) and lactation 3 (-0.00009%). The highest rate of increase in the percentage of total solids was obtained from multiparous cows in lactation 4 (-0.00026%).
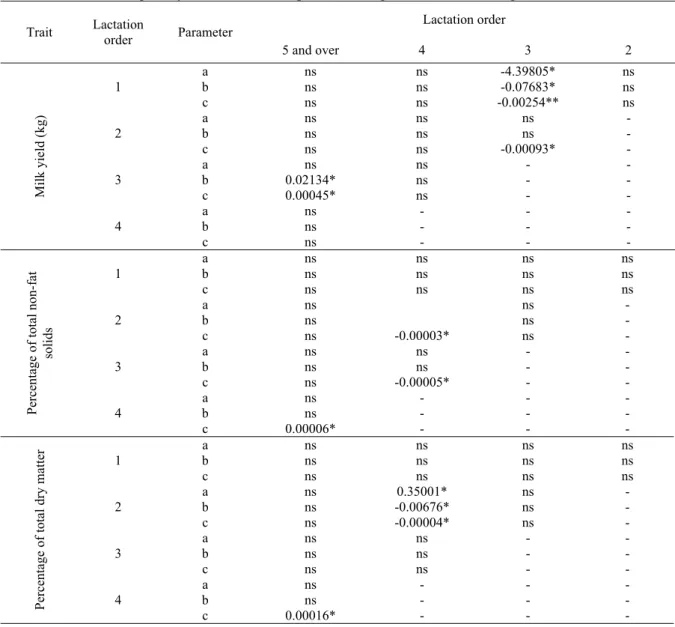
Table 4 shows the differences and statistical significance for the development of incomplete gamma function parameters of milk and chemical components (non-fat solids and dry matter) of milk during lactation in the order lactating cows Romanian Black Spotted studied.
287 There were significant differences (p <0.05) for the rate of decrease in the amount of milk in lactation 2 and lactation 3 (-0.00093 kg). Also, there were significant differences (p <0.05) for the growth rate of milk daily between 3 and lactation lactation 5 and above (0.02134 kg) and daily rate of decrease in the amount of milk a difference of 0.00045 kg.
There were significant differences (p <0.05) for the evolution of the percentage of dry non-fat solids regarding daily growth rate (parameter c) the percentage of dry non-fat solids between lactation 2 and lactation 4 (0.00003%), between lactation 3 and lactation 4 (-0.00005%) and between lactation 4 and 5th and above, the difference being 0.00006%.
The rest of lactations, changes in daily percentage of dry non-fat solids for the three parameters were not significant (p 0.05).
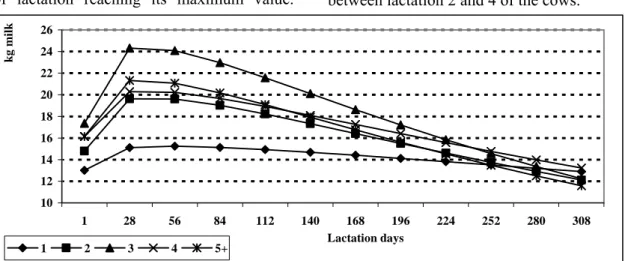
Variation of Wood's function parameters from one lactation to another result in obtaining lactation curves with different aspect in relation to lactation
order. Thus, in Figure 1 is found that primiparous cows had a flatter lactation curve compared with cows in third lactation, which had a lactation curve with the sharpest aspect.
Comparing the parameter b to the parameter c will get the number of days of lactation when cows will achieve maximum daily milk yield. Thus, it can be seen that with age the animals’ lactation curve peak is reached earlier during lactation. Primiparous cows reach peak lactation in 52 days, 40 days secundiparous cows and cows with 3 or more than 3 lactations approx. to 35 days.
In Figure 2, it can be observed that, regardless of the order lactation, percentage of total non-fat solids is maximum on the first day of lactation and then begins to decrease in the first month of lactation, remains constant in the second month of lactation after the start grow until weaning of the cows. This trend is maintained, but within the normal variation in fat dry milk 8.6% - 8.9%.
Table 1. Averages and dispersion indices for the incomplete gamma equation parameters for the daily milk production (kg) on normal lactation based on age of the Romanian Black and White cows
Lactation order n X±SEM s X±SEM s X±SEM s a b c
1 37 13.030661.24256 5.82811 0.053060±0.00096 0.00589 0.00102±0.00265 0.00044 2 23 14.838331.50345 7.21032 0.105840±0.00132 0.00633 0.00263±0.00275 0.00057 3 29 17.428711.09898 6.68483 0.12989±0.036120 0.00770 0.00356±0.00300 0.00064 4 14 16.183961.95925 7.33085 0.08700±0.027283 0.00729 0.00227±0.00216 0.00058 5 and greater 22 16.199441.31251 7.06807 0.10855±0.032051 0.00595 0.00311±0.00316 0.00059
Table 2. Averages and dispersion indices for the incomplete gamma equation parameters for the daily solids non-fat Lactation
order
a b c
X±SEM s X±SEM s X±SEM s
1 37 8.76295±0.16144 0.98200 -0.00250±0.00017 0.00108 -0.00004±0.000003 0.00002 2 23 8.78744±0.21118 1.01280 -0.00262±0.00028 0.00136 -0.00007±0.000006 0.00003 3 29 8.89193±0.21742 1.17084 -0.00417±0.00027 0.00248 -0.00005±0.000006 0.00003 4 14 8.74577±0.19011 0.71132 -0.00452±0.000615 0.00230 -0.00010±0.000001 0.00005 5 and over 22 8.86902±0.18953 0.88897 -0.00349±0.000569 0.00200 -0.00004±0.000004 0.00002
Table 3. Averages and dispersion indices for the incomplete gamma equation parameters for the daily total solids percent on normal lactation based on age of the Romanian Black and White cows
Lactation
order X±SEM s X±SEM s X±SEM s a b c
288
Table 4. Differences and their significance for the incomplete gamma equation parameters for daily evolution of milk quantity and chemical components during lactation based on age of cows
Trait Lactation order Parameter Lactation order
5 and over 4 3 2
Milk yield (kg)
1
a ns ns -4.39805* ns
b ns ns -0.07683* ns
c ns ns -0.00254** ns
2 a ns ns ns - b ns ns ns -
c ns ns -0.00093* -
3
a ns ns - -
b 0.02134* ns - -
c 0.00045* ns - -
4 a ns - - - b ns - - -
c ns - - -
Percentage of to
tal non-f
at
solids
1
a ns ns ns ns
b ns ns ns ns
c ns ns ns ns
2 a ns ns - b ns ns -
c ns -0.00003* ns -
3
a ns ns - - b ns ns - -
c ns -0.00005* - -
4 a ns - - - b ns - - -
c 0.00006* - - -
Percentage of to
tal dry
matter
1
a ns ns ns ns
b ns ns ns ns
c ns ns ns ns
2 a ns b ns -0.00676* 0.35001* ns - ns -
c ns -0.00004* ns -
3
a ns ns - - b ns ns - - c ns ns - -
4 a ns - - - b ns - - -
c 0.00016* - - -
Also might be observed that primiparous cows, secundiparous and ones in the 4th lactation multiparous, the percentage of total non-fat solids is higher than the first control.
In Figure 3 it can be observed that for all lactations percentage of total solids have high value on the first day of control then begins to decrease in the first month of lactation, remains constant in the second month of lactation, after which it begins to rise gradually to weaning. Similar to non-fat solids, total dry matter at the last control is greater than the total dry matter from the first control in primiparous cows, secundiparous and the multiparous in their 4th lactating.
4. Conclusions
► Daily evolution in the percentage of dry matter was significantly (p0.05) influenced by the lactation order.
► The percentage of total non-fat dry solids had a greater value in early lactation, then decreases until reaching a minimum and then increases slowly until the end of lactation. There were significant differences (p 0.05) for the daily growth rate of the percentage of protein.
289 of lactation and then begin to increase until the
end of lactation reaching its maximum value. Significant differences (pbetween lactation 2 and 4 of the cows. 0.05) were obtained
10 12 14 16 18 20 22 24 26
1 28 56 84 112 140 168 196 224 252 280 308
Lactation days
k
g
milk
1 2 3 4 5+
Figure 1. Evolution of the milk yield during the normal lactation according to the age of Romanian Black and White cows
8.5 8.55 8.6 8.65 8.7 8.75 8.8 8.85 8.9 8.95
1 28 56 84 112 140 168 196 224 252 280 308
Lactation days
kg
no
n-fa
t so
li
d
s
1 2 3 4 5+
Figure 2. Evolution of the milk total solids non-fat percentage during the normal lactation according to the age of Romanian Black and White cows
11.5 12 12.5 13 13.5 14
1 28 56 84 112 140 168 196 224 252 280 308
Lactation days
d
r
y
m
a
tte
r
1 2 3 4 5+
290
References
1. Velea, C., Productia, reproductia si ameliorarea taurinelor, Vol. I, Ed. Tehnica agricola, 1999, pp. 228-242.
2. Stanciu, G., Tehnologia creşterii bovinelor, Ed. Brumar, 1999, pp. 125-130.
3. Cziszter, L.T., Dirijarea funcţiei glandei mamare, Ed. Eurostampa, 2003, pp. 130-133.
4. Acatincai, S., Tehnologia cresterii bovinelor, Ed. Agroprint, 2010, pp. 77-83.