Lucrări ştiinţifice Zootehnie şi Biotehnologii, vol. 42(1) (2009), Timişoara.
ANALYSIS OF ECONOMIC EFFICIENCY IN BROILERS
FATTENING
ANALIZA EFICIENTEI ECONOMICE IN INGRASAREA
PUILOR BROILERI
L. SABAU 1, AGATHA POPESCU 2 1
Breading Prod Commercial Company , Giarmata, Timis County
2
University of Agricultural Sciences and Veterinary Medicine, Bucharest , Romania E-mail :agatha_popescu@yahoo.com
The paper aimed to analyze economic efficiency in broilers fattening . In this purpose , the study was carried out at Breading Prod Commercial Company, Giarmata, Timis County . The economic and financial results of two series of broilers fattening have been comparatively analyzed based on the following specific indicators variable costs ( one day chicken supply , medicines, disinfectants , veterinary services , straw bed, feeding, fuels, electricity , watering , labor force ) , fixed costs ( rent, interest, fixed assets depreciation , communication and other taxes ), total production costs , cost per marketed broiler, cost per square meter , cost per kg live weight , gross margin , incomes ( incomes coming from marketed broilers and subsidies) , profit, profit rate , profit per marketed broiler, profit per square meter, profit per kg live weight , costs to 1,000 incomes and incomes to 1,000 costs. This comparison proved that the higher the chickens series size , the higher costs and incomes . The both fatenning series have profitable but the series S2 registered lower financial performances .
Keywords: analysis, economic efficiency , broilers fattening
Introduction
This paper aimed to present a study regarding economic aspects in broilers fattening in a private farm producing about 170 tons live weight per series in 45 days .
Materials and Methods
The paper was carried at Breading Prod Commercial Company , Giarmata , Timis County during the year 2008. The data have been collected from two series of broilers fattened at Ortisoara Farm : Series S1 , Spring 2008 ( February 4 - March 24, 2008, lasting 45 days ) and Series S2 , Fall 2008 (October 23 - December 9 ,2008 , lasting 48 days) . The economic efficiency has been assessed by means of the following specific indicators : variable costs ( one day chicken supply , medicines, disinfectants , veterinary services , straw bed, feeding, fuels, electricity , watering , labor force ) , fixed costs ( rent, interest, fixed assets depreciation , communication and other taxes ), total production costs , cost per marketed broiler, cost per square meter , cost per kg live weight , gross margin , incomes ( incomes coming from marketed broilers and subsidies ) , profit, profit rate , profit per marketed broiler, profit per square meter, profit per kg live weight , costs to 1,000 incomes and incomes to 1,000 costs. All these indicators are expressed in Euro at the exchange rate : Euro 1 = Lei 3.78 for the Series S1 and Euro 1 = Lei 3.98 for S2.
Results and Discussion
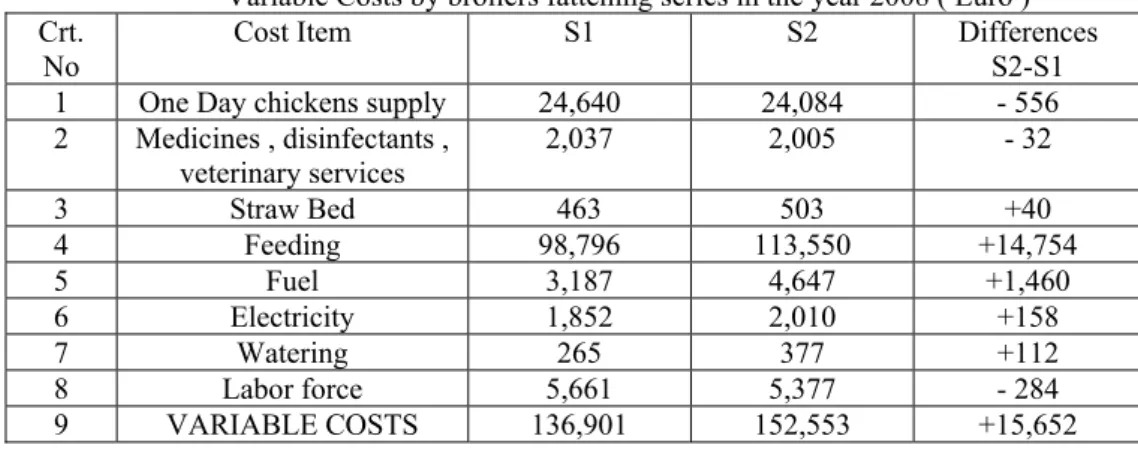
The Variable Costs have been Euro 136,901 for S1 and Euro 152 ,553 for S2. Therefore , the series S2 registered costs by Euro 15,652 or 11.49 % higher than S1 (Table 1 ).
The variable costs were influenced by the number of chickens at the beginning of fattening : 66,000 heads for S1 and 68,400 heads for S2 and the price per one day chicken :Euro 0.38 /head in case of S1 and Euro 0.36 /head in case of S2.
Medicines , disinfectants and veterinary services counted for Euro 2,037 in case of S1 and Euro 2,005 in case of S2.
Straw bed cost was Euro 463 in case of S1 and Euro 503 in case of S2. This cost item depended on the number of straw ballots used per series ( 500 ballots for S1 and 800 ballots for S2 ) and the ballot price .
Feeding costs registered Euro 98,796 for S1 and Euro 113,550 for S2. This cots item was influenced by ratio structure ( Prestarter 5.35 % , Starter 16.07 % , Grower 42.85 % , Finisher 35.73 % ), the amount supplied of each sort of recipe and the price per recipe . The total amount of combined fodder for S1 was 302,174 kg and for S2 365,673 kg, assuring a food consumption per broiler for the whole fattening period of 4.72 kg for S1 and , respectively 5.54 kg for S2.
Electricity , required for the functioning of feeding, watering , heating and washing installations , registered Euro 1,852 for S1 and Euro 2,010 .
Watering cost was Euro 265 for S1 and Euro 377 for S2.
Labor cost registered Euro 5,661 for S1 and Euro 5,377 for S2. The farm has 6 full time employees ( 4 workers , 1 zootechnician and an accountant ) and also part time employees on the occasion of broilers out and loading in the trucks, manure and straw bed out and fattening blocks cleaning and disinfection.
Table 1 Variable Costs by broilers fattening series in the year 2008 ( Euro ) Crt.
No
Cost Item S1 S2 Differences
S2-S1 1 One Day chickens supply 24,640 24,084 - 556 2 Medicines , disinfectants ,
veterinary services 2,037 2,005 - 32
3 Straw Bed 463 503 +40
4 Feeding 98,796 113,550 +14,754
5 Fuel 3,187 4,647 +1,460
6 Electricity 1,852 2,010 +158
7 Watering 265 377 +112
8 Labor force 5,661 5,377 - 284
9 VARIABLE COSTS 136,901 152,553 +15,652
Table 2 Fixed Costs by broilers fattening series in the year 2008 ( Euro )
Crt. No
Cost Item S1 S2 Differences
S2-S1
1 Rent 2, 400 2, 400 -
2 Interest 2,381 2,381 -
3 Depreciation 1,310 1,310 -
4 Communication 529 529 -
5 Environment Tax and
other taxes 220 220 -
6 FIXED COSTS 6,840 6,840 -
The Fixed costs registered Euro 6,840 in case of S1 and Euro 6,840 in case of S2. They included rent cost Euro 2,400 ( Euro 1,200 per month x 2 months /series ), interest to the credit line Euro 2,381 per two months /series , phone calls costs Euro 529 per two months, environment tax and other taxes Euro 220 and depreciation of fixed assets Euro 1,310 ( feeding equipment, watering equipment, heating equipment, ventilation equipment, assisting computer , sprayers etc ) as shown in Table 2 .
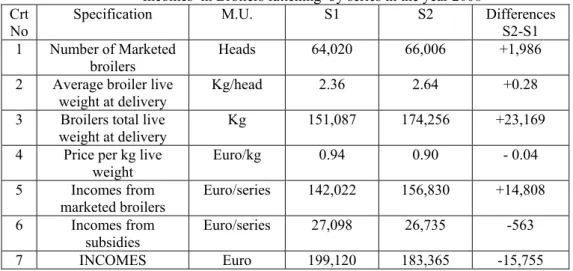
The incomes coming from chickens were determined by the number of marketed broilers ( 64,020 heads in case of S1 and 66,006 heads in case of S2 ) , average live weight at delivery per series ( 2.36 kg/head in case of S1 and 2.64 kg /head in case of S2 ) , total live weight per series at delivery ( 151,087 kg for S1 and 174,256 kg for S2 ) and the market price per kilogram live weight ( Euro 0.94 /kg for S1 and Euro 0.90 /kg for S2 ). Therefore , the income coming from marketed broilers counted for Euro 142,022 for S1 and Euro 156,830 for S2.
The income coming from subsidies represented Euro 27,098 for S1 and Euro 26,535 for S2. According to the regulation in force , the Government subsidy is Lei 1.6 per every chicken delivered at a live weight higher than 1.95 kg.
Table 3 Incomes in Broilers fattening by series in the year 2008
Crt No
Specification M.U. S1 S2 Differences
S2-S1 1 Number of Marketed
broilers Heads 64,020 66,006 +1,986
2 Average broiler live
weight at delivery Kg/head 2.36 2.64 +0.28 3 Broilers total live
weight at delivery Kg 151,087 174,256 +23,169 4 Price per kg live
weight
Euro/kg 0.94 0.90 - 0.04
5 Incomes from
marketed broilers Euro/series 142,022 156,830 +14,808 6 Incomes from
subsidies Euro/series 27,098 26,735 -563
7 INCOMES Euro 199,120 183,365 -15,755
Financial Results are presented in Table 4 . Gross Margin recorded Euro 62,219 in case of S1 and Euro 30,812 in case of S2 . As a result , profit was Euro 55,379 in case of S1 and Euro 23,972 in case of S2. Therefore , the both series are profitable , but the series S2 is less profitable as costs are by 10.88 % compared to the costs registered by series S1 and incomes are by about 8 % lower compared the ones registered by S1.
Table 4 Financial Results in broilers fattening by series in the year 2008 ( Euro ) Crt.
No Specification S1 S2 Differences S2-S1
1 Incomes 199,120 183,365 -15,755
2 Variable Costs 136,901 152,553 +15,652
3 Gross Margin 62,219 30,812 - 31,407
4 Fixed Costs 6,840 6,840 -
5 Profit 55,379 23,972 -31,407
Table 5 Parameters of Economic Efficiency in Broilers fattening by series in the year
2008 Crt
No Specification M.U. S1 S2 Differences S2-S1 1 Income per marketed
broiler Euro/head 3.11 2.78 -0.33
2 Income per square
meter Euro/s.m. 49.78 45.84 -3.94
3 Income per kg live weight
Euro/kg 1.32 1.05 -0.27
4 Cost per marketed
broiler Euro/head 2.24 2.41 +1.07
5 Cost per square meter Euro/s.q. 35.93 39.84 +3.91 6 Cost per kg live
weight Euro/kg 0.95 0.91 -0.04
7 Profit per marketed
broiler Euro /head 0.87 0.37 -0.50 8 Profit per square meter Euro/s.m. 13.85 6.00 -7.85 9 Profit /kg live weight Euro/kg 0.37 0.14 -.023 10 Costs to 1,000
incomes
Euro/1,000 722 869 +147
11 Incomes to 1,000 costs Euro/1,000 1,385 1,150 -235 12 Profit Rate % 38.52 15.03 - 23.49
As a result , profit per marketed broiler was Euro 0.87 in case of S1 and Euro 0.37 in case of S2, profit per square meter was Euro 13.85 in case of S1 and Euro 6 for S2 and profit per kilogram live weight was Euro 0.37 for S1 and Euro 0.14 for S2.
Conclusions
1.This comparison proved that the higher the chickens series size , the higher costs and incomes .
2.The both fatenning series have profitable but the series S2 registered lower financial performances due to the exchange rate ( Romanian Lei depreciation ) and the increasing input prices.
3.Also, the longer duration of fattening for S2 have had a deep inpact on feeding consumption and cost . Feed consumption per marketed broiler was 5.54 kg for 48 days in case of S2 compared to 4.72 kg for 45 days in case of F1 . The length of fattening was longer , because the slaughterhouse did not respect the contract concluded with the farmer to receive broilers at the specific date .
4.Microclimate conditions in case of series S2 were not so corresponding leading to higher mortalities compared to S1 , with a deep impact on the live weight delivered at the end of fattening and incomes coming from marleted broilers. 5.As a final conclusion, the farmers must continuously keep production costs under control and pay more attention to the selection of his clients .
References
1. Dinu Ion Dumitru , 1996 , Animals and Mankind , CERES Publishing House, Bucharest
2.Ecio de Farias Costa , Jack Houston , 2004 , Consumer –driven profit maximization in broiler production and processing , Revista de Economia e Sociologia Rural, vol.42, no.1.
3.Halley John , 2005 , Profound impact of nutrition on broiler profitability , Cobb World Technical Support , infor@cobb-europe.com
4.Popescu Agatha, 2007, Comparison concerning economic efficiency in Broilers Fattening in various sized farms, Buletin USAMV Cluj Napoca , Vol.64 .
5.Popescu Agatha , Criste Rodica ,2003 , The increase of economic efficiency in broilers fattening by using the diets based on full fat soybean . The 32nd Annual
Session of Scientific Communications , Faculty of Animal Science, USAMV Bucharest, October 15-17 , 2003 , 6 p, ( (p.40)