International Journal of Research in Engineering & Applied Sciences
Email:- editorijrim@gmail.com, http://www.euroasiapub.org
98
CREEP BEHAVIOR AND CREEP LIFE ASSESSMENT OF HP40Nb REFORMER
STEEL
*AmitavaGhatak, **P.S. Robi
Department of Mechanical Engineering, Indian Institute of Technology Guwahati, Assam, India
ABSTRACT
Centrifugally cast high Cr steels are widely used in petroleum and chemical industries as reformer tubes. In this paper, creep behavior of HP40Nb microalloyed tube steel has been examined at temperatures in the range of 1073 K – 1173 K at different stress levels. The creep deformation behavior follows the Dorn law equation. The constitutive creep equation was obtained using the data obtained from the accelerated creep tests. Following the Orr-Sherby-Dorn parametric technique, the creep life of the material at a service temperature of 1273 K was 10.7 years at a stress of 10 MPa.
Key Words: HP40Nb steel, Creep, Activation energy, Orr-Sherby-Dorn parameter, Creep life.
Introduction
HP40Nb microalloyed steel is used as reformer furnace tubes in chemical and petroleum industries for continuous production of hydrogen gas by catalytic reaction of hydrocarbons and steam [1-2]. The operating temperature of these tubes are generally in the range from 1073 K to 1273 K with an expected design life 105 h. Degradation of the microstructure resulting from the prolonged service exposure at high temperature and stress, many a times, results in premature failure of the tubes. This leads to forced shutdown of the plant and severe economic loss for the industry. A clear understanding of the creep behavior of the steel is required for a proper design of the components for the intended service life.
Material behavior during creep deformation is often complicated. Correlation between the applied stress (σ), test temperature (T) and minimum creep rate 𝜀 𝑚 , are often expressed by constitutive
equations [3]. A number of different creep constitutive relationships have been proposed for modeling creep deformation behavior of metals and alloys [4]. Among the various constitutive equations, the widely accepted relationship is Dorn law [5] expressed as:
𝜀 𝑚 = 𝐴 exp 𝛽𝜎 exp − 𝑄
𝑅𝑇 (1)
whereA and β are constants, σ is applied stress in MPa, Q is the activation energy for creep in J/mol, R is gas constant (= 8.314J/ K- mol) and T is the absolute temperature in Kelvin. The constitutive parameters
i.e. A, β and Qis determined from the creep test data.
International Journal of Research in Engineering & Applied Sciences
Email:- editorijrim@gmail.com, http://www.euroasiapub.org
99
304L stainless steel using two different constitutive equations. Sawada et al. [10] predicted long termcreep curve and proposed constitutive equations for various stainless steels. Damage characterization of HP40Nb steels after 10 years of service exposure at 1223 K was reported by Alvino et al. [11]. To the best of our knowledge, study related to creep behavior of the microalloyed HP40Nb reformer steel based on constitutive equation have not been reported.
Various creep rupture parametric techniques have been developed to predict the long-term creep life of high temperature components. These are mainly by Orr-Sherby-Dorn parameter [12], Larson-Miller parameter [13], Manson-Haferd parameter [14], Manson-Succop parameter [15] etc. Among these, Orr-Sherby-Dorn parametric (PO-S-D) technique is an accepted model and is expressed as:
𝑃𝑂−𝑆−𝐷 = log10𝑡𝑟− 𝑄
2.3𝑅𝑇 (2)
wheretr is the rupture time in hours.
The present work is aimed at investigating the creep behavior and predicting the creep life of HP40Nb microalloyed steel by PO-S-D technique. Accelerated creep tests were carried out for various combinations of temperature and stresses. The data obtained from these experiments was used to develop the constitutive equations for creep deformation behavior.
2. Material and methodology
2.1 Material and specimen preparationMaterial used for investigation was centrifugally cast reformer tube. The inside diameter and thickness of the tube are 106 mm and 15.3 mm, respectively. The chemical composition of the steel analyzed by optical emission spectrometer is shown in Table 1. Flat tensile creep specimens of 25 mm gauge length, 6.5 mm width and 3 mm, were machined by wire-cut electric discharge machining. The axis of the specimen was kept parallel to the longitudinal axis of the reformer tube.
Table -1: Chemical composition of the steel in wt. %.
C Si Mo Cr Ni Nb Ti Fe
0.4 1.3 0.037 23.6 34.9 0.8 0.037 Balance
2.2 Creep test
Nine tensile creep tests were carried out at various combinations of stresses (47 MPa, 68 MPa and 80 MPa) and temperatures (1073 K, 1123 K, and 1173 K). The specimen was heated to the test temperature by an impedance heater. The temperature of the specimen was measured by an Infrared pyrometer and controlled within an accuracy of ± 3 K till failure of the sample. A high definition video camera was used for on-line recording of the specimen gauge length extension during the creep test. The digital frames extracted from the video recording were used to determine the time dependent creep strain by image analysis technique. The minimum creep rate 𝜀 𝑚for various combinations of temperatures and stresses
were determined from the creep curve.
3. Results and discussion
3.1 Minimum creep strain rateFig. 1(a) and (b) show the semi-logarithmic plots of 𝜀 𝑚vs. temperature and 𝜀 𝑚vs. stress, respectively.
International Journal of Research in Engineering & Applied Sciences
Email:- editorijrim@gmail.com, http://www.euroasiapub.org
100
the figures (Fig. 1(a) and (b)), the lines are the best least squares fit to the data points. From the figures,it can be seen that a linear relationship exists between the logarithm of 𝜀 𝑚 and temperature or applied
stress. The maximum and minimum 𝜀 𝑚 values are 5.05 × 10⁻⁴ s-1 and 6.25 × 10⁻⁸ s-1 at 80 MPa/1173 K and
47 MPa/1073 K, respectively.
3.2 Rupture time
Fig. 2(a) and (b) show semi-logarithmic plots of creep rupture time tr vs. test temperature and applied stress, respectively. The figures reveal that the rupture time of the steel increase with decrease in temperature and/or stress. The lines in Fig. 2(a) and (b), represents the best least squares fit to the data points. The maximum and minimum rupture times are 441728 s and 197 s at 47 MPa/1073 K and 80 MPa/1173 K, respectively.
(a)
(b)
International Journal of Research in Engineering & Applied Sciences
Email:- editorijrim@gmail.com, http://www.euroasiapub.org
101
3.3 Constitutive equationThe values of 𝜀 𝑚 obtained from creep curves were used to determine the constitutive parameters viz.
constantsA and β, and activation energy for creep Q, of Eq. 1. The constitutive parameters were determined by the least squares by minimizing the functional error ei, between the experimental and predicted values of 𝜀 𝑚. The error eiwas definedby
𝑒𝑖= ln(𝜀 𝑚) − ln 𝐴 − 𝛽𝜎 + 𝑄
𝑅𝑇 (3)
wherei is the number of observations. The three unknown parameters, A, β and Q of Eq. 1 was determined by minimizing the error. The values obtained for A, β and Q by the optimization technique is1.05 × 1013 s-1, 0.52 and 468.5 kJ/mol, respectively.
(a)
(b)
International Journal of Research in Engineering & Applied Sciences
Email:- editorijrim@gmail.com, http://www.euroasiapub.org
102
Substituting these values in Eq.1, the constitutive equation for creep deformation within thedomain of experimental conditions is expressed as:
𝜀 𝑚 = 1.05 × 10¹³ 𝑒𝑥𝑝 0.52 𝜎 𝑒𝑥𝑝 − 468500
𝑅𝑇 (4)
The reported value of activation energy for lattice diffusion in austenitic steel is 270 kJ/mol [16]. In the present investigation, the activation energy for creep is found to be 468.5 kJ/mol. Higher activation energy obtained for the present material is due to the presence of carbides particles in the matrix which impedes the dislocation motion during the creep deformation.
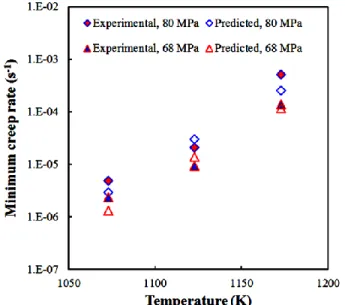
The predicted minimum creep rate 𝜀 𝑚𝑝 for combination of stresses and temperatures were
determined using Eq. 4. Comparison of minimum creep rate obtained from the experiment 𝜀 𝑚𝑒 and by
Eq. 4 for 68 MPa and 80 MPa stresses are shown in Fig. 3. Experimental and predicted minimum creep rates at 68 MPa/1173 K are found to be 1.38 × 10⁻⁴ s-1 and 1.15 × 10⁻⁴ s-1, respectively indicating a good agreement between experimental and the predicted values.
Fig -3: Plot of minimum creep rate vs. temperature of experimental data and predicted data.
The semi-logarithmic plot of 𝜀 𝑚vs. σ for experimental data and calculated values for constant
International Journal of Research in Engineering & Applied Sciences
Email:- editorijrim@gmail.com, http://www.euroasiapub.org
103
Fig -4: Plot of minimum creep rate vs. stress of experimental data and predicted data.The percentage error between ln(𝜀 𝑚𝑒) and ln(𝜀 𝑚𝑝)was calculated. The maximum percentage
error is found to be 14%, which is obtained for creep test at 47 MPa/ 1123 K. The result shows that Eq. 4 is indicative of the creep deformation behavior of the material within the domain of present experimental conditions.
3.4 Creep life prediction
Rupture time obtained from the accelerated creep test was used to calculate the Orr-Sherby-Dorn parameter PO-S-D. In this technique, the activation energy for creep (Q = 468.5 kJ/mol) obtained from the constitutive model was used for the analysis. Fig. 5 shows the semi-logarithmic plot of σ – PO-S-D, master curve for the investigated steel. The average value of PO-S-D for each stress levels was used to plot the master curve. In Fig. 5, the continuous line represents the trend line fitting the data points with a coefficient of determination R2 = 0.988. The trend line was used for the extrapolation of PO-S-D values corresponding to a stress of 5 MPa.
International Journal of Research in Engineering & Applied Sciences
Email:- editorijrim@gmail.com, http://www.euroasiapub.org
104
The creep life of the steel was estimated from the master curve plot. PO-S-D values for the steel atstresses 5 MPa, 10 MPa, 15 MPa and 20 MPa were obtained by drawing horizontal lines corresponding to these stresses to meet the extrapolated curve and subsequently projecting to the PO-S-D axis. The respective values of PO-S-D for the above stresses obtained are -13.92, -14.17, -14.43 and -14.67. The creep life tr of the steel for various temperatures were determined by substituting the PO-S-D values in the equation:
𝑡𝑟 = 10 𝑃𝑂 −𝑆−𝐷+
𝑄
2.3𝑅𝑇 (5)
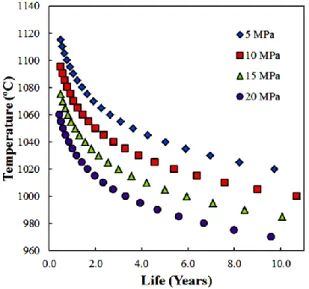
Fig. 6 shows the plots of creep life vs. temperature for the steel at different stresses. The plot indicates that the creep life of the steel increases with the decrease in temperature and /or decrease in stress. Life of the steel for a designed hoop stress of 10 MPa and at 1273 K is found to be 10.7 years.
Fig. 6.Plot of temperature vs. life at different stresses of the steel.
The result of the study indicates that the material can be safely used at 1273 K/10 MPa for 11½ years. However, extreme caution should be taken so that the service conditions are not exceeded during the application.
4. Conclusion
Accelerated creep tests using constant stress creep setup have been carried out to analyze the creep behavior and to predict the creep life of the steel. Conclusions of the present investigation are summarized as follows:
Minimum creep rate increases non-linearly with the increase in stress or temperature. Rupture time increases non-linearly with the decrease in stress or temperature.
Dorn law equation provides an acceptable result to predict minimum creep rate. The value of A, β
and Q are obtained as 1.05 × 10¹³ s-1, 0.52 and 468.5 kJ/mol, respectively, for the investigated steel.
International Journal of Research in Engineering & Applied Sciences
Email:- editorijrim@gmail.com, http://www.euroasiapub.org
105
The creep rupture life of the steel has been evaluated by using the Orr-Sherby-Dorn parameter. A creep life of 10.7 years at 1273 K and 10 MPa was predicted by PO-S-D technique.
Acknowledgement
The authors wish to thank Numaligarh Refineries Limited, India for providing the reformer tube to carry out the study.
References
[1] GhatakA.and RobiP.S., “Effect of temperature on the tensile properties of HP40Nb microalloyed reformer steel”, International Conference onProcessing and Fabrication of Advanced Materials XXII, Institution of Engineers Singapore (IES),Singapore, pp534-543
[2] WahabA.A. and KralM.V., 2005, 3D analysis of creep voids in hydrogen reformer tubes, Materials Science and Engineering A, 412(1-2),pp 222-229.
[3] SellarsC.M.and McTegartW.J., 1966, On the mechanism of hot deformation, ActaMetallurgica,14(9),pp1136-1138.
[4] HoldsworthS.R., AskinsM., BakerA., GariboldiE., HolmstromS., KlenkA., RingelM., MercklingG., SandstromR., SchwienheerM.and SpigarelliS., 2008, Factors influencing creep model equation selection, International Journal of Pressure Vessels and Piping, 85(1–2),pp 80-88.
[5] J. T. Boyle, and J. Spence, (1983) Stress Analysis for Creep, Butterworth & Company Ltd.
[6] PadilhaA.F., EscribaD.M., Materna-MorrisE., RiethM.and KlimenkovM., 2007, Precipitation in AISI 316L(N) during creep tests at 550 and 600 °C up to 10 years, Journal of Nuclear Materials, 362(1),pp 132-138.
[7] LathaS., MathewM.D., ParameswaranP., RaoK.B.S.and MannanS.L., 2008, Thermal creep properties of alloy D9 stainless steel and 316 stainless steel fuel clad tubes, International Journal of Pressure Vessels and Piping, 85(12), pp 866-870.
[8] HayhurstD.R., Vakili-TahamiF.and ZhouJ.Q., 2003, Constitutive equations for time independent plasticity and creep of 316 stainless steel at 550 °C, International Journal of Pressure Vessels and Piping, 80(2), pp 97-109.
[9] TahamiF.V., Daei-SorkhabiA.H.and BiglariF.R., 2010, Creep constitutive equations for cold-drawn 304L stainless steel, Materials Science and Engineering A, 527(18-19), pp 4993-4999.
[10] SawadaK., TabuchiM.and KimuraK., 2009, Analysis of long-term creep curves by constitutive equations, Materials Science and Engineering A, 510–511, pp 190-194.
[11] AlvinoA., LegaD., GiacobbeF., MazzocchiV. andRinaldiA., 2010, Damage characterization in two reformer heater tubes after nearly 10 years of service at different operative and maintenance conditions, Engineering Failure Analysis, 17(7-8), pp 1526-1541.
[12] OrrR.L., SherbyO.D.and DornJ.E., 1954, Correlations of rupture data for metals at elevated temperature, Transactions ASM, 46, pp 113-128.
[13] Larson F.R.and MillerJ., 1952, Time temperature relationship for rupture and creep stress, Transactions ASME, 74, pp 765-771.
[14] Manson S.S.and HaferdA.M., 1952,A linear time temperature relation for extrapolation of creep and stress rupture data, NASA TN2890.
[15] Manson,SSand Succop,G (1956). in: Stress-Rupture Properties of Inconel 700 and Correlation on the Basis of Several Time-Temperature Parameters, edited by ASTM, of Symposium on Metallic Materials for Service Temperatures Above 1600 F, ASTM-STP 174, ASTM,.