Italian Journal of Science & Engineering
Vol. 1, No. 3, October, 2017
Three-Phase Multistage System (DC-AC-DC-AC) for Connecting
Solar Cells to the Grid
Mahmudreza Changizian
a*, Ali Zakerian
a, Araz Saleki
aa Faculty of Electrical Engineering, K. N. Toosi University of Technology, Tehran, Iran
Abstract
Inverter systems that feed electrical power from photovoltaic (PV) system into the grid must convert the direct current of the PV array into the alternating current of the grid. In many applications, it is important for a converter to be lightweight, highly reliable, input/output isolated, flexible and operable in a boost mode. These features can be achieved by using a High-Frequency inverter which involves an isolated DC-DC stage and DC-AC section, which provides AC output. This paper proposes a new three phase topology, based on multi stage converter and PV system in order to use in medium and high power applications. The Perturb and Observe (P&O) method is used for maximum power point tracking (MPPT) control of PV array. The switching control signals for three-phase inverter are provided by hysteresis control method. Also, the comparison between the proposed topology and traditional structures has been conducted and finally the simulation researches are performed in a closed-loop control system by MATLAB/Simulink software to verify the operation of the proposed structure. The results represent better performance of the introduced system over traditional topologies.
Keywords:
Photovoltaic (PV); Boost Inverter; Current-Source Inverter; High-Frequency Inverter; Maximum Power Point Tracking (MPPT).
Article History:
Received: 10 September 2017
Accepted: 02 November 2017
1- Introduction
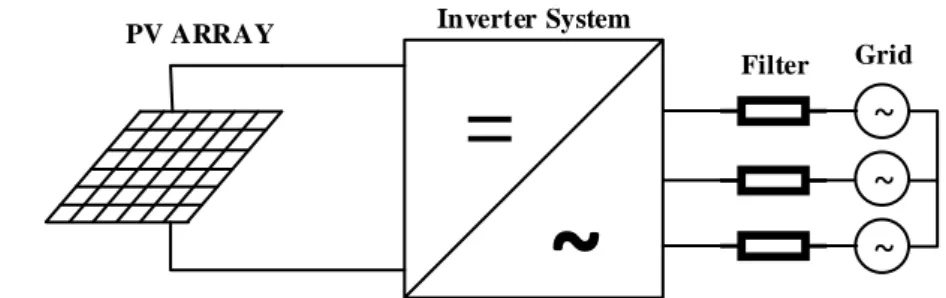
As available amount of fossil fuels in the world is decreasing and on the other hand their negative effects on the environment are completely obvious to everyone, applications of the renewable energy sources are gaining more traction continuously. As a renewable-energy source, photovoltaic (PV) energy has achieved rapid growth, and grid-connected has become one of the major applications of solar energy [1]. These systems get connected to the main grid via power inverters. In applications where the power is 5 kW and higher, network is usually in the form of a three-phase system [2]. The principle structure of this system is shown in Figure 1. There are several inverter topologies in order to connect the DC input of the solar cells to the grid. Three fundamental structures of these topologies are as follows:
PV system with a line-frequency transformer
PV system without transformer
PV system with a high-frequency (HF) transformer
Figure 1. Principle structure of photovoltaic system
*CONTACT:[email protected]
DOI:http://dx.doi.org/10.28991/ijse-01116
© This is an open access article under the CC-BY license (https://creativecommons.org/licenses/by/4.0/).
=
~
~
~
~
PV ARRAY Inverter System
1-1-PV system with a line-frequency transformer
The applied DC voltage is converted to a line frequency AC voltage via a full-bridge inverter [3]. This is then transmitted via a line frequency transformer and subsequently fed into the main grid [4]. Figure 2 shows a three-phase structure of this converter. The advantages and disadvantages of this topology can be listed as follows:
Benefits:
Highly reliable due to having fewer components
Safety through galvanic isolation of the DC and AC sides Disadvantages:
Low degree of efficiency due to high transformer losses
Heavy weight and volume (e.g., due to 60 Hz transformer)
1-2-PV system without transformer
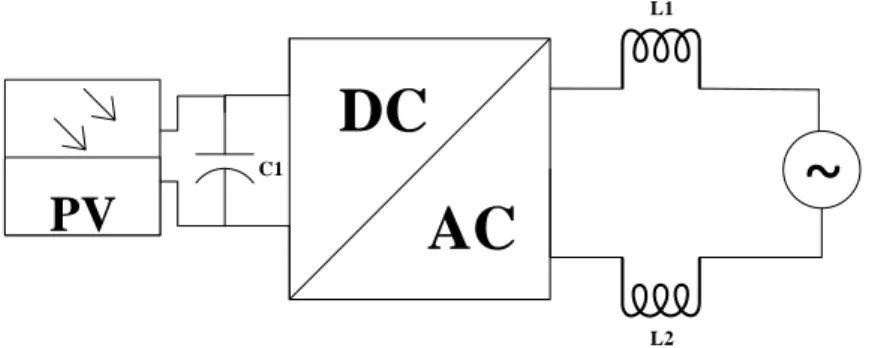
The existing DC voltage is converted to a square line frequency (for example 60 Hz) AC voltage via a full-bridge converter, then smoothed to a sinusoidal 60 Hz AC voltage via the chokes (L1, L2) and fed into the main grid [4-5]. The principle structure of this system is shown in Figure 3. In [5], the benefits and the drawbacks of this topology are expressed as follows:
Benefits:
Compact and light because of the transformer
Very high degree of efficiency (due to absence of transformer losses) Disadvantages:
Additional safety measures (residual current circuit breaker) required. In some countries, omitting galvanic isolation between the DC and AC sides is not permitted.
Complicated lightning protection
Not compatible with modules that must be grounded
Furthermore, this topology can be designed by two stages of boost DC-DC and DC-AC converters. As a result, this topology has some problems; First, DC and AC sides are not isolated. Second, the output voltage is limited (1:1 to 1:3).
1-3-PV system with a high-frequency (HF) transformer
The full-bridge topology generates a high-frequency square-wave signal, which is transmitted via the HF transformer. The bridge rectifiers convert the square-wave signal back to DC voltage. The second full-bridge inverter then generates an AC voltage, which is smoothed to a sinusoidal line frequency AC voltage and fed into the main grid [5-6]. The benefits of this topology can be written as follows:
Compact and light, due to the small dimensions and less weight of HF transformer
High degree of efficiency through reduction of transformer losses
More degree of safety because of galvanic isolation between the DC and AC sides
Suitable for all module technologies, as module grounding (positive and negative) is possible
Achieving high voltage gain
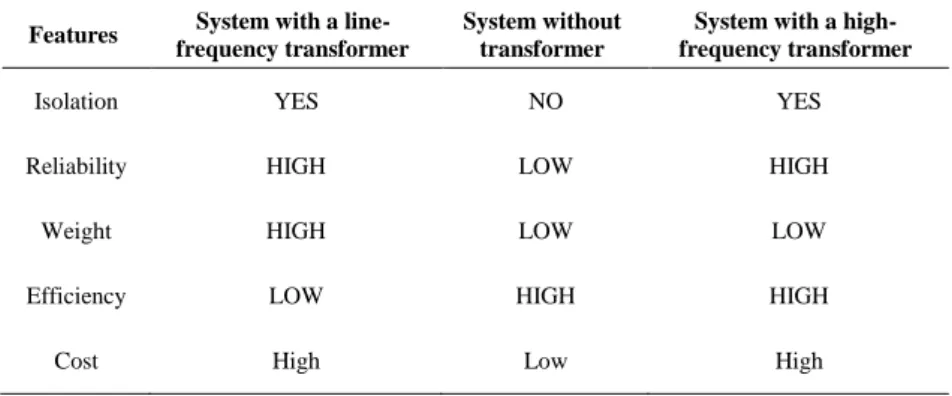
Table 1. shows a summary of different characteristics of the mentioned topologies. Therefor it is obvious that PV system with a HF transformer called DC-AC-DC-AC converter is more preferential than another topologies due to its reliability, isolation and high output voltage range. The AC-AC converter consists of a high-frequency rectifier and an inverter as shown in Figure 4.Of course, the multistage power conversion is somewhat more expensive. The electrical isolation in the high-frequency link is essential because it allows easy array grounding flexibility in selecting array voltage range, array isolation from the utility in case of fault, and safety of personnel.
Table 1. different characteristics of the mentioned topologies
Features System with a line-frequency transformer
System without transformer
System with a high-frequency transformer
Isolation YES NO YES
Italian Journal of Science & Engineering | Vol. 1, No. 3
The main blocks of this topology include:
DC-DC isolation stage
DC-AC converter section
For DC-DC isolation stage, push-pull, half-bridge or full-bridge converter can be used.
In applications where the power is 1 kVA and higher, the full-bridge converter is the ideal choice because of the following reasons [5-7]:
For a given input voltage, the voltage stress on the transistors is double in case of the push-pull topology than half-bridge and full-bridge converters.
The center tapped primary in the push-pull topology limits the operation for a higher VA rating for the same core size when compared to the half-bridge and full-bridge converters.
In order to prevent flux walking in the DC-DC stage, the current in both halves needs to be sensed and the duty cycle needs to be corrected accordingly.
Output voltage in full-bridge is doubled compared to the half-bridge converter.
In the DC-AC section, any type of the inverters such as Voltage-Source Inverter (VSI), Current-Source Inverter (CSI) and Z-Source Inverter (ZSI) can be used [8-9].
2- Description of Selected Power Converter
2-1-Inverter System
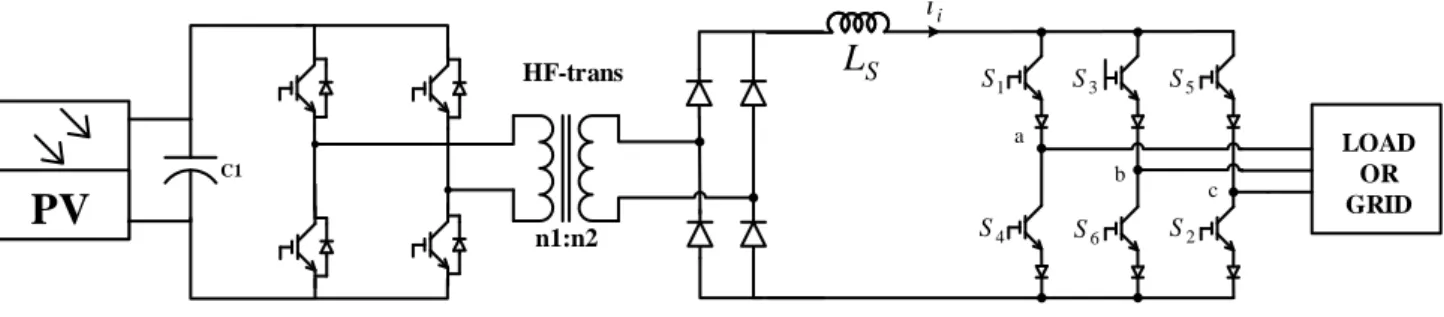
As mentioned before, a DC-AC-DC-AC converter topology was selected to connect solar cells to the grid. This paper proposes a Current-Source Inverter (CSI) for the DC-AC section due to its operation in boost mode and growing up the flexibility of the converter. The use of input inductor of the DC-AC section leads to eliminate the large output filter to connect to the grid. The proposed topology is shown in the Figure 5. Basically, the DC array power is converted to 50-Hz or 60-50-Hz ac line power through an isolated high-frequency transformer link. The DC voltage of the photovoltaic array is at first converted to high-frequency AC by an inverter, which is then transformer-coupled and converted to AC line current through a DC link of an AC-AC converter.
Figure 2.PV system with a line-frequency transformer
Figure 3.PV system without transformer
C2 L1
C1
PV
DC
AC
~
L1
C1
PV
DC
AC
~
Figure 4. PV system with a high-frequency (HF) transformer.
Figure 5.The proposed topology with Current-Source Inverter.
2-2-Control System
There are three steps for the control system of this converter:
Maximum power point tracking control
In-phase synchronization of the current with the utility Line-Voltage
Creating the reference
First, it is essential to calculate the maximum output power of the PV array in different environmental conditions. According to the following equations, the output power of the solar cells depends on two environmental factors, light intensity and temperature [10].
𝐼 = 𝐼
𝐿𝐺− 𝐼
0{exp[
𝑞
𝐴𝐾𝑇
(𝑉 + 𝐼
𝐴𝑃
𝑠) − 1}
(1)Where,
𝐼
0= 𝐼
𝑜𝑟[
𝑇
𝑇
𝑟]
3𝑒𝑥𝑝[
𝑞𝐸
𝐺0𝐵𝐾
{
1
𝑇
𝑟−
1
𝑇
}]
(2)𝐼
𝐿𝐺= [𝐼
𝑠𝑐𝑟+ 𝐾
1(𝑇
𝑐− 28)
/100]
(3)All the symbols in equation (1) to (3) can be defined as: I cell output current,
V cell output voltage, I0 cell saturation current,
T cell temperature in K,
K/q Boltzmann's constant divided by electronic charge TC cell temperature in °C,
K1 short circuit current temperature coefficient at ISCR
cell illumination (mW/cm2),ISCR cell sort circuit current at 28°C and 100 mW/cm2 2.52A,
L1
C1
PV
DC
AC
DC
~
AC
C2DC
AC
HF-trans
HF-inverter
n1:n2
LF-inverter
PV
C1 HF-trans n1:n2 LOAD OR GRID SL
i i 1S S3 S5
4
S S6 S2
a
Italian Journal of Science & Engineering | Vol. 1, No. 3
There are several ways to calculate the maximum power of solar cells. In this paper, perturb and observe (P&O) method is used to calculate the maximum power. This method has true MPPT and low implementation complexity. In addition, this algorithm does not need prior knowledge of PV panel characteristics. Besides, it shows good performance when the sun light does not change quickly [11]. This algorithm is shown in Figure 6.
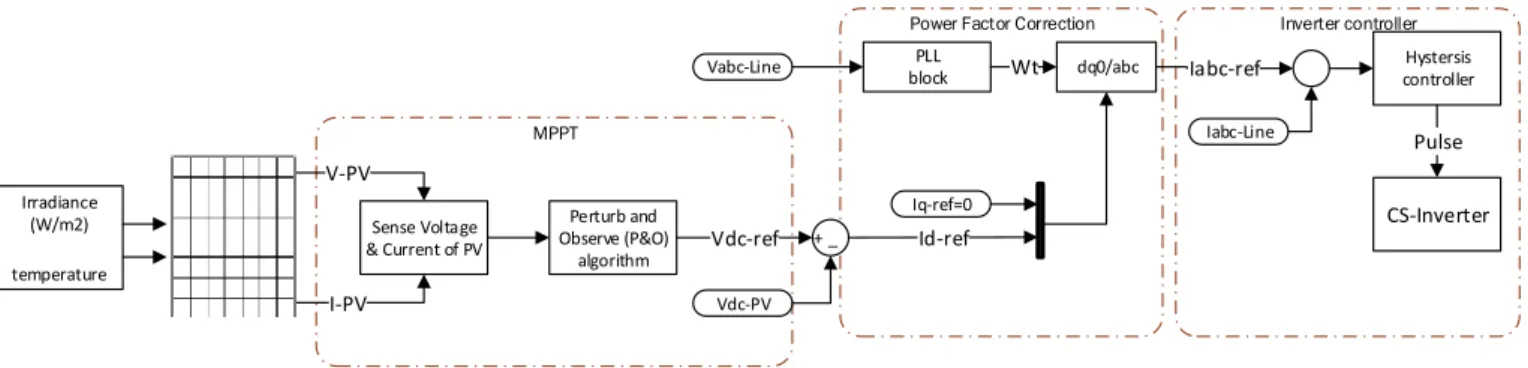
In [12], it is demonstrated that the algorithm also works when instantaneous (instead of average) PV array voltage and current are used, as long as sampling occurs only once in each switching cycle. The next step is to obtain the unity power factor which can be achieved by in-phase synchronization of the current with the utility line-voltage. Generating the reference current by control of inverter switching with hysteresis method is the last step [13]. A block diagram of the control system is shown in Figure 7.
Figure 6.Perturb and Observe (P&O) algorithm
Figure 7. Block diagram of control system
3- Simulation Results
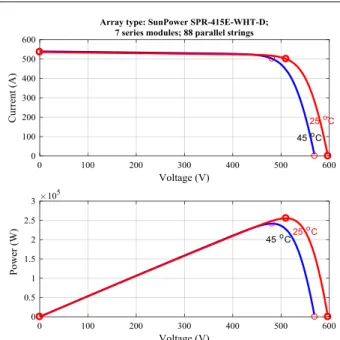
A Three-phase multistage system (DC-AC-DC-AC) with HF-transformer and Current-Source inverter rated at 240kW/480V is simulated using Simulink/MATLAB. The structure parameters are presented in Table II. Simulations are performed to verify the performance of the proposed multistage converter. In the simulations, the 240kW resistive load is simultaneously connected to the grid and PV system. Figure 8 shows the volt-ampere and power curves of the used PV array.
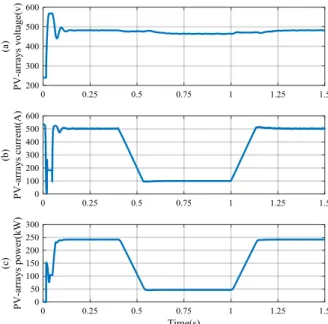
As mentioned in section II, the output power of the solar cells depends on temperature and irradiance. So, it is considered that the test temperature is set on 45°𝐶 and the irradiance varies based on the curve that is shown in Figure 9. The maximum amount of the irradiance is 1000𝑊/𝑚2 before 𝑡 = 0.4𝑠. At 𝑡 = 0.4𝑠 the irradiance starts to
Start
P(k)-P(k-1)=0
No
Return
Sense V(k), I(k)
P(k)-P(k-1)>0
V(k)-V(k-1)>0 V(k)-V(k-1)>0
Yes No
Increase Vref Increase Vref
Decrease Vref Decrease Vref
Yes No No Yes
MPPT
Inverter controller Power Factor Correction
Sense Voltage & Current of PV
V-PV I-PV Perturb and Observe (P&O) algorithm Vdc-ref Id-ref Iq-ref=0
Vabc-Line blockPLL Wt dq0/abc
Iabc-Line
Iabc-ref controllerHystersis
decrease by 200𝑊/𝑚2 and the analogous output power of the PV array decreases to 48𝑘𝑊. At 𝑡 = 1𝑠, the irradiance returns to its maximum value and the output power reaches to the point of 240𝑘𝑊.
Figure 10. shows the waveforms of the PV array. Figure 10a. is the PV-arrays output voltage and Figure 10 (b) is the PV-arrays output current. Also, Figure 10a. exhibits very small voltage fluctuations around the maximum power point. As it can be seen from Figure 10b, the PV-arrays output current alters between 100 to 500𝐴. Figure 10 (c) shows the PV-arrays output power waveform and its variation between 48 to 240𝑘𝑊 due to irradiation changes.
Table 2. Simulation parameters of the multistage converter with current source inverter
Simulation enviroment Simulink
Temperature 45 oc
Irradiance 200 - 1000 W/m2
Number of panels in parallel and series 88×7 Rated power of each panel 400 (W)
Input nominal voltage 480 (v)
Voltage range 465 (v) - 485 (v)
Maximum output power of the PV system 240 (kW)
Rated ac output voltage of converter 480 (v)
Input inductor of CSI 300 µH
Line frequency 60 Hz
Line-to-Line grid voltage (rms) 20 (kv)
Power factor 1
Inverter control method Hystersis
Switching Frequency 10 - 16 kHz
Italian Journal of Science & Engineering | Vol. 1, No. 3
Figure 11. shows the generated reference voltage for achieving the maximum power point and the emulated output voltage of the solar cells. Correspondingly Figure 12 shows the results for the generated reference current in dq0 frame. The output power of AC-side is shown in Figure 13. This figure shows the equality of the output power of the solar cells and delivered power to the load. The converter is connected to the grid using a boost transformer (480v/20kv).
Figure 10. Simulation waveforms of PV-arrays. (a) Output voltage (v); (b) Output current (A); (c) Output power (kW)
Figure 11. Following the reference voltage by output voltage.
Figure 13. Output power at AC side
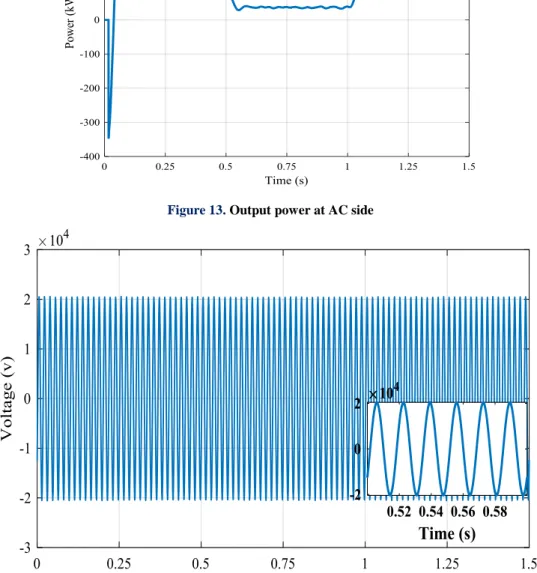
Figure 14. Voltage of connection point to the grid
Figure 14. shows the voltage of the connection point to the grid. The output current made by hysteresis control method is shown in Figure 15. The results show a desired waveform for the output current.
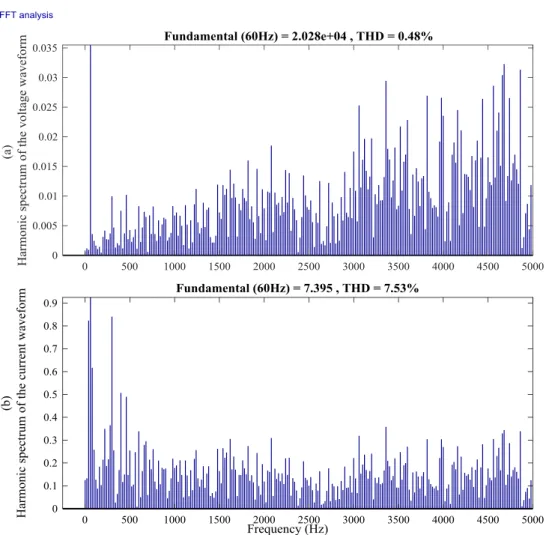
Figure 16a and 16b. show the Total Harmonic Distortion (THD) of the output voltage and output current respectively. The results show the good performance of the proposed topology in condition without output filter.
4- Conclusion
Italian Journal of Science & Engineering | Vol. 1, No. 3
Figure 15. Current of connection point to the grid
Figure 16. The Total Harmonic Distortion (THD) of output waveforms
5- References
[1] B. Rahmani and M. T. Bina, "Reciprocal effects of the distorted wind turbine source and the shunt active power filter: full compensation of unbalance and harmonics under 'capacitive non-linear load' condition," in IET Power Electronics, vol. 6, no. 8, pp. 1668-1682, September 2013.
[2] M. Mohr, W. T. Franke, B. Wittig, and F. W. Fuchs, “Converter systems for fuel cells in the medium power range-a comparative study,” IEEE Trans. Ind. Electron., vol. 57, no. 6, pp. 2024–2032, 2010.
[4] N. Mohan, T. M. Undeland, and W. P. Robbins, “Power Electronics: Converters, Applications, and Design.” John Wiley & Sons, 2003.
[5] Atul Singh and Jabir VS, “Voltage Fed Full Bridge DC-DC and DC-AC Converter for High-Frequency Inverter Using C2000,” no. May, pp. 1–18, 2014.
[6] B. K. Bose, P. M. Szczesny, and R. L. Steigerwald, “Microcomputer Control of a Residential Photovoltaic Power Conditioning System,” IEEE Trans. Ind. Appl., vol. IA-21, no. 5, pp. 1182–1191, 1985.
[7] S. B. Kjaer and F. Blaabjerg, “Design optimization of a single phase inverter for photovoltaic applications,” Power Electron. Spec. Conf. 2003. PESC ’03. 2003 IEEE 34th Annu. vol. 3, pp. 1183–1190, 2003.
[8] S. Rahimzadeh, M. T. Bina, “Planning Required for FACTS Devices to Improve the Steady State Efficiency of Restructured Power Systems: A Review,” international Review of Electrical Engineering (JREE), Vol. 4, n. 3, June 2009, pp. 417-424.
[9] S. Rahimzadeh, M. T. Bina, A. Viki, “Stedy state model of STATCOM and SSSC using averaging technique”, Inter. Rev. of Elec.Eng. (IREE), Vol.4, No.6, pp.1391-1403, 2009.
[10] M. R. Islam, Y. Guo, and J. Zhu, Power Converters for Medium Voltage Networks, vol. 182, no. Mv. Springer, 2014.
[11] T. Esram and P. L. Chapman, "Comparison of Photovoltaic Array Maximum Power Point Tracking Techniques," in IEEE Transactions on Energy Conversion, vol. 22, no. 2, pp. 439-449, 2007.
[12] N. S. D’Souza, L. A. C. Lopes, and X. Liu, L. A. C. Lopes, “An intelligent maximum power point tracker using peak current control,” in Proc. 36th Annu. IEEE Power Electron. Spec. Conf, 2005, pp. 172–177.