39
Classification and Feature Selection Approaches by
Machine Learning Techniques: Heart Disease
Prediction
N. Satish Chandra Reddy, Song Shue Nee, Lim Zhi Min & Chew Xin Ying
School of Computer Sciences,11800, Universiti Sains Malaysia, Pulau Pinang, Malaysia Email: [email protected]
Submitted: 03/08/2018. Revised edition: 05/12/2018. Accepted: 26/12/2018. Published online: Published online: 30/05/2019 DOI: https://doi.org/10.11113/ijic.v9n1.210
Abstract—The heart disease has been one of the major causes of death worldwide. The heart disease diagnosis has been expensive nowadays, thus it is necessary to predict the risk of getting heart disease with selected features. The feature selection methods could be used as valuable techniques to reduce the cost of diagnosis by selecting the important attributes. The objectives of this study are to predict the classification model, and to know which selected features play a key role in the prediction of heart disease by using Cleveland and statlog project heart datasets. The accuracy of random forest algorithm both in classification and feature selection model has been observed to be 90–95% based on three different percentage splits. The 8 and 6 selected features seem to be the minimum feature requirements to build a better performance model. Whereby, further dropping of the 8 or 6 selected features may not lead to better performance for the prediction model.
Keywords—Machine Learning, Feature Selection, R tool, Classification, Prediction
I. INTRODUCTION
The heart disease is said to be major causes of death globally, according to the World Health Organization (WHO) the mortality rate due to heart disease is around 17.7 million (31%) in 2015 and is estimated to increase by 2020. Every year nearly 20 million people die, indicating the heart disease as a leading cause of death [1]. The group of diseases related to both the heart and blood vessels are referred as cardiovascular disease (CVD). The CVD includes coronary heart disease (CHD) or also
40 time, leave the heart too weak to fill and pump properly. The other circulatory system malfunctions are peripheral artery disease (PAD) narrowing of the arteries at the regions of arms, legs, stomach and head legs, stomach), venous thromboembolism (VTE: is a blood clot in a vein), aortic aneurysms (the weakened artery allowing it to widen) [2], [3].
Based on the disease statistics, it is noted that the rate of heart disease is increasing and cannot be identified from the visual prospective since it is caused by many risk factors, and does not show noticeable symptoms. However, the continuous monitoring of different vital signs such as heartbeat, blood pressure, glucose levels, ECG, EEG, EMG, respiratory rate and temperature would be useful to track the early detection of different disease abnormalities. This monitoring has been made possible with an advancement in wireless communication technology “Wireless Body Area Network (WBAN) which consists of tiny Bio-Medical Sensors (BMSs)” which are at reasonable cost. The three methods of BMS deployment includes on body wearable (to monitor blood pressure, ECG and EMG), in-body implantation (to monitor lungs, liver and kidney), and off body (to monitor physical health conditions, body position, arm positions, walking and running). The monitoring of these BMS is done through Body Area Network Coordinator (BANC) following star network topology [4]. The monitoring of the patients is categorized as non-emergency (a normal reading of vital signs such as temperature and glucose levels) and emergency data (signs such as low respiratory rate and high blood pressure). The Medium access control (MAC) Superframe structures uses IEEE 802.15.4 as a protocol [5]. The heterogeneous nature of the patient’s data is classified into Ordinary Packet (OP), Reliability Data Packet (RP), Critical Data Packet (CP) and Delay Data Packet (DP). Though these classifications help to deliver without loss in patient data to medical doctors, and with less energy consumption of BMSs, they lack the consideration of low and high threshold values of vital signs in emergency data categorization. This has been overcome with the help of a traffic priority based MAC protocol and slot allocation based on the alert signals to BMSs respectively, in which the vitals such as heart rate, blood pressure, respiratory rate and temperature has been categorized into threshold ranges of low, normal and high values. These values are useful to provide appropriate and dedicated timeslots to non-emergency and emergency based BMSs. Based on the severities of the threshold values of vital signs BANC allocate slots, apart from resolving the conflict of slots allocation. This protocol improves throughput, reduces packets delay for non-emergency and non-emergency data, consume minimum energy of BMSs and BANC [6], [7].
The enormous amount of the data is being produced from different hospitals and medical centers or an organization. This data is not being used in a proper way, although it contains potential information for further
proceedings such as clinical decision support, disease surveillance and population health management [8], [9]. On the other hand, the clinical decisions made by doctors indicate that there is a chance of leaving the hidden quality from the data leading to errors and unwanted biases. This might affect the medical costs and quality of health services provided to the patients [10]. The decrease in medical errors and unwanted practice variation, improve patient outcome and safety, can be achieved by the integration of clinical decision support with computer-based patient records. The researchers and clinicians are studying different heart disease datasets with different machine learning classification algorithms and features selection methods to bring up possible predictions for heart disease [11], [12]. In this paper, the main objectives are to build a model with prevails performance, and to identify which selected features play a key role in the prediction of heart disease by using Cleveland and statlog project heart datasets from UCI [13] with R tool.
II.LITERATURE REVIEW
This section reviews some work related to classification and feature selection methods applied for the prediction of heart diseases. Heart being one of the main organs of the body allows the pumping of the blood through blood vessels (i.e., circulatory system). The oxygen and other materials such as nutrients, hormones and waste substances are carried out to the other parts of the body through blood. Thus, heart is referred to play an important role in circulatory system. The condition where the impairment of the heart occurs is referred to as heart disease. The heart disease or cardio vascular disease refers to the disorders of heart and blood vessels. The different types of heart diseases are coronary heart disease, heart attacks (blocked vessels or myocardial infarction) and angina (coronary artery disease). The coronary heart disease leads to heart attack and is said to be one of the major causes for the individual death globally (WHO). The non-modifiable risks factors such as age, gender, genetic or family history, ethnicity or race, and modifiable risk factors such as cholesterol, high blood pressure, hypertension, lack of physical exercise, smoking, obesity and stress are responsible for heart diseases [14] [15].
A. Data Mining and Machine Learning Algorithms
41
1) K-Nearest Neighbor’s Algorithm
It is a simple classifier that cannot handle noises, easy to implement and understand, requires short training time and whole training set is used for prediction. The K-Nearest Neighbors (K-NN) with weighting parameter has been used for the prediction of heart disease. Among 13 attributes mentioned in UCI heart disease dataset, the selection of 8 attributes due to simple measurements has been taken into consideration for this study. The study shows the accuracy of 81.9 % and also mentioned that 8 attributes such as age, sex, chest pain, trestbps, trestbpd, restecg, thalrest, exang are more than enough to predict heart disease [17]. The similar techniques (KNN) have been used along with the feature selection technique such as particle swarm optimization (PSO) for the heart disease prediction where it shows 100% accuracy [18].
2) Support Vector Machine (SVM)
Based on the kernel functions the support vector classifiers are divided into different types such as linear, nonlinear, radial basis function (RBF), sigmoid and polynomial. The hyperplane or support vector machine separates the support vector or data points. The different classification techniques such as K-Nearest Neighbors, J48 Decision tree, SMO and Naive Bayes based on 8 attributes with 10 fold cross validation in WEKA was used. The four features have been extracted using gain ratio evaluation technique. The highest accuracy is found to be in J48 with 83.73% [19]. In another study, the different datasets of heart, diabetes and cancer were classified using SVM, RBF and Naïve Bayes in Weka. Among 3 classifiers SVM showed the highest accuracy of 93.75% and also seem to be most effective and robust classifier in predicting diseases [20].
3) Random Forest
Random forest constructs a multitude of decision trees at training time and output the mode prediction of the classes for classification and the mean prediction for regression. The different patterns in the data are evaluated by the decision tress. The class prediction is based on the majority vote for classification. The random forest with 10 fold cross validation along with feature selection methods such as chi square and genetic algorithm was used to for the prediction of heart disease. The single UCI heart dataset was used in this study and the accuracy as found to be 83.70 % and found to be better when compared with other algorithms such as Naïve Bayes, decision tree and neural nets [21]. In another study, the Cleveland heart disease was used with random forest and 10 fold cross validation to get an accuracy of 85.81%, the feature selection approach has given better accuracy [22].
4) Naïve Bayes
Naïve Bayes is a classifier that is based on Bayes theorem, and it assumes the probability of the features which are independent of other features. The different classification algorithms REPTREE, J48, CART, Naïve Bayes and Neural networks have been used on the data collected from medical practitioners in South Africa. Weka tool is used for this purpose and the accuracy of Naïve Bayes is found to be 85.92% [23]. In another study, The single UCI heart disease dataset has been used for the prediction of heart disease using K-NN, decision tree, SVM and Naïve Bayes. The Weka software was used, and the Naïve Bayes shows highest accuracy [24].
5) Neural Network
Neural network is inspired by the biological neural network that constitute in the brain or central nervous system, this is also called as an artificial neural network. It is used in machine learning algorithm, and can be used of classification/supervised learning. The neurons and synapse are interconnected each other that allow passage of messages with in them. The three major parts of the neural network are the input layer, hidden layer and output layer.
The three algorithms such as Neural Networks, J-48 Decision Tree and Naïve Bayes along with feature selection method CfsSubsetEval attribute filter with Best First search method on single UCI heart disease dataset was used. Weka tool was used for this study, and the highest accuracy is shown by Naïve Bayes both with and without feature selection [25]. In another study, the Neural Network with feature correlation analysis (NN-FCA) was studied on Sixth Korea National Health and Nutrition Examination Survey (KNHANES-VI) dataset. In this study, it is found that chronic renal failure and triglyceride were closely related to coronary heart disease. The NN- FCA showed the highest accuracy of 82.51% [26].
B. Feature Selection Approaches
42 1. Trstbps, Restecg, slope, CA, Thal, Age are the best selected features with the approach of novel feature selection, with the selected features the accuracy was found to be 93% and 89 % in neural network and SMO algorithms respectively [28].
2. The recursive Feature Elimination (RFE) has been applied along with stochastic gradient boosting algorithm and the selected features was found to be chest pain, ca, and Thal with the accuracy of 95.45% [30].
3. The 4 feature selection methods have been applied and 12 classification algorithms has been used for heart disease prediction. The application of different feature selection methods showed different best selected features. The highest accuracy was found to be in SVM-linear and Naïve Bayes with an accuracy of 84.81% [31].
III.DATASET
A. Data Sources
In this study, the five heart disease datasets (Cleveland, Switzerland, Hungarian, V.A. Medical and Statlog project heart disease) are collected from publicly available source UCI machine learning repository webpage [13]. The five datasets were combined into single dataset (i.e., combined dataset) for better model performance. The combined dataset consists of 1190 instances with 14 attributes. The characteristics of five heart disease datasets and combined dataset are shown in Table 1.
TABLE 1. Characteristics of five and combined dataset of heart Disease
Datasets No of Instances
No of Attributes
Missing Values
Statlog project 270 14 No Cleveland 303 14 No Hungarian 294 14 Yes V.A. Long
Beach
200 14 Yes Switzerland 123 14 Yes Combined
Dataset
1190 14 Missing values replaced with Mode Value
B. Attributes Description
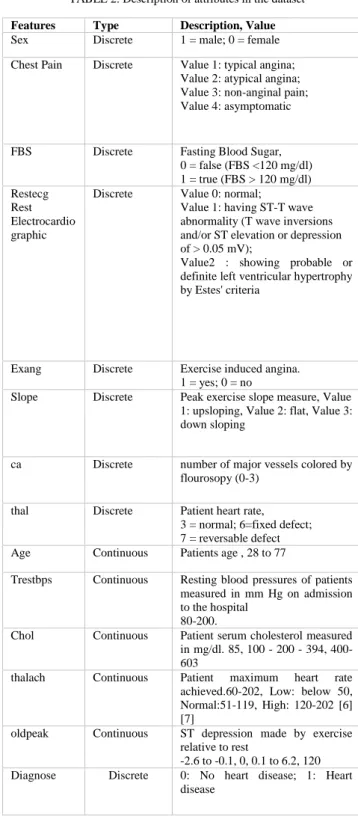
The dataset consists of 14 attributes. The predictable attribute is referred to “Diagnosis” and rest of 13 as input attributes. The attribute descriptions are shown in Table 2.
TABLE 2.Description of attributes in the dataset
Features Type Description, Value
Sex Discrete 1 = male; 0 = female Chest Pain Discrete Value 1: typical angina;
Value 2: atypical angina; Value 3: non-anginal pain; Value 4: asymptomatic FBS Discrete Fasting Blood Sugar,
0 = false (FBS <120 mg/dl) 1 = true (FBS > 120 mg/dl) Restecg
Rest Electrocardio graphic
Discrete Value 0: normal;
Value 1: having ST-T wave abnormality (T wave inversions and/or ST elevation or depression of > 0.05 mV);
Value2 : showing probable or definite left ventricular hypertrophy by Estes' criteria
Exang Discrete Exercise induced angina. 1 = yes; 0 = no
Slope Discrete Peak exercise slope measure, Value 1: upsloping, Value 2: flat, Value 3: down sloping
ca Discrete number of major vessels colored by flourosopy (0-3)
thal Discrete Patient heart rate, 3 = normal; 6=fixed defect; 7 = reversable defect Age Continuous Patients age , 28 to 77
Trestbps Continuous Resting blood pressures of patients measured in mm Hg on admission to the hospital
80-200.
Chol Continuous Patient serum cholesterol measured in mg/dl. 85, 100 - 200 - 394, 400-603
thalach Continuous Patient maximum heart rate achieved.60-202, Low: below 50, Normal:51-119, High: 120-202 [6] [7]
oldpeak Continuous ST depression made by exercise relative to rest
-2.6 to -0.1, 0, 0.1 to 6.2, 120 Diagnose Discrete 0: No heart disease; 1: Heart
43 IV.METHODOLOGY
A. Data Preprocessing
In the data preprocessing stage, missing values are replaced with mode value based on the particular datasets source. Second, taking into consideration that heart disease patients might have high values of respective attributes (i.e., referred as outliers in the dataset) are not removed. The normalization (normalize <- function(x) {return ((x - min (x)) / (max(x) - min(x)))} has been carried out since dataset consists of different measuring units.
B. Data Analysis
After data normalization to build a classification model, the combined dataset with 14 attributes is divided into training and testing data with a percentage split of 60–40%, 70–30% and 80–20% respectively with set.seed (123). The
R -based CARET package
(https://cran.r-project.org/web/packages/) is used for data splitting, pre-processing steps such as normalization, classification algorithms such as K-Nearest Neighbor (KNN, library “caret”, method = 'knn', tuneLength = 10), Support Vector Machine (SVM, library “caret”, method = 'svmLinear', tuneLength =10), Random Forest (RF, library “randomForest”,method='rf',ntree=500,importance=TRUE ), Naïve Bayes (NB, library “e1071”, method = ‘naïve_bayes’) and Neural Network (NN, library “nnet”, method = 'nnet', trace= FALSE) with 10 fold cross validation (method = "cv", number = 10) are evaluated based on the fore mentioned training and testing data. The different feature selections methods such as correlation matrix (library “mblench”), recursive feature elimination
(RFE) method with random forest algorithm (library “mblench”, functions=rfFuncs, method="cv", number=10). The variable importance estimations such as regression method to calculate variable importance (library “mblench”), rank feature by Importance (library “class” and “mblench”) with learning vector quantization model (LVQ) is addressed using CARET package in R tool (http://topepo.github.io/caret/index.html).The performance of a model on test data is calculated by accuracy, sensitivity/recall, and specificity in R tool. Sensitivities and specificity measures the true positives (risk class) and the true negatives (normal class) respectively. Thus the predictive capabilities of the classifiers are measured by sensitivity and specificity values.
V.RESULTS
A. Performance on Combined Dataset
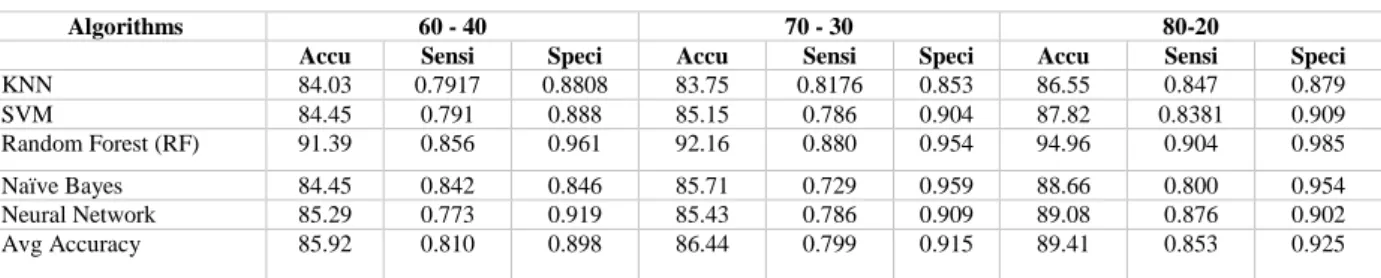
To the best of author knowledge, there is no studies addressed with the combined dataset (i.e., of five heart disease datasets: Cleveland, Switzerland, Hungarian, V.A. Medical and Statlog project heart disease with the five mentioned algorithms in this study) [24] [32]. R tool is selected to understand which classification model has a better performance on combined dataset with 13 features. The performance measures are in accordance with the accuracy of each classification algorithm. Among the five classification algorithms used, the highest accuracy in three percentage splits (60–40, 70–30, and 80–40) has been observed in random forest with a range of 91.39%– 94.96%, and average accuracies (85.92–89.41%) respectively (refer to Table 3).
TABLE 3. The performance comparisons of different percentage splits of combined dataset with 13 features
Accu: Accuracy; Sensi: Sensitivity; Speci: Specificity; k-nearest neighbors algorithm (k-NN), Support vector machine (SVM)
Algorithms 60 - 40 70 - 30 80-20
Accu Sensi Speci Accu Sensi Speci Accu Sensi Speci
44
B. Performance on Feature Selection Attributes
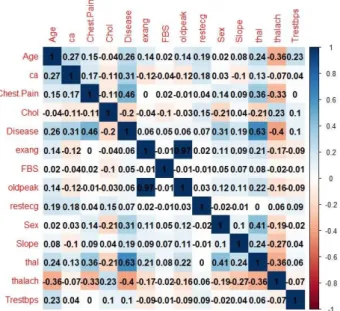
The feature selection is performed on the combined dataset to select a subset of relevant features for model building that aims to improve model accuracy. In this study, a correlation analysis was performed to know the highly correlated attributes, in this case the correlation has been found to be between exang and oldpeak attributes with a given correlation cutoff at 0.75 (refer to Figure 1).
Fig. 1. Correlation plot of the combined dataset
After the removal of exang and oldpeak from the combined dataset the different feature selection methods (see data analysis) implemented in R tool has been applied. The 10 selected features/attributes such thal, ca, chestpain, age, thalach, chol, trestbps, slope, restecg and sex are common across 3 feature methods. The attribute FBS is observed in regression method and rank feature by Importance. The selected features by 3 methods showed the similar order of arrangement/topology with minor differences in the ranking order (refer to Table 4).
Based on the order of the features (refer to Table 4), the common 8 and 6 selected features (refer to Table 5) are taken into consideration to build a model. In 8 selected features, the highest accuracy in three percentage splits (60–40, 70–30, and 80–40) has been observed in random forest with a range of 91.18–94.96%, and average accuracy (85.99–89.07%) respectively (refer to Table 6). Similarly with respect to 6 selected features the highest accuracy in three percentage splits (60–40, 70–30, and 80–40) has been observed in random forest with a range of 89.64–92.44%, and average accuracy (85.20–88.40%) respectively (refer to Table 7).
TABLE 4. The order of best selected features after the removal of exang and old peak attributes
Significance code: ***: 0, **:0.001, *: 0.01
TABLE 5.The common selected features
The highest accuracy in 8 and 6 selected features is found to be in random forest (refer to Table 6 & 7) which is in agreement with the combined dataset with 13 features (refer to Table 3). The 8 selected features show average accuracies with an insignificant of 0.5% in 70– 30 and 80–40 percentage split (refer to Table 6), whereas the 6 selected features (refer to Table 7) showed the decrease in average accuracies (1.24% in 70–30% split and 1.18% in 80–40%) which could be due to the dip in the performance of SVM, RF (in both 70–30% and 80– 40%), and NN (80–40%) to that of combined dataset with 13 features (refer to Table 3).
V. DISCUSSION
In this study, the heart disease prediction has been evaluated with the classification and feature selection algorithms implemented in CARET package of R tool using combined dataset. The highest accuracy is shown by random forest in three percentage split (without and with feature selection). This shows the performed random forest algorithm shows the best performance with the existing model accuracies [22] [33]. The average accuracies of 8 selected feature shows similar results with the combined dataset, indicating these features could be used for the prediction of heart disease as mentioned in the previous studies where KNN algorithm was used [17]. Recursive
Feature Elimination
Regression to Calculate Variable Importance
Rank Feature by Importance
thal thal*** 12.650 thal 0.816 ca ChestPain*** 7.368 ChestPain 0.766 ChestPain ca*** 7.159 thalach 0.734 oldpeak thalach*** 4.330 exang 0.711 thalach Trestbps** 2.731 oldpeak 0.704 Trestbps Sex * 2.520 ca 0.664 Age Slope * 2.226 Age 0.657 Chol Restecg 1.721 Sex 0.632 exang Chol 0.628 Slope 0.605 Slope Exang 0.622 Trestbps 0.547 Sex FBS 0.427 Chol 0.546 restecg oldpeak 0.057 Restecg 0.542 FBS Age 0.050 FBS 0.532
8 selected features thal, chest pain, ca, thalach, trestbps, age, sex and chol
45
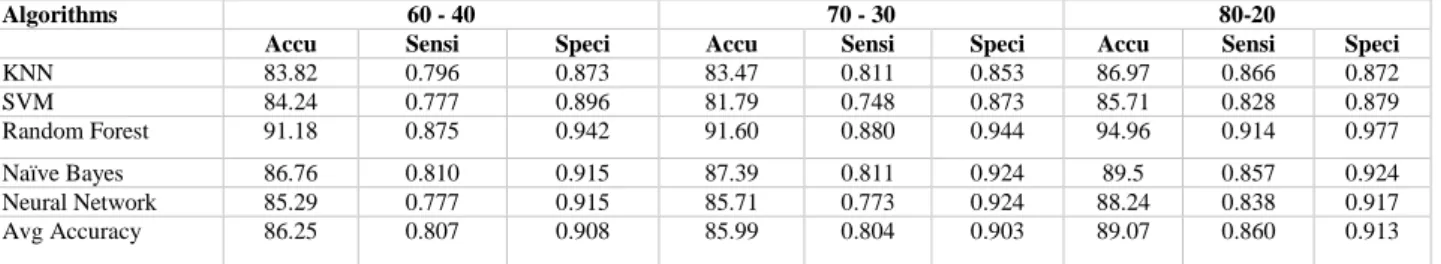
TABLE 6. The performance comparisons of different percentage splits of combined dataset with 8 features
Algorithms 60 - 40 70 - 30 80-20
Accu Sensi Speci Accu Sensi Speci Accu Sensi Speci
KNN 83.82 0.796 0.873 83.47 0.811 0.853 86.97 0.866 0.872 SVM 84.24 0.777 0.896 81.79 0.748 0.873 85.71 0.828 0.879 Random Forest 91.18 0.875 0.942 91.60 0.880 0.944 94.96 0.914 0.977 Naïve Bayes 86.76 0.810 0.915 87.39 0.811 0.924 89.5 0.857 0.924 Neural Network 85.29 0.777 0.915 85.71 0.773 0.924 88.24 0.838 0.917 Avg Accuracy 86.25 0.807 0.908 85.99 0.804 0.903 89.07 0.860 0.913
Accu: Accuracy; Sensi: Sensitivity; Speci: Specificity; k-nearest neighbors algorithm (k-NN), Support vector machine (SVM)
TABLE 7. The performance comparisons of different percentage splits of combined dataset with 6 features
Algorithms 60 - 40 70 - 30 80-20
Accu Sensi Speci Accu Sensi Speci Accu Sensi Speci
KNN 85.5 0.812 0.892 85.15 0.792 0.899 87.82 0.847 0.902 SVM 82.77 0.773 0.873 82.07 0.735 0.888 83.61 0.809 0.857 Random Forest 90.76 0.870 0.938 89.64 0.886 0.904 92.44 0.923 0.924 Naïve Bayes 86.97 0.824 0.907 84.03 0.792 0.878 90.76 0.885 0.924 Neural Network 85.5 0.791 0.907 85.15 0.786 0.904 87.39 0.828 0.909 Avg Accuracy 86.3 0.814 0.903 85.20 0.798 0.894 88.40 0.858 0.903
Accu: Accuracy; Sensi: Sensitivity; Speci: Specificity; k-nearest neighbors algorithm (k-NN), Support vector machine (SVM)
However, the further analysis with 6 selected features showed the decrease in average accuracies with that of combined dataset, this could be due to under fitting of the attributes and the performance of the classifier under default conditions. These results are in general agreement with the previous studies where 5 out of 6 selected features in this study were used with different feature selection method [11], thus indicating this features as a minimum number to build a reliable model. It is expected that the further drop in 6 selected features to build a model may not give a better prediction. However, this is in contrast where 3 selected features such as chest pain, ca, Thal showed 95.45% with different feature selection method. On the other hand, it is shown the 3 selected features might be important for accuracy improvement [30].
VI.CONCLUSION
It is known that the accuracy of the model depends on the database, preprocessing, analytical tools and techniques. The present study shows it is important to select minimum and prominent attributes to improve the performance when compared to the use of whole features from the dataset. This study shows that the random forest can be used as a good classification algorithm for the accurate prediction of heart disease with an accuracy of 90–95 %. However, the addition of dataset with the inclusion of other non-modifiable risk factors (genetic factors), and non-modifiable risk factors such as smoking, lack of physical exercise, alcohol consumption could result in better risk prediction of the heart disease. The less variation of accuracy differences between dataset and selected features (8 and 6) indicates these features can be useful for the prediction of
heart disease. However, drop of the 6 selected features may not lead to better model prediction.
REFERENCES
[1] Bhatnagar, P., Wickramasinghe, K., Williams, J., Rayner, M., and Townsend, N. (2015). The Epidemiology of Cardiovascular Disease in the UK 2014. Heart, 101, 1182-1189.
[2] Thiyagaraj, M., and Suseendran, G. (2017). Survey on Heart Disease Prediction System Based on Data Mining Techniques. Indian Journal of Innovations and Developments, 6(1), 1-9.
[3] https://www.heartfoundation.org.au/your-heart/heart-conditions.
[4] Ullah, F., Abdullah A, H., Kaiwartya, O., Kuman, S., and Arshad M, M. (2017). Medium Access Control (MAC) for Wireless Body Area Network (WBAN): Superframe Structure, Multiple Access Technique, Taxonomy, and Challenges. Hum Cent Comput Inf Sci, 7(34), 1-39.
[5] Ullah, F., Abdullah A, H., Kaiwartya, O., Kuman, S., & Lloret, J., and Arshad, M, Md. (2017). EETP-MAC: Energy Efficient Traffic Prioritization for Medium Access Control in Wireless Body Area Networks.
Telecommunication Systems, 1-23.
[6] Ullah, F., Abdullah, A, H., Kaiwartya, O., and Cao, Y. (2017). TraPy-MAC: Traffic Priority Aware Medium Access Control Protocol for Wireless Body Area Network. J Med Syst, 41, 93, 1-18.
46 Protocol in Wireless Body Area Network. Computers,
6, 9, 1-26.
[8] Raghupathi, W., and Raghupathi, V. (2014). Big Data Analytics in Healthcare: Promise and Potential.
Health Information Science and Systems, 2, 3. [9] Palanisamy, V. and Thirunavukarasu, R. (2017).
Implications of Big Data Analytics in Developing Healthcare Frameworks – A Review. Journal of King Saud University–Computer and Information Sciences, 1-11, in press.
[10] Ghasemi, M. and Amyot, D. (2016). Process Mining In Healthcare: A Systematised Literature Review.
Int. J. of Electronic Healthcare, 9(1), 60-88.
[11] Dominic, Vinitha., Deepa, Gupta. and Sangita, Khare. (2015.) An Effective Performance Analysis of Machine Learning Techniques for Cardiovascular Disease. Applied Medical Informatics, 36(1), 23-32. [12] Chandralekha, M. and Shenbagavadivu, N. (2018).
Performance Analysis of Various Machine Learning Techniques to Predict Cardiovascular Disease: An Emprical Study. Appl. Math. Inf. Sci, 12(1), 217-226. [13] UCI Machine Learning Repository:
http://archive.ics.uci.edu/ml/datasets/Heart+Disease , http://archive.ics.uci.edu/ml/datasets/Statlog+%28He art%29.
[14] Hajar, R. (2017). Risk Factors for Coronary Artery Disease: Historical Perspectives. Heart Views, 18, 109-114.
[15] World Heart Federation. (2018). Available at
https://www.world-heart-federation.org/resources/risk-factors/ (accessed 26 June 2018). Google Scholar.
[16] Neesha, Jothi., Nur, Aini., Abdul, Rashid. And Wahidah, Husain. (2015). Data Mining in Healthcare–A Review. Procedia Computer Science, 72, 306-313.
[17] Enriko I. K. A., Muhammad, Suryanegara. and Dadang, Gunawan. (2016). Heart Disease Prediction System using k-Nearest Neighbor Algorithm with Simplified Patient's Health Parameters. Journal of Telecommunication, Electronic and Computer Engineering, 8(12), 59-65.
[18] Jabbar, M. A. (2017). Prediction of Heart Disease Using K-Nearest Neighbor and Particle Swarm Optimization. Biomedical Research, 28(9), 4154-4158
[19] Boshra, Bahrami., Mirsaeid, Hosseini, Shirvani. (2015). Prediction and Diagnosis of Heart Disease by
Data Mining Techniques. Journal of
Multidisciplinary Engineering Science and Technology, 2(2), 164-168.
[20] Janardhanan, P., L, Heena. and Sabika, F. (2015). Effectiveness of Support Vector Machines in Medical Data Mining. Journal of Communications Software and Systems, 11(1), 25-30.
[21] Jabbar, M. A., Deekshatulu, B. L. and Priti, Chandra. (2016). Intelligent Heart Disease Prediction System
Using Random Forest and Evolutionary Approach.
Journal of Network and Innovative Computing, 4, 175-184.
[22] Yeshvendra, K, Singh., Nikhil, Sinha. and Sanjay, K, Singh. (2016). Heart Disease Prediction System Using Random Forest. Advances in Computing and Data Sciences, 613-623.
[23] Lavanya, M., Gomathi, P, M. (2016). Prediction of Heart Disease using Classification Algorithms.
International Journal of Advanced Research in Computer Engineering & Technology, 5(7), 2173-2175.
[24] Sen, S. K. (2017). Predicting and Diagnosing of Heart Disease Using Machine Learning Algorithms.
International Journal of Engineering and Computer Science, 6, 21623-21631.
[25] Shafique, Umair, Majeed, Fiaz., Qaiser, Haseeb and U., l, Mustafa, Irfan. (2015). Data Mining in Healthcare for Heart Diseases. International Journal of Innovation and Applied Studies, 10, 2028-9324. [26] Karayılan, T. and Kılıç, Ö. (2017). Prediction of
heart disease using neural network. International Conference on Computer Science and Engineering (UBMK), Antalya, 719-723. doi: 10.1109/UBMK.2017.8093512.
[27] Rishika, R., A. and Suresh, K. P. (2016). Predictive Big Data Analytics in Healthcare. Second International Conference on Computational Intelligence & Communication Technology, IEEE. [28] Suganya, R., Rajaram, S., Sheik, Abdullah, A. and
Rajendran, J. (2016). A Novel Feature Selection Method for Predicting Heart Disease with Data Mining Techniques. Asian J of Info Tech, 15, 1314-1321.
[29] Jain, D., Singh, V. (2018). Feature Selection and Classification Systems for Chronic Disease Prediction: A Review. Egyptian Informatics J. 1-11, in press. https://doi.org/10.1016/j.eij.2018.03.002. [30] Kakulapati, V., Ankith, Kirti, Vaibhav, Kulkarni. and
Charan, Pandit, Raj. (2017). Predictive Analysis of Heart Disease using Stochastic Gradient Boosting along with Recursive Feature Elimination.
International Journal of Science and Research, 6, 909-912.
[31] Hidayet, Takci. (2018). Improvement of Heart Attack Prediction by the Feature Selection Methods.
Turk J Elec Eng & Comp Sci, 26, 1-10.
[32] Randa, El-Bialy., Mostafa, A, Salamay, Omar, H, Karam and M, Essam, Khalifa. (2015). Feature Analysis of Coronary Artery Heart Disease Data Sets. Procedia Computer Science, 65, 459-468. [33] Patil, P., R. Kinariwala, A., S. (2017). Automated
Diagnosis of Heart Disease using Random Forest Algorithm. International Journal of Advance Research, Ideas and Innovations in Technology,