T
he 1990s economic expansion not only whisked away decades-long stubborn labor market problems such as unemploy-ment and stagnant wage rates, but also hosted the spread of flexible work schedules. By 1997, in the May Current Population Survey (CPS), more than 27 percent of full-time wage and sal-ary workers reported that they had some ability to vary either the starting or ending time of their typical workday, more than double the rate ob-served in 1985.1 Workers tend to regard flexiblework-scheduling practices as a valuable tool for easing the chronic pressures and conflicts im-posed by attempting to execute both work and nonwork responsibilities. The growing value of such daily flexibility to workers may reflect in-creases in labor force participation rates of par-ents, dual-income households, family annual work hours, weekly overtime hours, the premium for additional hours of work, college enrollment
rates, and the aging of the workforce.2
More-over, employers are likely to be turning to flex-ible scheduling as an instrument for recruiting and retaining employees (particularly those fac-ing a labor shortage climate) and for boostfac-ing job satisfaction and labor productivity.3 Yet, the
demand for such flexible work schedules on the part of workers appears still to exceed the
sup-ply provided by employers.4
This article examines the association between workers’ access to flexibility in their work sched-ules, on the one hand, and their various work and job characteristics, on the other. In particu-lar, it focuses on the levels of work hours and the types of jobs that either enhance or
dimin-ish a worker’s chances of attaining a flexible work schedule. While the direction and magnitude of the trend in average work hours has been a source of much controversy, it is clear that paid work hours are growing for many segments of the workforce.5 The trend toward greater flexibility
in hours may be inextricably linked with a polar-ization of work hours that has become evident among workers in which one segment of the workforce may be working longer than standard hours and another segment shorter or nonstand-ard hours or jobs, in part to gain access to the daily flexibility needed to better balance the com-peting demands on their time.
Research analyses of data from previous May CPS supplements have detected a gradual trend toward a nonstandard workday and workweek in the United States. Work is increasingly being spread out, performed on the fringes of the typi-cal workday, extending earlier in the morning or later into the evening.6 Consequently, in 1997,
only 54.4 percent of employed nonagricultural workers over age 18 worked a traditional 5-day workweek on a fixed daytime schedule.7 The
pro-portion working a 35- to 40-hour “standard” work-week was 29.1 percent in 1997, compared with 31.5 percent in 1991 and is considerably lower for men (decreasing from 29.5 percent to 26.5 per-cent over the years cited). In 1991, nonstandard schedules were adopted by workers much more for involuntary (for example, as a job requirement) than for voluntary (for example, to care for one’s family) reasons, by an almost 2-to-1 margin. Work-ing in the evenWork-ing hours is much more common among part-time than full-time workers. Neither
Flexible work schedules:
what are we trading off to get them?
Flexible work schedules are spreading, but workers
sometimes must be willing to increase their hours markedly,
work evening shifts, or switch to part-time status,
self-employment, or certain occupations to get flexibility
in their schedules; this may entail a sacrifice
of leisure time, compensation, or a predictable workweek
Lonnie GoldenLonnie Golden is associate professor of economics, Economics and Business Division, Commonwealth College, the Pennsylva-nia State University, Delaware County, Media, Pennsylvania.
Table 1. Distribution of usual starting and ending times of the workday, full-time wage and salary workers aged 16 years and older, May 1997
Percent of Percent of Interval at work workers workers
beginning ending
12:30 A.M. to 1:29 A.M. ... 0.1 0.6 1:30 A.M. to 2:29 A.M. ... .1 .5 2:30 A.M. to 3:29 A.M. ... .2 .3 3:30 A.M. to 4:29 A.M. ... .5 .2 4:30 A.M. to 5:29 A.M. ... 1.7 .3 5:30 A.M to 6:29 A.M. ... 6.9 .5 5:30 A.M. to 5:59 A.M. ... .8 .1 6:00 A.M. to 6:29 A.M. ... 6.1 .5 6:30 A.M. to 7:29 A.M. ... 21.1 1.7 6:30 A.M. to 6:59 A.M. ... 3.4 .2 7:00 A.M. to 7:29 A.M. ... 17.7 1.4 7:30 A.M. to 8:29 A.M. ... 32.6 1.0 7:30 A.M. to 7:59 A.M. ... 9.0 .4 8:00 A.M. to 8:29 A.M. ... 23.6 .7 8:30 A.M. to 9:29 A.M. ... 13.3 .2 8:30 A.M. to 8:59 A.M. ... 6.1 .1 9:00 A.M. to 9:29 A.M. ... 7.2 .1 9:30 A.M. to 10:29 A.M. ... 2.1 .1 10:30 A.M. to 11:29 A.M. ... .8 .1 11:30 A.M. to 12:29 A.M. ... .5 .2 12:30 P.M. to 1:29 P.M. ... .5 .5 1:30 P.M. to 2:29 P.M. ... 1.0 1.9 2:30 P.M. to 3:29 P.M. ... 2.2 7.8 2:30 P.M. to 2:59 P.M. ... .4 2.0 3:00 P.M. to 3:29 P.M. ... 1.8 5.8 3:30 P.M. to 4:29 P.M. ... 1.5 17.6 3:30 P.M. to 3:59 P.M. ... .5 6.8 4:00 P.M. to 4:29 P.M. ... 1.0 10.7 4:30 P.M. to 5:29 P.M. ... .6 29.5 4:30 P.M. to 4:59 P.M. ... .2 8.6 5:00 P.M. to 5:29 P.M. ... .4 20.9 5:30 P.M. to 6:29 P.M. ... .5 13.1 5:30 P.M. to 5:59 P.M. ... .1 5.1 6:00 P.M. to 6:29 P.M. ... .4 8.0 6:30 P.M. to 7:29 P.M. ... .9 4.6 7:30 P.M. to 8:29 P.M. ... .8 2.1 8:30 P.M. to 9:29 P.M. ... .5 1.1 9:30 P.M. to 10:29 P.M. ... .6 1.2 10:30 P.M. to 11:29 P.M. ... 1.3 2.0 11:30 P.M. to 12:29 P.M. ... .5 1.7 Time varies ... 7.3 9.2 Actual time not available ... 1.9 2.0 ...
Harriet B. Presser and Amy G. Cox nor Daniel Hamermesh finds great differences in nonstandard work hours by occupation or industry, although Presser does point to their greater prevalence in service and technical and support occupations and in per-sonal service industries.8 Consequently, neither attributes
changes in the pattern of timing of work and destandardization of the workday to either occupational or industrial shifts. Nor are demographic factors very consequential, although women being married or having children (depending on their ages) reduces the likelihood of being employed nonstandard hours or days.
Differentiation in work hours and schedules The pattern of workers’ daily work schedules may be observed from their responses to questions regarding their daily
start-ing and endstart-ing times by intervals. Table 1 displays the fre-quency distribution of workers by their daily starting and end-ing times. Not surprisend-ingly, given the growend-ing presence of flexible scheduling, the typical 9-to-5 workday is not as repre-sentative of work-time patterns in the 1990s as it might have been in previous decades. A surprisingly high proportion of workers, 40 percent, is usually still at work past 5 P.M. (although the table does not specify what time each of these workers starts his or her workday). Also, 28 percent of the workforce is at work by 7:30 A.M. (although again, it is unclear what time these individuals typically finish their shifts). Finally, approxi-mately 10 percent of the workforce cannot specify a typical ending time of the workday, mainly because that time is vari-able.
Previous research has yet to take advantage of the
ques-tion in the May CPS Supplement about the flexibility of the
worker’s daily schedule. In this supplement, employed work-ers are asked, “Do you have flexible work hours that allow you to vary or make changes in the time you begin and end work”?9
Thus, the 27 percent who answered in the affirmative in 1997 represent a rather broad estimate. Among these respondents would be any worker whose job or employer permits an infor-mal flexible arrangement, rather than just a forinfor-mal flextime or “gliding” schedule of work over the course of a day. Also, the frequency with which respondents can or do take advantage of this option is unknown. Another question respondents were asked was whether they worked on nontraditional shifts, such as evening, night, rotating, or split shifts. The regular (“ba-sic”) CPS questions include those inquiring about the number of actual and usual hours worked the previous week, as well as those inquiring about a host of demographic and other work characteristics of workers in the sample. Moreover, the CPS asks individuals who usually work part time if they are em-ployed at full-time hours and vice versa. Finally, there are suf-ficient observations to group the respondents into a total of 52 “detailed” Standard Industrial Classification (SIC) industries and 45 “detailed” Standard Occupational Classification (SOC) occupations, which are then collapsed into 23 “major”
indus-tries and 14 “major” occupations.10 Thus, the May 1997
CPS provides a rich source of data that allows economists to exam-ine the interrelationships among the different dimensions of work hours—including their level, timing, and flexibility. It also provides an opportunity to examine another facet of workers’ time at work that has remained unexplored in previous research: the variability of the workweek.
Despite the impressive gains in flexible daily work sched-ules, the analysis performed herein finds that the distribution of flexible schedules among workers is quite uneven accord-ing to demographic and job characteristics of workers, such as gender, race, education level, occupation, employment, and usual work hours. Multivariate regression analysis identifies empirically the various factors associated with the likelihood that a worker reports possessing the ability to vary his or her
daily starting or ending times for work. Certain work and job characteristics are associated with having either significantly greater or significantly lesser access to flexibility in one’s sched-ule. Such characteristics include not only the typical set of personal and human-capital variables, such as gender, race, education, and work-related characteristics, including occu-pation and self-employment, but also the work-time status of workers—that is, their usual number of hours worked and their work shift. Some workers must either work very long work-weeks, part time, evening shifts, or in selected highly skilled occupations suffering a shortage of labor, become self-em-ployed, or further their formal education to obtain a degree beyond high school. This suggests that workers may enhance their chances of gaining flexibility in the timing of their work by altering their jobs or the hours they work.
Moreover, because about 10 percent of the employed work a variable workweek,11 a similar set of characteristics is examined
with respect to the likelihood that workers have a variable num-ber of work hours per week. This analysis not only provides a fuller picture of workers’ daily or weekly work times, but also reveals whether having flexibility in one’s daily schedule tends to either lessen or increase the chances that a worker faces vola-tile hours. A set of demographic and job characteristics that give the worker more access to flexibility in his or her schedule may, in addition, either enhance or reduce the chances that that worker will face a variable, unpredictable duration of the workweek.
Standard economic models of labor supply focus attention almost exclusively on the average duration of work hours, rather than other temporal dimensions, such as flexibility or instabil-ity. Workers work a certain number of hours per week, given their compensation rate and the constraints imposed on them, including that of an often fixed number of hours per week required by their employer. Whatever time the worker spends away from work is assumed to add to his or her well-being (“utility”) by being either self-directed leisure time or time spent producing household goods and services. Yet, in addition to its sheer volume, the daily timing of available time for leisure or household production may have a profound impact on the worker’s well-being. The daily and weekly scheduling of work, as well as the many non-work-related responsibilities a person has (for example, attending classes at school), are often out-side the direct control of the individual. The scheduling of work may frequently overlap or conflict with time slots work-ers need to execute their non-work-related responsibilities and activities, such as caregiving, volunteering, commuting, study-ing, and socializing. For a given stock of work and leisure hours, having some ability to adjust one’s work schedule when one’s non-work-related responsibilities change is a crucial fea-ture of both a job and a workers’ well-being. While Hamermesh usefully distinguishes between hours per day and days worked in a week, and between regular day and evening or night-shift work, economists generally do not focus on the flexibility di-mension.12 Nor is flexibility ever sufficiently distinguished
from variability of hours through time.13 To a worker,
flexibil-ity means an immediate and fully proportional adjustment of
actual hours of work to both anticipated and unanticipated deviations in the worker’s desired number of hours. Indeed, this same notion applies to a worker’s preference for changes in the scheduling of his or her work hours.
Conventional tests of labor supply models have found that a worker’s desire for longer or overtime hours may be diminished by certain factors, such as the worker’s age, or enhanced by other factors, such as the size of the firm employing the worker.14
Broader-based models find that the worker’s desired hours of labor supply may be rising because of workplace and consumer culture. Longer hours are encouraged as a way for workers to earn promotions and improve their relative positioning with re-spect to relevant social reference groups inside the workplace.15
Longer hours also can improve the worker’s positioning toward social groups outside the workplace as a consumer.16 In
addi-tion, longer hours may be perceived as an “insurance policy” or hedge against the risk of future job loss or income loss.17 Further,
laws, regulations, and their changing scope of applicability have a real impact on actual hours worked.18 Finally, by facilitating
greater flexibility in the allocation of work time, technological advances, such as the diffusion of telecommunications technol-ogy and “teleworking” (working in a facility remote from one’s job site through the use of technology), may be lengthening workers’ time spent at work.19
The findings in this article suggest that the rise in flexibility is no coincidence: it may be going hand in hand with the polar-ization of work hours, particularly at the high end, as mani-fested in an increasing proportion of individuals working ex-tended hours (50 or more per week). In other words, some workers are trading off reduced leisure, others reduced com-pensation, in order to attain flexibility in their time spent at
work.20 Longer hours of work may be induced in part by the
greater degree of autonomy many workers are being granted at the workplace in terms of the timing of those hours. Workers wishing to work standard hours are likely to be frustrated by the inflexibility of its daily timing, which, no doubt, explains the continuing excess demand for flexible schedules, despite their recently rising supply.21 Many workers are probably
in-duced to switch their job status to part time, self-employment, or a different occupation in order to attain more flexibility, per-haps at stages of their life cycle when such a benefit is needed most. But they tend to suffer a reduction in earnings and ben-efit coverage as a result.22
Workers’ characteristics
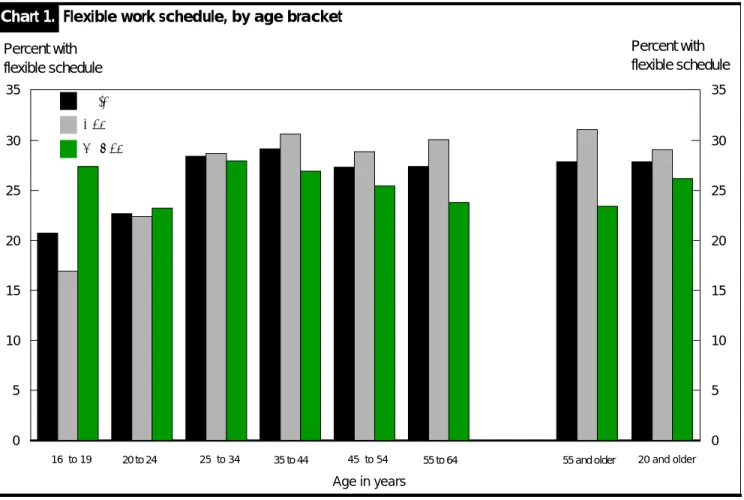
Chart 1 demonstrates the difference in the distribution of flex-ible schedules by gender and age. Women aged 24 and younger actually have a greater incidence of flexible schedules, but the pattern reverses for women aged 25 and older relative to men. Indeed, while the growth of such access was across the board,
the existing inequality in access appears to be no less than it was in 1991. There is, however, surprisingly little difference by demographic group, although the share of men (except for teens) with flexible schedules is actually greater than that of women, who nonetheless exhibit a slight increase in access to daily flexibility in the prime childbearing years.
Table 2 shows that access to flexibility ranges widely across workers’ “detailed” occupations (using the CPS supplement and supplement weights). While only 1 in 9 machine operators has a flexible daily work schedule, as many as 3 of 5 natural or mathematical scientists, lawyers, and sales representatives have such schedules. Professional and sales occupations tend to have much-higher-than-average flexibility of scheduling. The table also shows that having highly variable workweeks is a characteristic of computer equipment operator jobs, a true out-lier in the sample, as well as farm and forestry jobs. Having variable hours is common, too, in transportation and construc-tion jobs, as well as certain sales and service job classifica-tions. Most professional, administrative, supervisory, and sec-retarial jobs tend to have a more stable, predictable workweek. The first column of table 3 shows that there is not quite as much variation in the incidence of flexible schedules among industries as there is among occupations. The proportions by industry are highest in agriculture, but almost half of the workforce in “other professional services,” insurance, and
pri-vate households has a flexible schedule. Many of the service and trade industries and public administration are above the average. The lowest incidences are 19 percent in educational services, 13 percent in local government (not shown in table), and 10 percent to 20 percent in several manufacturing indus-tries. Within the manufacturing sector, however, there is con-siderable variation. Some industries have higher-than-average flexible scheduling: printing and publishing; professional, photo, and watches; petroleum and coal; aircraft; and miscel-laneous manufacturing industries, in each of which about 1 in 3 workers reports having a flexible schedule. (There may be some reliability issues in several detailed production indus-tries—“other metals,” tobacco, petroleum and coal, and leather
goods—for which the total sample in the CPS supplement was
less than 120.) The rate in these latter industries is more than double to more than triple the rate for workers in textile, leather, and primary metals industries (10 percent, 13 percent, and 14 percent, respectively).23 Of all workers with flexible schedules,
18 percent are in the retail trade sector, a percentage that owes mainly to the disproportionate presence of jobs in that sector. Correlation analysis finds that having variable hours is some-what positively correlated with usual part-time status ( = 0.44, whereas = 0 for usual full-time status). In addition, having variable hours is somewhat negatively correlated with the num-ber of usual hours on one’s primary job ( = –0.30), reinforcing
ρ ρ
ρ
16 to 19 25 to 34 45 to 54 20 and older
Age in years 0
5 10 15 20 25 30 35
0 5 10 15 20 25 30 35
Chart 1. Flexible work schedule, by age bracket
Percent with flexible schedule Percent with
flexible schedule
Both Men Women
Table 2. Flexible schedules and variable weekly hours, ranked by occupation, May 1997
Percent
Percent whose
Rank Detailed occupation1 with Rank Detailed occupation1 usual
flexible hours
schedule vary
1 Farm operators ... 77.9 1 Computer equipment operators ... 81.8 2 Natural scientists ... 60.2 2 Farm operators ... 30.0 3 Lawyers and judges ... 58.6 3 Forestry occupations ... 22.3 4 Sales representatives, finance, ... 4 Construction trades ... 19.0 and business services ... 58.1 5 Personal service occupations ... 18.6 5 Mathematical scientists ... 55.9 6 Sales representatives, finance, ...
6 Teachers, college and university ... 54.6 and business services ... 17.1 7 Forestry occupations ... 53.8 7 Farm workers ... 15.2 8 Other professional ... 50.3 8 Motor vehicle operators ... 14.9 9 Sales representatives and commodities, ... 9 Other technicians ... 13.8 except retail ... 49.8 10 Food service occupations ... 11.8 10 Engineers ... 47.9 11 Other transportation ... 11.5 11 Managers ... 47.9 12 Sales workers, retail and personal services ... 10.6 12 Sales supervisors and proprietors ... 45.7 13 Health service occupations ... 9.8 13 Sales-related occupations ... 44.4 14 Freight handlers ... 8.8 14 Other technicians ... 44.0 15 Construction labor ... 8.6 15 Financial records, processing ... 43.5 16 Other handlers and laborers ... 8.2 16 Private household service ... 43.3 17 Other administrative support occupations ... 8.2 17 Health-diagnosing occupations ... 42.6 18 Lawyers and judges ... 8.0 18 Management-related occupations ... 41.2 19 Health technicians ... 7.9 19 Public administration ... 41.0 20 Cleaning and building service occupations ... 7.7 20 Farm workers ... 36.1 21 Health-diagnosing occupations ... 6.8 21 Personal service occupations ... 35.5 22 Machine operators and tenders, ...
22 Engineering and science technicians ... 33.1 except precision ... 5.9 23 Sales, retail and personal services ... 30.7 23 Mechanics and repairers ... 5.8 24 Construction trades ... 30.4 24 Fabricators ... 5.6 25 Administrative support for supervisors ... 29.3 25 Other precision production occupations ... 5.4 26 Secretaries, stenographers, and typists ... 27.1 26 Financial records, processing ... 4.9 27 Motor vehicle operators ... 27.0 27 Sales representatives and commodities, ...
... except retail ... 4.9 28 Mechanics and repairers ... 24.7 28 Mail and message distributing ... 4.6 29 Other administrative support ... 24.3 29 Engineers ... 4.2 30 Health assessment and treating ... 23.3 30 Managers ... 4.2 31 Food service occupations ... 22.1 31 Engineering and science technicians ... 4.2 32 Cleaning and building services ... 21.2 32 Natural scientists ... 4.0 33 Health technicians ... 20.6 33 Sales supervisors and proprietors ... 4.0 34 Other precision production ... 19.9 34 Protective service occupations ... 3.1 35 Construction labor ... 19.5 35 Sales-related occupations ... 2.9 36 Health service occupations ... 19.4 36 Other professional ... 2.8 37 Computer equipment operators ... 19.3 37 Administrative support for supervisors ... 2.6 38 Freight handlers ... 17.8 38 Management-related occupations ... 2.0 39 Protective service occupations ... 16.2 39 Teachers, except college and university ... 1.7 40 Other handlers and laborers ... 15.1 40 Mathematical scientists ... 1.6 41 Mail and message distributing ... 14.4 41 Health assessment and treating ... 1.6 42 Fabricators ... 13.9 42 Secretaries, stenographers, and typists ... .9 43 Other transportation ... 13.6 43 Public administration ... .0 44 Teachers, except college and university ... 12.8 44 Teachers, college and university ... — 45 Machine operators and tenders, ... 45 Private household service ... —
except precision ... 11.1
the notion that workers putting in fewer average hours face more variability in their workweeks. Thus, part-timers appear to be more prone to having variable, unpredictable workweeks, either because they have relatively less control over the length of their workweek or because they have more leeway in their arrival and departure times or in the particular days of the week that they work. Moreover, the last two rows of table 4 suggest that part-time workers whose workweeks vary have a high incidence of flexibility in their daily hours, compared with full-time workers. This in turn suggests that part-time workers
are deployed by employers in part to adjust their labor input levels instantaneously in response to fluctuations in the demand for their products or services. Employers thus are likely to gain more variable workweeks by expanding their part-time job base, which has much less of a “regular” workweek.24 Interestingly,
having a flexible schedule correlates somewhat positively with having variable hours, both generally ( = .24) and a bit more so with workers whose “daily ending times vary” ( = .30). The positive correlation is highest in three particular major occupa-tional classifications: sales, crafts, and farming. This suggests
ρ
ρ
1 Workers employed by the Armed Forces and unemployed persons are
excluded.
that such workers may have the most discretion to either lengthen or truncate the end of their workday.
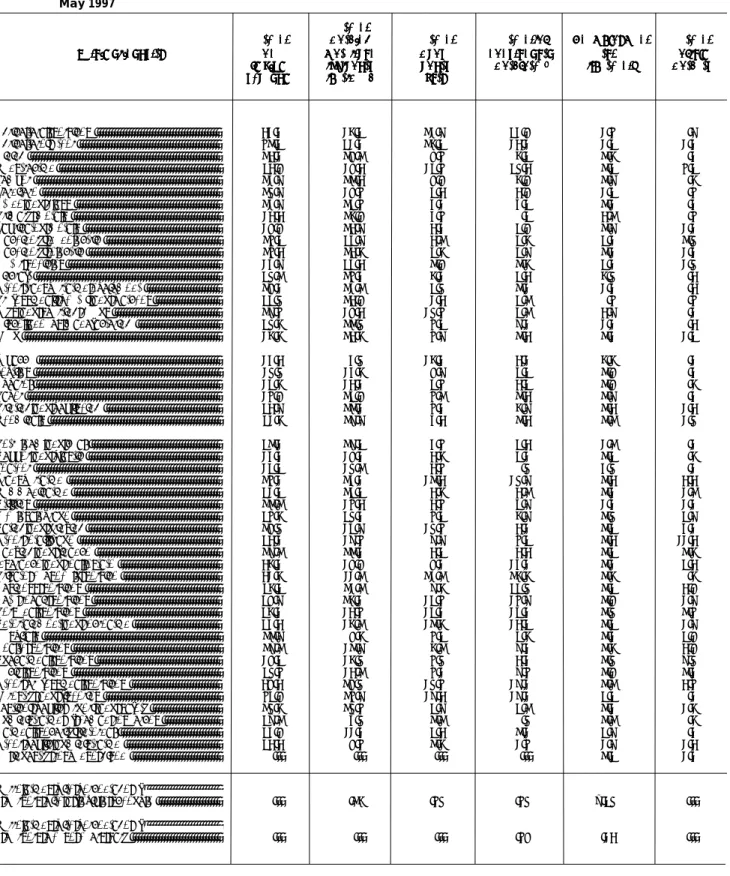
Table 3 shows that, by industry, the incidence of unpredict-able workweeks (hours vary) ranges from less than 2 percent up to the more than 20 percent of the workforce found in agriculture and in private household services. The incidence of unpredictable workweeks also is well above average in construction, transportation, and selected manufacturing (to-bacco) and service (auto repair, entertainment and recreation, and personal services) industries. The next-to-last row of table 3 displays the correlation in the industry data between flex-ibility of schedule, on the one hand, and length of hours, variability of hours, and nonstandard forms of employment, on the other. The somewhat positive correlation of flexibility with long hours (at least 5 hours of usual “overtime”) inti-mates that industries using longer hours per worker do so with more flexible starting and ending times. The significantly positive correlation of flexibility with variable hours suggests that having flexible schedules makes workers’ workweeks less stable or predictable than does having fixed daily schedules. For example, there is also a slight positive correlation between a flexible schedule and variable hours in sales, craft, and farm-ing occupations (+0.28). In addition, there is a significant posi-tive correlation of both flexible schedules and variable work-weeks with the sum total of nonstandard workers used in an industry. This correlation suggests either that employers us-ing nonstandard workers also tend to use nonstandard work scheduling practices for their regular workforce or that the prominent presence of such nonstandard workers (predomi-nantly independent contractors and workers contracting with a temporary agency) in an industry increases the utilization of flexible starting and ending times.25 Whichever of these
alter-natives is true, it suggests that nonstandard workers are de-ployed in part as a complementary method for employers to achieve numerical flexibility of labor, along with variable work-weeks and flexible scheduling.
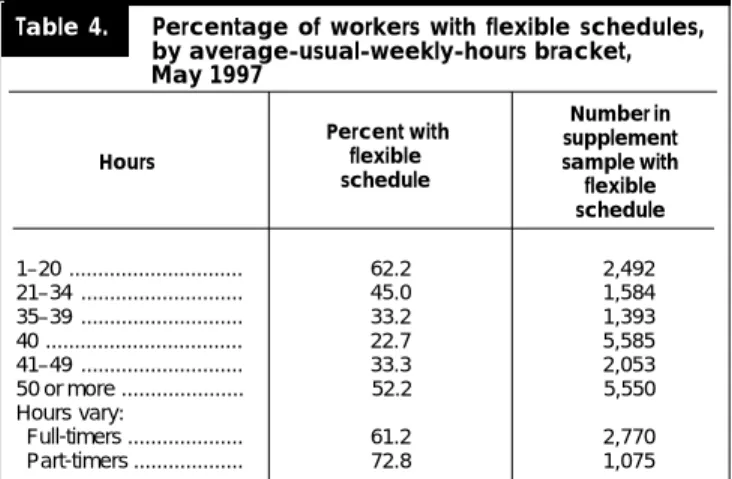
Table 4 reveals that the frequency distribution of flexible scheduling across ranges of usual weekly hours is U shaped. Only 22.7 percent of workers reporting that they usually worked 40 hours per week have flexibility in scheduling. This figure is distinctly lower than the 33 percent of those working 41 to 49 hours per week and the 33 percent of those in the 35-to-39-hours bracket. Also, it is far below the 52 percent with flexible schedules who report averaging 50 or more hours per week, and it falls well short of the 45 percent and 62 percent working 21–34 and 1–20 hours per week, respectively. Notwithstand-ing this latter correlation with fewer hours, workers’ access to flexible scheduling is positively correlated with the usual length of their workweek ( = 0.55). Among major occupations, this correlation is highest in protective service jobs, with manage-rial and administrative jobs coming in second. The correlation is negative for administrative support workers, suggesting that clerical workers must actually reduce the length of their
work-week—for example, to part time—in order to gain greater flex-ibility in the daily timing of their work. The following tabula-tion reinforces this pattern, showing that both mean usual hours and actual hours are longer for full-time workers:
Flexible ... 33.745.82 47.32 Inflexible ... 35.6 42.69 43.93 Difference (flexible
minus inflexible) ... –1.9 3.13 3.39
Correlation coefficient, usual and actual hours =.885
This tabulation suggests, perhaps more persuasively than the evidence provided by table 3, that full-time workers with daily flexibility tend to work 3 or more additional (usual or actual) hours per week than those with fixed schedules.
In contrast, there is surprisingly little correlation between whether a worker has a flexible schedule and the worker’s personal demographic characteristics. For example, by major occupation, the highest correlation coefficient between one’s marital status and flexibility is +0.23, for the managerial posi-tions. Interestingly, the managerial occupations appear to yield slightly less flexibility in schedule for women and for non-whites (with correlation coefficients of about –0.20 and –0.26, respectively). However, in the same occupation, age is some-what positively correlated with flexible schedules, with a correla-tion coefficient of 0.34, the highest among all major occupa-tional categories. Education level, by contrast, has virtually no measurable correlation with flexible schedules, although by occupation, less education is slightly associated with less flexibility in farming and in sales occupations and with more flexibility for those with college degrees in professional occu-pations. Finally, being usually on full-time status actually hin-ders the access of administrative support workers to flexible schedules (–0.51), as it does (although less so) for those in craft, laborer, farming, and machine operator jobs. All this suggests that lesser skilled workers and traditionally disad-vantaged demographic groups have slightly less access to flexibility in their schedules, particularly if they are working full-time jobs.
Table 3 also shows the somewhat inverse relationship between unemployment and flexible scheduling by detailed
industry ( = –0.30). The relationship suggests that labor
shortages tend to give rise to more use of flexible sched-ules, while labor surpluses stifle flextime somewhat. By way of contrast, the unemployment rate has a negligible asso-ciation with both the variability of hours and the propor-tion of nonstandard workers. Thus, part of the increase in the availability of flexible schedules to workers is
attribut-Mean actual hours,
full-time workers only Full-time
workers only All
workers Type of schedule
Mean usual hours
ρ ρ
Table 3. Proportions of workers with flexible, variable, and long work hours, and correlations, by detailed industry, May 1997
Percent Percent Percent Percent
Percent workingworkingworkingworkingworking PercentPercentPercentPercentPercent Percent ofPercent ofPercent ofPercent ofPercent of UnemploymentUnemploymentUnemploymentUnemploymentUnemployment PercentPercentPercentPercentPercent Detailed industry
Detailed industry Detailed industry Detailed industry
Detailed industry ononononon more thanmore thanmore thanmore thanmore than whosewhosewhosewhosewhose nonstandardnonstandardnonstandardnonstandardnonstandard rateraterateraterate of allof allof allof allof all flexible
flexibleflexible
flexibleflexible 45 hours 45 hours 45 hours 45 hours 45 hours hourshourshourshourshours workforceworkforceworkforceworkforceworkforce11111 (percent) (percent) (percent) (percent) (percent) workersworkersworkersworkersworkers
schedule schedule schedule schedule
schedule per week per week per week per week per week varyvaryvaryvaryvary
Agricultural services ... 45.5 17.3 21.8 35.9 1.6 .8
Agriculture, other ... 62.3 31.5 27.3 14.1 1.3 1.5
Mining ... 24.1 29.2 9.6 7.3 2.7 .5
Construction ... 34.9 19.4 13.6 30.4 2.3 6.3
Lumber ... 21.8 22.4 9.9 7.9 2.8 .7
Furniture ... 20.8 19.6 3.4 4.9 1.3 .6
Stone and glass ... 21.8 23.6 5.1 5.3 2.1 .5
Primary metals ... 14.4 27.9 5.6 .3 4.2 .6
Fabricated metals ... 19.9 24.8 4.5 3.9 2.8 1.1
Machinery, nonelectric ... 26.3 33.8 4.2 3.7 3.1 2.0
Machinery, electric ... 26.4 24.7 3.7 3.8 2.1 1.5
Motor vehicles ... 15.8 33.4 2.9 2.7 3.1 1.0
Aircraft ... 30.2 26.5 7.1 3.4 7.0 .4
Other transportation equipment ... 29.1 21.2 3.0 2.1 1.5 .4
Professional, photo, and watches ... 33.0 24.9 1.4 3.2 .6 .6
Toys and sporting goods ... 28.6 19.4 10.6 3.2 4.8 .1
Miscellaneous manufacturing ... 30.7 22.0 6.3 8.1 1.1 .4
Food ... 17.7 24.7 6.8 2.4 2.5 1.3
Tobacco ... 15.4 5.0 17.5 4.1 7.7 .1
Textiles ... 10.0 15.7 9.8 3.3 2.9 .5
Apparel ... 13.7 14.1 3.6 4.3 2.9 .7
Paper ... 16.9 23.9 6.2 2.4 2.8 .5
Printing and publishing ... 34.8 22.1 6.5 7.8 2.4 1.4
Chemicals ... 31.7 28.8 5.4 2.4 2.2 1.0
Petroleum and coal ... 32.1 28.3 5.6 3.4 1.2 .1
Rubber and plastic ... 15.5 19.5 4.7 3.1 2.3 .7
Leather ... 13.3 10.2 4.6 .0 5.0 .1
Transportation ... 26.1 25.1 12.4 10.8 2.4 4.4
Communication ... 31.3 23.3 4.7 4.2 2.5 1.2
Utilities ... 22.2 16.4 4.6 3.8 1.5 1.1
WholesaleTrade ... 36.7 30.5 6.3 7.8 2.0 3.8
Eating and drinking ... 29.0 13.8 10.6 4.1 2.3 5.1
Other retail trade ... 34.1 18.6 8.8 6.3 2.4 11.4
Banking and finance ... 28.2 22.5 4.3 4.4 2.3 2.7
Insurance and real estate ... 47.5 19.9 9.1 15.1 2.1 3.4
Private household service ... 41.7 11.2 21.2 27.7 2.7 .7
Business services ... 37.3 21.2 8.7 33.0 2.3 4.9
Auto repair services ... 39.8 27.1 13.6 16.8 2.9 1.8
Personal services ... 37.5 14.6 13.5 13.5 2.0 2.6
Entertainment and recreation ... 35.4 17.2 12.7 14.3 2.3 1.8
Hospitals ... 22.8 9.7 6.3 3.7 2.5 3.9
Health services ... 28.2 12.8 7.2 8.5 2.7 4.9
Educational services ... 19.3 17.0 6.0 4.5 2.0 8.0
Social services ... 30.6 14.2 6.1 8.6 2.9 2.5
Other professional services ... 49.4 29.0 10.6 18.1 2.2 4.6
Forestry and fisheries ... 63.9 26.8 18.4 18.1 3.3 .1
Justice, public order, and safety ... 20.7 20.6 3.8 3.2 2.5 1.7
Administration of human resources ... 38.2 5.0 2.2 .0 2.2 .7
National security, internal ... 35.9 11.5 3.4 2.1 3.8 .5
Other public administration ... 34.4 9.6 2.7 1.6 1.8 1.4
No industry response given ... ... ... ... ... 2.3 1.5
Correlations with percentage of ...
workers with a flexible schedule ... ... .27 .60 .60 –.30 ...
Correlations with percentage of ...
workers whose hours vary ... ... ... ... .69 .14 ...
1Data from February 1997 Contingent Work Supplement to the CPS.
NOTE: Armed Services employment is omitted. “Other metals” industry
Percent Percent Percent Percent Percent
Table 4. Percentage of workers with flexible schedules, by average-usual-weekly-hours bracket, May 1997
1–20 ... 62.2 2,492 21–34 ... 45.0 1,584 35–39 ... 33.2 1,393 40 ... 22.7 5,585 41–49 ... 33.3 2,053
50 or more ... 52.2 5,550
Hours vary:
Full-timers ... 61.2 2,770
Part-timers ... 72.8 1,075
able to the prolonged cyclical expansion of the 1990s: em-ployers may have been offering such flexibility to recruit
and retain workers as labor markets tightened.26
Likely users of flexible schedules
Which factors explain the cross-sectional variation among in-dividuals in their access to flexibility in their daily schedules? The probability that a given worker in the sample will be on a flexible schedule or will work variable hours is likely to be linked to both the worker’s demographic characteristics and the characteristics of his or her job. To answer the preceding question requires econometric estimations, conducted by merg-ing the CPS Supplement with the regular CPS questions contain-ing information regardcontain-ing the personal and work characteris-tics of the employed. Whether an individual reports that he or she has the flexibility to control either the starting or ending time of the workday may depend on four general sets of fac-tors: (1) personal characteristics, such as gender, race, marital status, and age; (2) human-capital characteristics, such as one’s education level and whether one attended college in conjunc-tion with working; (3) job characteristics, such as the occupa-tion and industry in which the worker is employed, whether the individual is self-employed, and whether he or she is a union member; and (4) one’s work hours status, such as whether one usually works full time or part time, the actual average duration of one’s weekly hours, whether one works on a non-standard time schedule, and whether the length of one’s work-week is variable.27
The likelihood that an individual in the sample has a flexible work schedule (F) is estimated. A virtually identical model is then estimated for the likelihood of having variable hours (V). In each case, the likelihood is determined by a worker’s per-sonal (X) as well as job (Y) characteristics and the vector of estimated coefficients— and , respectively:
The model is estimated with the use of probit analysis. The dependent variable is bivariate, taking on a value of unity if the worker answers that he or she has “flexible work hours that allow you to vary or make changes in the time you begin and end work.” The estimated coefficients represent the marginal probabilities that an individual possessing a given character-istic has access to a flexible daily work schedule.28
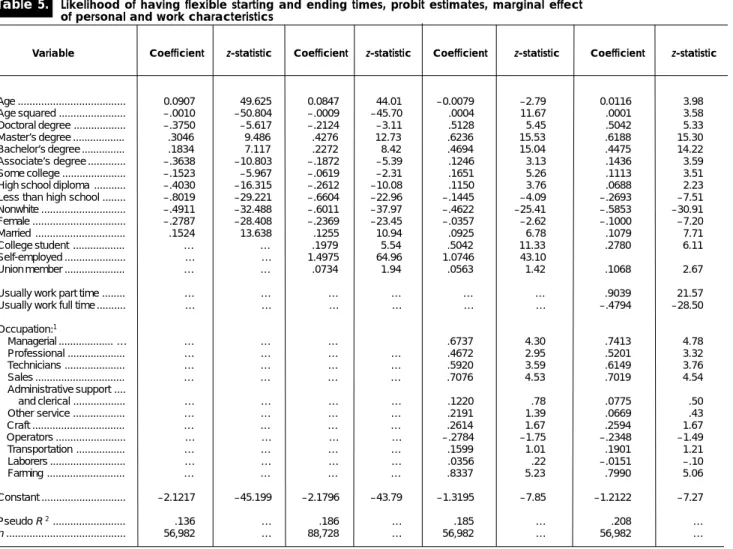
Table 5 displays the regression results of the model, begin-ning with demographic variables only and then adding sets of explanatory variables progressively rightward by column. The inclusion of job status, occupation, and usual full- or part-time status appears to improve the overall explanatory power of the model. Neither the estimates nor the significance of the coeffi-cients proved very sensitive to the model specified, with a few minor exceptions, such as the demographic characteristics.
+ Y X
+ = V
F i , i α i β + iδ ε
Number in supplement sample with flexible schedule Percent with
flexible schedule Hours
Table 6 contains the results when “usual full-time status” is broken out into five different work-hour classifications (with at least one omitted, to serve as a reference group). Table 7 presents the results when workers’ detailed occupational and industry classifications are controlled for.
The clear pattern that emerges from the empirical results is that, while many personal characteristics either significantly improve or diminish the likelihood of having flexibility in one’s work schedule, access to such flexibility is significantly af-fected by the workers’ job status and work-hour classification. On the personal side, nonwhites are about 50 percent to 60 percent less likely than whites to be on a flexible work sched-ule. Women also are significantly less likely than men to have such flexibility, by roughly the same percentage. However, this lack of access appears to be attributable in large part to the occupational segregation of women: their reduced likelihood of flexibility shrinks down to less than a 10-percent greater disadvantage relative to men when major occupational con-trols are included in the analysis and to no more than a 4-percent disadvantage when detailed occupational controls are included. Indeed, the relatively lower access of women to daily flexibility is not significantly different from zero if their detailed industry, as well as occupation, is taken into account.
Access to flexible schedules is gained with age, although it tapers off at older ages. Controlling for the occupational distri-bution, as well as some other job factors, however, indicates an exponential effect of age. This effect suggests that experi-ence, seniority, or job tenure helps workers gain more access to control over the timing of their workday.
Married workers are significantly more likely than unmar-ried workers to have a flexible work schedule, although the magnitude of significance is small—on the order of about 8 percent. This greater likelihood may reflect either the fact that married workers are more likely to be parents and are offered, perhaps informally, a greater degree of flexibility by employers compared with unmarried workers or the fact that married work-ers are more apt to utilize formal flextime systems that employ-ers have instituted in the workplace.
.
Table 5. Likelihood of having flexible starting and ending times, probit estimates, marginal effect of personal and work characteristics
Variable Coefficient z-statistic Coefficient z-statistic Coefficient z-statistic Coefficient z-statistic
Age ... 0.0907 49.625 0.0847 44.01 –0.0079 –2.79 0.0116 3.98
Age squared ... –.0010 –50.804 –.0009 –45.70 .0004 11.67 .0001 3.58
Doctoral degree ... –.3750 –5.617 –.2124 –3.11 .5128 5.45 .5042 5.33
Master’s degree ... .3046 9.486 .4276 12.73 .6236 15.53 .6188 15.30
Bachelor’s degree ... .1834 7.117 .2272 8.42 .4694 15.04 .4475 14.22
Associate’s degree ... –.3638 –10.803 –.1872 –5.39 .1246 3.13 .1436 3.59
Some college ... –.1523 –5.967 –.0619 –2.31 .1651 5.26 .1113 3.51
High school diploma ... –.4030 –16.315 –.2612 –10.08 .1150 3.76 .0688 2.23
Less than high school ... –.8019 –29.221 –.6604 –22.96 –.1445 –4.09 –.2693 –7.51
Nonwhite ... –.4911 –32.488 –.6011 –37.97 –.4622 –25.41 –.5853 –30.91
Female ... –.2787 –28.408 –.2369 –23.45 –.0357 –2.62 –.1000 –7.20
Married ... .1524 13.638 .1255 10.94 .0925 6.78 .1079 7.71
College student ... … … .1979 5.54 .5042 11.33 .2780 6.11
Self-employed ... … … 1.4975 64.96 1.0746 43.10
Union member ... … … .0734 1.94 .0563 1.42 .1068 2.67
Usually work part time ... … … … .9039 21.57
Usually work full time ... … … … –.4794 –28.50
Occupation:1...
Managerial ... … … … … .6737 4.30 .7413 4.78
Professional ... … … … … .4672 2.95 .5201 3.32
Technicians ... … … … … .5920 3.59 .6149 3.76
Sales ... … … … … .7076 4.53 .7019 4.54
Administrative support ....
and clerical ... … … … … .1220 .78 .0775 .50
Other service ... … … … … .2191 1.39 .0669 .43
Craft ... … … … … .2614 1.67 .2594 1.67
Operators ... … … … … –.2784 –1.75 –.2348 –1.49
Transportation ... … … … … .1599 1.01 .1901 1.21
Laborers ... … … … … .0356 .22 –.0151 –.10
Farming ... … … … … .8337 5.23 .7990 5.06
Constant ... –2.1217 –45.199 –2.1796 –43.79 –1.3195 –7.85 –1.2122 –7.27
Pseudo R 2... .136 … .186 … .185 … .208 …
n ... 56,982 … 88,728 … 56,982 … 56,982 …
Finally, workers’ levels of education influence their access to flexible schedules, although not quite in a linear fashion.29
Workers who have not finished high school are highly likely to be excluded from flexibility in their schedules. Interestingly, so are those with doctoral degrees, although this is entirely at-tributable to their occupational distribution. Also, a worker who is simultaneously attending college is significantly more likely to be on a flexible schedule, again indicating either that employers are more accommodating to these individuals or that those workers are more apt to request or take advantage of flextime. The results suggest that, given one’s occupation, workers enhance their access to flexibility either by enrolling in or completing college, especially when they earn an ad-vanced degree.
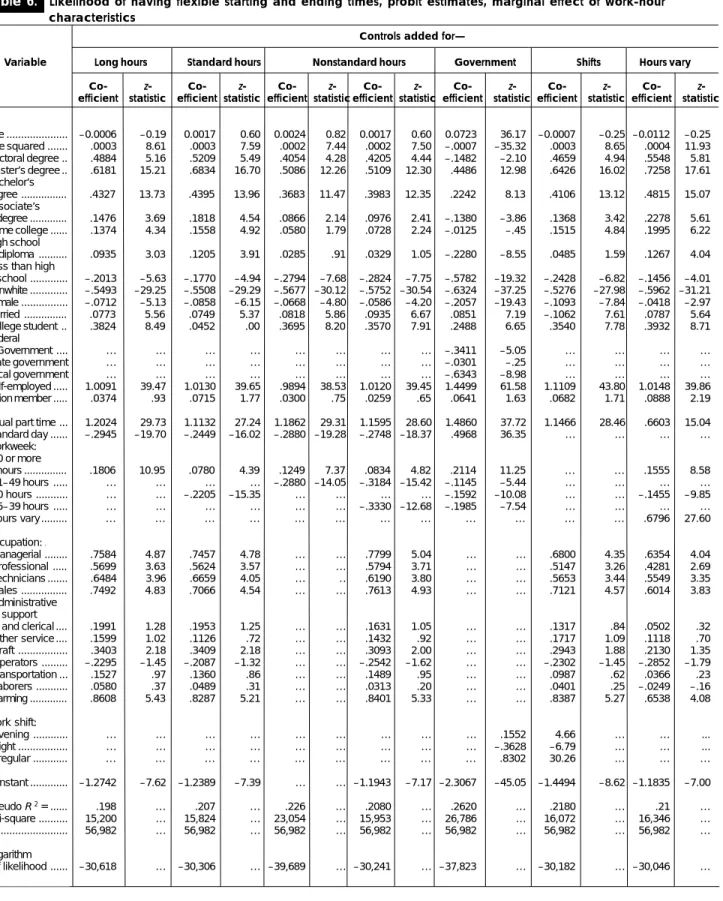
Perhaps the most fascinating results are the differences by workers’ usual hours. Tables 5 and 6 show that being a part-time worker more than doubles a person’s chances of having flexible starting and ending times for work. However, table 7 reveals that about half of this increased likelihood is traceable
to the detailed occupation or industry in which the worker is employed. At the other end of the spectrum, workers who report very long hours—more than 50 hours per week—in-crease their likelihood of having a greater influence over the starting and ending times of their work, by 8 percent to 21 percent.30 In contrast, working exactly 40 hours per week is
associated with a less flexible schedule, on the order of about 15 to 22 percent. Somewhat surprisingly, the flexibility payoff to working longer hours is not delivered to those working in the range of 41 to 49 hours per week (or to those working 35 to 39 hours per week). Thus, only workers who average at least 10 hours a day in a traditional 5-day workweek, or workers who put in at least 1 extra day per week, have a greater likelihood of being able to alter either the starting or ending time of their typical workday.
Reporting that the usual number of hours vary too widely from week to week to be specified precisely is strongly posi-tively associated with having more flexibility in one’s sched-ule, significantly heightening the likelihood of having a
1 Protective service is dropped due to multicollinearity. Private household
service also is omitted.
NOTES: Regression results begin with demographic variables and add
sets of explanatory variables progressively rightward by column. Dependent variable = 1 if worker reports being able to vary starting or ending times of work.
ible starting or ending time by 0.68 to 0.78 basis point. What is more, the association is even stronger for part-time workers whose hours usually vary. The suggestion is that workers with an enhanced ability to alter their daily starting or ending time for work are trading off stability in their usual weekly number of hours. In this regard, working on a “standard” day schedule reduces the likelihood that a worker has a flexible work schedule by 0.16 to 0.50 basis point. (Working on a gen-erally nonstandard schedule increases the probability, by an even greater 0.75 point.) Working on nonstandard shift time, however, does not guarantee having more flexible starting and ending times: Those working an evening shift do improve their access to flexibility in their schedules, but those working the night shift actually have a reduced likelihood of flexible times. Those who report working on an irregular schedule arranged by their employer, presumably some (nonrotating) mix of regu-lar day, evening, or night shifts, do gain some flexibility by working such irregular shifts.
For many workers, their occupation may influence their ac-cess to flexibility. Among major occupational classifications, when individual characteristics of workers are controlled for in the analysis, managerial, professional, technical, sales, and farming jobs provide greater access to flexibility in the sched-ule. Service (other than household or protective) and craft jobs may weakly enhance workers’ chances of attaining flex-ibility.31 Operators appear to get reduced access to flexibility,
although not necessarily significantly, because the reduction is not robust to all model specifications.
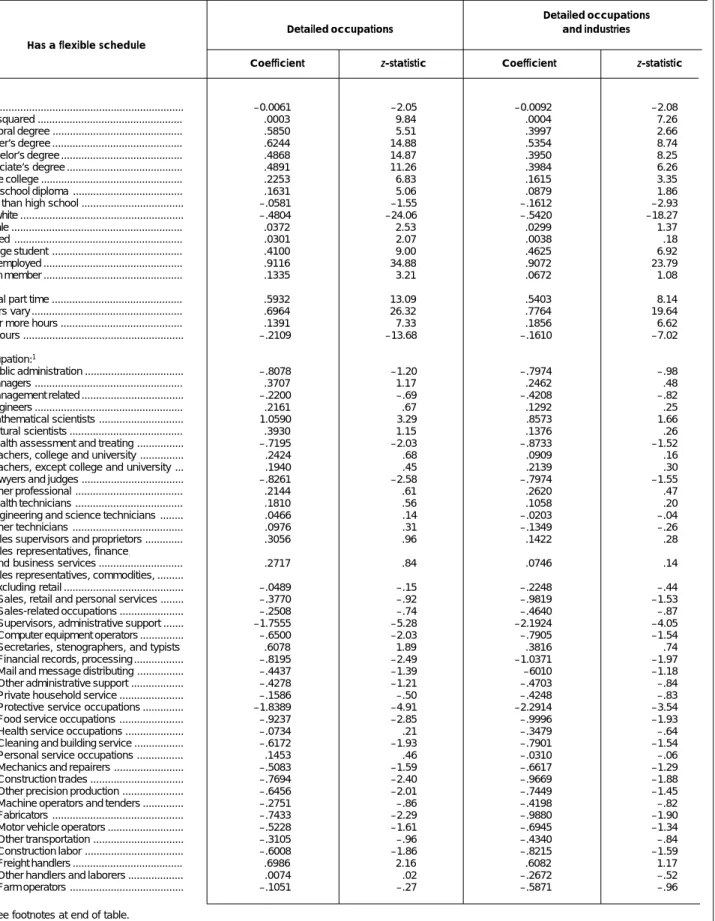
Among detailed occupations, a worker’s probability of hav-ing a flexible daily schedule is increased significantly if the worker is employed in a few particular occupations: mathemat-ics and computer science professional; freight, stock, and ma-terial handler; and farm worker. The likelihood of having access to flexibility rises somewhat for those in secretarial po-sitions. In contrast, as many as 13 detailed occupational clas-sifications, including health assessment and treating occupa-tions, lawyers and judges, supervisors of clericals, financial records and processing occupations, protective service, food service, precision production, construction trades, and fabri-cators, assemblers, inspectors, and samplers, yield a reduced likelihood of having flexibility, all other things being equal. To a lesser degree, computer equipment operator, cleaning and building services, and construction laborer occupations also may offer less flexibility in the work schedule.32
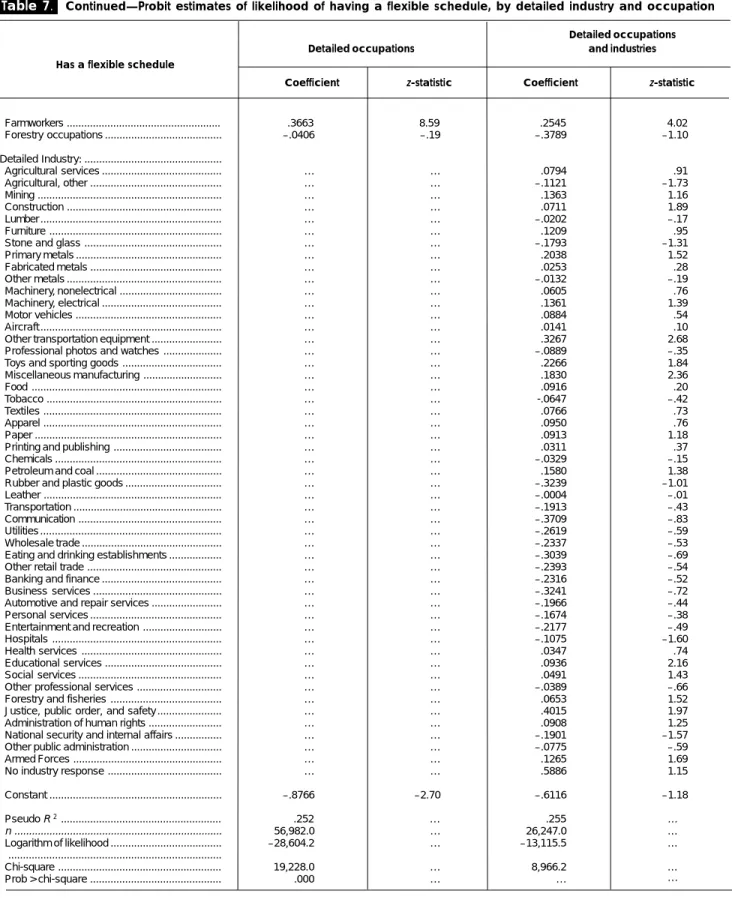
A few of the detailed industry classifications shown in table 7 significantly alter the likelihood of attaining flexibility when the worker’s occupation and other characteristics are taken into account. (No one major industry classification, however, significantly alters the likelihood of having flexibility.) Only six of the detailed industries enhance the worker’s chances of attaining a flexible schedule—in order of size of the industry’s positive effect, justice and public safety; manufacturing of transportation equipment; manufacturing other than motor
vehicles, aircraft, and miscellaneous industries; educational services; construction (perhaps weakly); and toys and sport-ing goods manufactursport-ing (again, perhaps weakly). No nonag-ricultural industries of note significantly reduce a worker’s ac-cess to flexibility, taking into account the worker’s occupation and other characteristics.
While the industry in which one’s job is located may have limited bearing on the likelihood of having access to flexible scheduling, controlling for industry in the analysis does af-fect the likelihood of some occupations being associated with greater flexibility. For example, the greater flexibility enjoyed by both mathematical and computer scientists (and perhaps weakly by those in secretarial positions) is attributable at least in part to the industry distribution of these jobs. In addition, the reduced likelihood of access to a flexible schedule en-dured by workers in health assessment and treating occupa-tions, lawyers and judges, computer equipment operators, and perhaps food service employees is attributable to their concentration in certain industries in which work schedules tend to be inflexible.
Working in either Federal or local branches of government reduces the likelihood of having a flexible schedule. This is surprising, given the efforts of the Federal Government over the last two decades to establish more flextime work schedules for Federal employees, in part as a model to be exported to the private sector. In addition, it is unexpected, given the ability of State and local governments to substitute compensatory time in lieu of pay for overtime hours if such an arrangement is formally agreed upon by individuals or collective bargaining agents. Apparently, such a policy does not translate into more flexibility for workers in their daily working hours.33
Being self-employed rather than a payroll employee more than doubles the likelihood that a worker has the ability to vary his or her starting and ending times of work. Indeed, having a flexible schedule is clearly a major reason to become self-employed, de-spite the fact that the average number of hours the self-employed spend working is relatively longer than that of payroll employ-ees.34 Similarly, being a union member tends to improve a worker’s
access to flexibility, although the effect is neither particularly strong nor always significant. (For example, the positive effect dissipates when the worker’s industry is also taken into account.) The positive effect, however, is counterintuitive, running counter to a conventional assumption and a past empirical finding that union membership is associated with less individual control over one’s work time.35
Finally, being paid on an hourly basis appears to diminish a worker’s access to a flexible schedule, at least among the subsample of the CPS that is asked a question pertaining to that category. However, being paid on a nonhourly basis does not appear to be significantly related to the likelihood of having flexiblity, although observations on the category are available only for the outgoing rotation (quarter sample) for May 1997. In sum, more than 1 in 4 employed individuals now have
Table 6. Likelihood of having flexible starting and ending times, probit estimates, marginal effect of work-hour characteristics
Controls added for—
Variable Long hours Standard hours Nonstandard hours Government Shifts Hours vary Co- z- Co- z- Co- z- Co- z- Co- z- Co- z- Co- z -efficient statistic efficient statistic efficient statistic efficient statistic efficient statistic efficient statistic efficient statistic
Age ... –0.0006 –0.19 0.0017 0.60 0.0024 0.82 0.0017 0.60 0.0723 36.17 –0.0007 –0.25 –0.0112 –0.25
Age squared ... .0003 8.61 .0003 7.59 .0002 7.44 .0002 7.50 –.0007 –35.32 .0003 8.65 .0004 11.93
Doctoral degree .. .4884 5.16 .5209 5.49 .4054 4.28 .4205 4.44 –.1482 –2.10 .4659 4.94 .5548 5.81
Master’s degree .. .6181 15.21 .6834 16.70 .5086 12.26 .5109 12.30 .4486 12.98 .6426 16.02 .7258 17.61 Bachelor’s
degree ... .4327 13.73 .4395 13.96 .3683 11.47 .3983 12.35 .2242 8.13 .4106 13.12 .4815 15.07 Associate’s
degree ... .1476 3.69 .1818 4.54 .0866 2.14 .0976 2.41 –.1380 –3.86 .1368 3.42 .2278 5.61
Some college ... .1374 4.34 .1558 4.92 .0580 1.79 .0728 2.24 –.0125 –.45 .1515 4.84 .1995 6.22
High school
diploma ... .0935 3.03 .1205 3.91 .0285 .91 .0329 1.05 –.2280 –8.55 .0485 1.59 .1267 4.04
Less than high
school ... –.2013 –5.63 –.1770 –4.94 –.2794 –7.68 –.2824 –7.75 –.5782 –19.32 –.2428 –6.82 –.1456 –4.01 Nonwhite ... –.5493 –29.25 –.5508 –29.29 –.5677 –30.12 –.5752 –30.54 –.6324 –37.25 –.5276 –27.98 –.5962 –31.21 Female ... –.0712 –5.13 –.0858 –6.15 –.0668 –4.80 –.0586 –4.20 –.2057 –19.43 –.1093 –7.84 –.0418 –2.97 Married ... .0773 5.56 .0749 5.37 .0818 5.86 .0935 6.67 .0851 7.19 –.1062 7.61 .0787 5.64
College student .. .3824 8.49 .0452 .00 .3695 8.20 .3570 7.91 .2488 6.65 .3540 7.78 .3932 8.71
Federal
Government .... ... ... ... ... ... ... ... ... –.3411 –5.05 ... ... ... ...
State government ... ... ... ... ... ... ... ... –.0301 –.25 ... ... ... ...
Local government ... ... ... ... ... ... ... ... –.6343 –8.98 ... ... ... ...
Self-employed ... 1.0091 39.47 1.0130 39.65 .9894 38.53 1.0120 39.45 1.4499 61.58 1.1109 43.80 1.0148 39.86
Union member ... .0374 .93 .0715 1.77 .0300 .75 .0259 .65 .0641 1.63 .0682 1.71 .0888 2.19
...
Usual part time ... 1.2024 29.73 1.1132 27.24 1.1862 29.31 1.1595 28.60 1.4860 37.72 1.1466 28.46 .6603 15.04 Standard day ... –.2945 –19.70 –.2449 –16.02 –.2880 –19.28 –.2748 –18.37 .4968 36.35 ... ... ... ... Workweek: ...
50 or more
hours ... .1806 10.95 .0780 4.39 .1249 7.37 .0834 4.82 .2114 11.25 ... ... .1555 8.58
41–49 hours ... ... ... ... ... –.2880 –14.05 –.3184 –15.42 –.1145 –5.44 ... ... ... ...
40 hours ... ... ... –.2205 –15.35 ... ... ... ... –.1592 –10.08 ... ... –.1455 –9.85
35–39 hours ... ... ... ... ... ... ... –.3330 –12.68 –.1985 –7.54 ... ... ... ...
Hours vary ... ... ... ... ... ... ... ... ... ... ... ... ... .6796 27.60
... Occupation: ...
Managerial ... .7584 4.87 .7457 4.78 ... ... .7799 5.04 ... ... .6800 4.35 .6354 4.04
Professional ... .5699 3.63 .5624 3.57 ... ... .5794 3.71 ... ... .5147 3.26 .4281 2.69
Technicians ... .6484 3.96 .6659 4.05 ... .. .6190 3.80 ... ... .5653 3.44 .5549 3.35
Sales ... .7492 4.83 .7066 4.54 ... ... .7613 4.93 ... ... .7121 4.57 .6014 3.83
Administrative support
and clerical .... .1991 1.28 .1953 1.25 ... ... .1631 1.05 ... ... .1317 .84 .0502 .32
Other service .... .1599 1.02 .1126 .72 ... ... .1432 .92 ... ... .1717 1.09 .1118 .70
Craft ... .3403 2.18 .3409 2.18 ... ... .3093 2.00 ... ... .2943 1.88 .2130 1.35
Operators ... –.2295 –1.45 –.2087 –1.32 ... ... –.2542 –1.62 ... ... –.2302 –1.45 –.2852 –1.79
Transportation ... .1527 .97 .1360 .86 ... ... .1489 .95 ... ... .0987 .62 .0366 .23
Laborers ... .0580 .37 .0489 .31 ... ... .0313 .20 ... ... .0401 .25 –.0249 –.16
Farming ... .8608 5.43 .8287 5.21 ... ... .8401 5.33 ... ... .8387 5.27 .6538 4.08
... Work shift: ...
Evening ... ... ... ... ... ... ... ... ... ... .1552 4.66 ... ... ...
Night ... ... ... ... ... ... ... ... ... ... –.3628 –6.79 ... ... ...
Irregular ... ... ... ... ... ... ... ... ... ... .8302 30.26 ... ... ...
...
Constant ... –1.2742 –7.62 –1.2389 –7.39 ... ... –1.1943 –7.17 –2.3067 –45.05 –1.4494 –8.62 –1.1835 –7.00
Pseudo R 2 = ... .198 ... .207 ... .226 ... .2080 ... .2620 ... .2180 ... .21 ...
Chi-square ... 15,200 ... 15,824 ... 23,054 ... 15,953 ... 26,786 ... 16,072 ... 16,346 ...
n ... 56,982 ... 56,982 ... 56,982 ... 56,982 ... 56,982 ... 56,982 ... 56,982 ... ...
Logarithm
of likelihood ... –30,618 ... –30,306 ... –39,689 ... –30,241 ... –37,823 ... –30,182 ... –30,046 ... ...
Table 7. Probit estimates of likelihood of having a flexible schedule, by detailed industry and occupation
Detailed occupations Detailed occupations and industries Has a flexible schedule
Coefficient z-statistic Coefficient z-statistic
Age ... –0.0061 –2.05 –0.0092 –2.08
Age squared ... .0003 9.84 .0004 7.26
Doctoral degree ... .5850 5.51 .3997 2.66
Master’s degree ... .6244 14.88 .5354 8.74
Bachelor’s degree ... .4868 14.87 .3950 8.25
Associate’s degree ... .4891 11.26 .3984 6.26
Some college ... .2253 6.83 .1615 3.35
High school diploma ... .1631 5.06 .0879 1.86
Less than high school ... –.0581 –1.55 –.1612 –2.93
Nonwhite ... –.4804 –24.06 –.5420 –18.27
Female ... .0372 2.53 .0299 1.37
Married ... .0301 2.07 .0038 .18
College student ... .4100 9.00 .4625 6.92
Self-employed ... .9116 34.88 .9072 23.79
Union member ... .1335 3.21 .0672 1.08
Usual part time ... .5932 13.09 .5403 8.14
Hours vary ... .6964 26.32 .7764 19.64
50 or more hours ... .1391 7.33 .1856 6.62
40 hours ... –.2109 –13.68 –.1610 –7.02
Occupation:1
...
Public administration ... –.8078 –1.20 –.7974 –.98
Managers ... .3707 1.17 .2462 .48
Management related ... –.2200 –.69 –.4208 –.82
Engineers ... .2161 .67 .1292 .25
Mathematical scientists ... 1.0590 3.29 .8573 1.66
Natural scientists ... .3930 1.15 .1376 .26
Health assessment and treating ... –.7195 –2.03 –.8733 –1.52
Teachers, college and university ... .2424 .68 .0909 .16
Teachers, except college and university ... .1940 .45 .2139 .30
Lawyers and judges ... –.8261 –2.58 –.7974 –1.55
Other professional ... .2144 .61 .2620 .47
Health technicians ... .1810 .56 .1058 .20
Engineering and science technicians ... .0466 .14 –.0203 –.04
Other technicians ... .0976 .31 –.1349 –.26
Sales supervisors and proprietors ... .3056 .96 .1422 .28
Sales representatives, finance, ...
and business services ... .2717 .84 .0746 .14
Sales representatives, commodities, ...
excluding retail ... –.0489 –.15 –.2248 –.44
Sales, retail and personal services ... –.3770 –.92 –.9819 –1.53
Sales-related occupations ... –.2508 –.74 –.4640 –.87
Supervisors, administrative support ... –1.7555 –5.28 –2.1924 –4.05
Computer equipment operators ... –.6500 –2.03 –.7905 –1.54
Secretaries, stenographers, and typists .6078 1.89 .3816 .74
Financial records, processing ... –.8195 –2.49 –1.0371 –1.97
Mail and message distributing ... –.4437 –1.39 –6010 –1.18
Other administrative support ... –.4278 –1.21 –.4703 –.84
Private household service ... –.1586 –.50 –.4248 –.83
Protective service occupations ... –1.8389 –4.91 –2.2914 –3.54
Food service occupations ... –.9237 –2.85 –.9996 –1.93
Health service occupations ... –.0734 .21 –.3479 –.64
Cleaning and building service ... –.6172 –1.93 –.7901 –1.54
Personal service occupations ... .1453 .46 –.0310 –.06
Mechanics and repairers ... –.5083 –1.59 –.6617 –1.29
Construction trades ... –.7694 –2.40 –.9669 –1.88
Other precision production ... –.6456 –2.01 –.7449 –1.45
Machine operators and tenders ... –.2751 –.86 –.4198 –.82
Fabricators ... –.7433 –2.29 –.9880 –1.90
Motor vehicle operators ... –.5228 –1.61 –.6945 –1.34
Other transportation ... –.3105 –.96 –.4340 –.84
Construction labor ... –.6008 –1.86 –.8215 –1.59
Freight handlers ... .6986 2.16 .6082 1.17
Other handlers and laborers ... .0074 .02 –.2672 –.52
Farm operators ... –.1051 –.27 –.5871 –.96
Farmworkers ... .3663 8.59 .2545 4.02
Forestry occupations ... –.0406 –.19 –.3789 –1.10
Detailed Industry: ...
Agricultural services ... … … .0794 .91
Agricultural, other ... … … –.1121 –1.73
Mining ... … … .1363 1.16
Construction ... … … .0711 1.89
Lumber ... … … –.0202 –.17
Furniture ... … … .1209 .95
Stone and glass ... … … –.1793 –1.31
Primary metals ... … … .2038 1.52
Fabricated metals ... … … .0253 .28
Other metals ... … … –.0132 –.19
Machinery, nonelectrical ... … … .0605 .76
Machinery, electrical ... … … .1361 1.39
Motor vehicles ... … … .0884 .54
Aircraft ... … … .0141 .10
Other transportation equipment ... … … .3267 2.68
Professional photos and watches ... … … –.0889 –.35
Toys and sporting goods ... … … .2266 1.84
Miscellaneous manufacturing ... … … .1830 2.36
Food ... … … .0916 .20
Tobacco ... … … -.0647 –.42
Textiles ... … … .0766 .73
Apparel ... … … .0950 .76
Paper ... … … .0913 1.18
Printing and publishing ... … … .0311 .37
Chemicals ... … … –.0329 –.15
Petroleum and coal ... … … .1580 1.38
Rubber and plastic goods ... … … –.3239 –1.01
Leather ... … … –.0004 –.01
Transportation ... … … –.1913 –.43
Communication ... … … –.3709 –.83
Utilities ... … … –.2619 –.59
Wholesale trade ... … … –.2337 –.53
Eating and drinking establishments ... … … –.3039 –.69
Other retail trade ... … … –.2393 –.54
Banking and finance ... … … –.2316 –.52
Business services ... … … –.3241 –.72
Automotive and repair services ... … … –.1966 –.44
Personal services ... … … –.1674 –.38
Entertainment and recreation ... … … –.2177 –.49
Hospitals ... … … –.1075 –1.60
Health services ... … … .0347 .74
Educational services ... … … .0936 2.16
Social services ... … … .0491 1.43
Other professional services ... … … –.0389 –.66
Forestry and fisheries ... … … .0653 1.52
Justice, public order, and safety ... … … .4015 1.97
Administration of human rights ... … … .0908 1.25
National security and internal affairs ... … … –.1901 –1.57
Other public administration ... … … –.0775 –.59
Armed Forces ... … … .1265 1.69
No industry response ... … … .5886 1.15
Constant ... –.8766 –2.70 –.6116 –1.18
Pseudo R 2... .252 ... .255 ...
n ... 56,982.0 ... 26,247.0 ...
Logarithm of likelihood ... –28,604.2 ... –13,115.5 ...
...
Chi-square ... 19,228.0 ... 8,966.2 ...
Prob > chi-square ... .000 ... ...
1 Health-diagnosing occupations, Armed Forces personnel, and the unemployed are dropped.
Table 7. Continued—Probit estimates of likelihood of having a flexible schedule, by detailed industry and occupation
Detailed occupations Detailed occupations and industries Has a flexible schedule
Coefficient z-statistic Coefficient z-statistic
some flexibility in the daily timing of their work schedule. Still, there are disparities in access to such flexibility across workers according to their demographic, job, and work-hour character-istics. The analysis suggests that workers who wish to gain greater access to a flexible schedule sometimes must be willing to work very long workweeks (50 or more hours), work regu-larly nondaytime hours such as evening shifts, work irregular shifts, work an unpredictable number of hours each week, or make a transition to either part-time work or self-employment. Otherwise, workers may have to make longer term and presum-ably more costly mobility decisions, including pursuing fur-ther education credentials or switching to a different occupa-tion or industry that tends not to utilize a standard 40-hour workweek as a norm. Thus, workers with a strong need or preference for daily flexibility in their work schedule may have to forgo leisure time, endure long-term reductions in income, or pay the costs associated with searching for a new job.
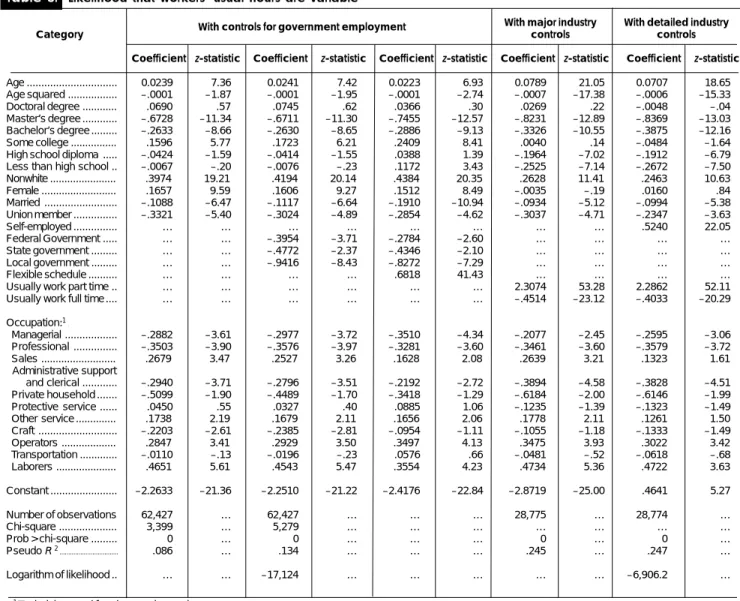
Likelihood of volatile hours
Table 8 shows that having variable hours, as evidenced by the respondent’s reporting that his or her usual number of hours is impossible to specify, is a condition strongly influenced by several work characteristics as well as demographic factors. Being nonwhite heightens the marginal probability of having volatile hours, as does being female. However, almost half of the higher probability of having unstable workweeks for non-whites, as well as all of the higher probability for women, is attributable to the distribution of the two groups’ employment across industries, in effect reflecting industry segregation in employment. Married workers have a 9-percent to 19-percent lower likelihood of facing variable workweeks.
Being a government employee or a union member is associ-ated with having a more predictable workweek length. Some of the workweek-stabilizing effect of unionism is traceable either to the detailed industry distribution of union jobs or to em-ployment in government. Public-sector emem-ployment at all three levels—Federal, State, and especially local government—re-duces the probability of having variable work hours. Self-em-ployment increases the chances of having variable hours, due to the nature of the job, not the detailed industry in which the occupation is located.
Perhaps the most revealing finding of the analysis is that having variable hours is strongly positively associated with usually working part time, more than doubling the likelihood of having hours that vary weekly. Part-timers tend to face much more unpredictability in their workweeks than full-timers are confronted with. Indeed, usually working full time reduces the chances of having an unpredictable workweek by more than 40 percent, an assiciation which suggests that part-time work-ers specifically may be used by employwork-ers to absorb fluctua-tions in workload via changes in their number of hours or days at work. This use of part-time workers serves to buffer full-time
employees’ hours of work. Furthermore, not surprisingly, given the association revealed in the previous section’s findings, having the ability to vary one’s daily schedule leads to a (68-percent) greater likelihood of having a variable workweek length. It then follows that workers with more access to flexible daily starting and ending times, such as those with the shortest hours and those with the longest hours, experience a more unpredictable workweek length than those who are on fixed daily schedules.
In addition, certain major occupations—executive, mana-gerial, and administrative positions; professional occupations, administrative support positions; and private household jobs— reduce the chances of having volatile hours. (Farming occu-pations make up the omitted category.) Those in craft jobs also have reduced chances of working variable hours, but this is due to the concentration of such jobs in certain indus-tries. Conversely, machine operators, assemblers, and inspec-tors; handlers, equipment cleaners, and laborers; and, to a lesser extent, those in sales and service occupations other than protective and household services are more likely to work a variable-hour workweek. (Again, the last of these is in large measure due to their detailed industry distribution.36
Note, however, that the reduced variability of hours in private household jobs and in craft jobs, as well perhaps as the greater variability of hours for sales workers, are attributable, to a large extent, to the more flexible scheduling commonly associ-ated with those occupational classifications.)
THEANALYSISPRESENTEDINTHISARTICLE has resulted in sev-eral noteworthy empirical findings:
1. Access to flexibility in one’s daily work schedule rose across most types of jobs between 1991 and 1997, reaching more than 27 percent of the labor force the latter year and more than doubling since 1985. The form such access takes ap-pears to be mainly in the differentiation and stretching out of the available workday. This is because more than 40 per-cent of the employed now regularly work past 5:00 P.M. each day, and 28 percent begin work at or earlier than 7:30 A.M. (Those starting early, of course, are not necessarily those who stay late.)
2. Many workers are experiencing a tradeoff wherein they work long usual weekly hours in full-time positions while gaining greater access to flexibility in their work sched-ules, because working in excess of 50 hours per week height-ens the chances of obtaining a flexible work schedule. Given that fewer workers are reporting that they work exactly 40 hours and more workers are indicating that they work 49 or
more hours,37 more workers may be willing to endure the
longer workweeks in order to get a more flexible work sched-ule. However, it is possible that the attainment of flexibility may be only a secondary aim of workers or may even be just coincidental across occupations, because working long