THE PARDEE PAPERS / No. 4 / January 2009
Beyond GDP: The Need for
New Measures of Progress
Robert Costanza
Maureen Hart
Stephen Posner
John Talberth
Beyond GDP: The Need for
New Measures of Progress
Robert Costanza
Maureen Hart
Stephen Posner
John Talberth
The Pardee Papers series features working papers by Pardee Center Fellows and other invited authors. Papers in this series explore current and future challenges by anticipating the pathways to human progress, human development, and human well-being. This series includes papers on a wide range of topics, with a special emphasis on interdisciplinary perspectives and a development orientation. Series Editor: Professor Adil Najam
The Frederick S. Pardee Center for the Study of the Longer-Range Future at Boston University convenes and conducts interdisciplinary, policy-relevant, and future-oriented research that can contribute to long-term improvements in the human condition. Through its programs of research, publications, and events, the Pardee Center seeks to identify, anticipate, and enhance the long-term poten-tial for human progress, in all its various dimensions.
The Frederick S. Pardee Center for the Study of the Longer-Range Future Boston University
Pardee House 67 Bay State Road
Boston, Massachusetts 02215
Tel: 617-358-4000 Fax: 617-358-4001 www.bu.edu/pardee
E-mail: [email protected]
The views expressed in this paper represent those of the author(s) and do not necessarily represent the views of the Frederick S. Pardee Center for the Study of the Longer-Range Future or the Trustees of Boston University. The publications produced by the Pardee Center present a wide range of perspectives with the intent of fostering well-informed dialogue on policies and issues critical to human development and the longer-range future.
Produced by Boston University Creative Services © 2009 Trustees of Boston University Printed on recycled paper
Recent Publications
Issues in Brief series
Transportation in Mega-Cities: A Local Issue, A Global Question Nadaa Taiyab (No. 4), November 2008
The Future of Space Exploration: The Next 50 Years Supriya Chakrabarti (No. 3), October 2008 Fostering South-South Research Collaborations
Athar Osama (No. 2), September 2008 The Future of the WTO
Kevin P. Gallagher (No. 1), April 2008
The Pardee Papersseries
Beyond GDP: The Need for New Measures of Progress
Robert Costanza, Maureen Hart, Stephen Posner, John Talberth (No. 4), January 2009
Does Nuclear Energy Have a Future? Moeed Yusuf (No. 3), November 2008
21st Century Trade Agreements: Implications for Long-Run Development Policy Rachel Denae Thrasher and Kevin P. Gallagher (No. 2), September 2008 The Future of Space Exploration and Human Development
A.P.J. Abdul Kalam (No. 1), August 2008
Other Publications
Heretical Thoughts about Science and Society
Freeman Dyson (Frederick S. Pardee Distinguished Lecture), November 2005 Thoughts About Development: Which Are Mere Fads? Which Are Here to Stay?
Paul Streeten, Spring 2005 Must Runaway Science Be Regulated?
David Fromkin, Fall 2003
For a complete list and PDF versions of publications by the Frederick S. Pardee Center for the Study of the Longer-Range Future, visit www.bu.edu/pardee/publications.
Beyond GDP: The Need for
New Measures of Progress
Robert Costanza, Maureen Hart, Stephen Posner, and John Talberth
Abstract
This paper is a call for better indicators of human well-being in nations around the world. We critique the inappropriate use of Gross Domestic Product (GDP) as a measure of national well-being, something for which it was never designed. We also question the idea that economic growth is always synonymous with im-proved well-being. Useful measures of progress and well-being must be measures of the degree to which society’s goals (i.e., to sustainably provide basic human needs for food, shelter, freedom, participation, etc.) are met, rather than mea-sures of the mere volume of marketed economic activity, which is only one means to that end. Various alternatives and complements to GDP are discussed in terms of their motives, objectives, and limitations. Some of these are revised measures of economic activity while others measure changes in community capital—natu-ral, social, human, and built—in an attempt to measure the extent to which development is using up the principle of community capital rather than living off its interest. We conclude that much useful work has been done; many of the alternative indicators have been used successfully in various levels of community planning. But the continued misuse of GDP as a measure of well-being neces-sitates an immediate, aggressive, and ongoing campaign to change the indica-tors that decision makers are using to guide policies and evaluate progress. We need indicators that promote truly sustainable development—development that improves the quality of human life while living within the carrying capacity of the supporting ecosystems. We end with a call for consensus on appropriate new measures of progress toward this new social goal.
In addition to all those whose work is mentioned in this paper and the two anonymous reviewers, the authors would like to acknowledge Bill Becker and the President’s Climate Action Project (PCAP) since at least one strand of the idea for this paper came out of the PCAP’s National Leadership Summits for a Sustainable America. We would also like to thank the Johnson Foundation for hosting the Summits at its Wingspread facility, the Suzuki Foundation for its encouragement of our work on this paper, and the National Science Foundation for graduate research assistant support.
how GDP MeASuReS ecoNoMic PRoGReSS
For more than a half century, the most widely accepted measure of a country’s economic progress has been changes in its Gross Domestic Prod-uct (GDP).1 GDP is an estimate of market throughput, adding together the
value of all final goods and services that are produced and traded for money within a given period of time. It is typically measured by adding together a nation’s personal consumption expenditures (payments by households for goods and services), government expenditures (public spending on the pro-vision of goods and services, infrastructure, debt payments, etc.), net exports (the value of a country’s exports minus the value of imports), and net capital formation (the increase in value of a nation’s total stock of monetized capital goods).
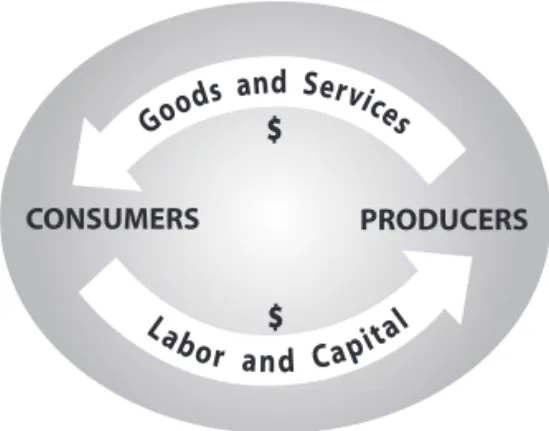
Figure 1 shows a simple representation of the circular flow of income and expenditures within a market economy: individuals, businesses, and govern-ments use capital to create goods and services. In essence, GDP measures the annual volume of this flow (or throughput) in an economy, similar to an electric meter measuring energy use in a building.
Figure 1: Traditional View of economic Activity
1. The Gross National Product (GNP) is another frequently mentioned measure of economic progress. The difference between GDP and GNP is the production boundaries used. GDP measures all goods and services produced in the country whether by domestic or foreign companies. It excludes goods and services produced in other countries. GNP measures all production by domestic companies regardless of where in the world that production takes place. Because its boundaries coincide with the boundar-ies used to measure a country’s population and employment, GDP is more useful for setting domestic policies and evaluating programs. To simplify the discussion in this document, the term GDP will be used throughout this paper to refer to the measure of economic activity although at times in the past, the actual measure used was GNP.
GDP is based on estimates and survey data maintained in a country’s Sys-tem of National Accounts (SNA). These consist of detailed economic census data collected at regular intervals. Annual and quarterly GDP estimates are extrapolated from the census data combined with annual economic survey data such as retail sales, housing starts, and manufacturer shipments (Mar-cuss and Kane 2007).
GDP measures the flow of goods and services produced within the market (goods and services publicly traded for money). Some ‘nonmarket’ produc-tion is included in GDP, such as defense spending by the federal govern-ment and nonprofit spending on emergency housing and health care. But many important economic activities are entirely excluded from GDP mea-surements, such as volunteer work, social capital formation within healthy family units, the costs of crime and an increasing prison population, and the depletion of natural resources.
Since its creation, economists who are familiar with GDP and SNA meth-odology have emphasized that GDP is a measure of economic activity, not economic well-being. In 1934, Simon Kuznets, the chief architect of the United States national accounting system, cautioned against equating GDP growth with economic or social well-being. The US Bureau of Economic Analysis’ description of GDP states the purpose of measuring GDP is to answer questions such as “how fast is the economy growing,” “what is the pattern of spending on goods and services,” “what percent of the increase in production is due to inflation,” and “how much of the income produced is being used for consumption as opposed to investment or savings” (McCulla and Smith 2007). To understand how GDP continues to be misused as a scorecard for national well-being, it is important to consider how the cur-rent system has evolved. It is also important to recognize that GDP is not inherently bad—it measures what it measures. Rather it is being misused as an indicator of something it doesn’t measure and was never intended to measure.
A BRieF hiSToRy oF GDP
When GDP and SNA methodologies were initially developed in the US and UK2 in the 1930s and 1940s, the world was in the midst of major social
and economic upheaval from two global wars and the Great Depression. President Roosevelt’s government used the statistics to justify policies and budgets aimed at bringing the US out of the depression. As it became more likely that the US would become involved in World War II (WWII), there was a concern about whether this would jeopardize the standard of living of US citizens who were just beginning to recover from the depression. GDP estimates were used to show that the economy could provide sufficient sup-plies for fighting WWII while maintaining adequate production of con-sumer goods and services (Marcuss and Kane 2007).
The use of GDP globally as a measure of economic progress was further strengthened as a result of the Bretton Woods Conference. A key factor in the outbreak of WWII was economic instability in a number of countries caused by unstable currency exchange rates and discriminatory trade prac-tices that discouraged international trade. In 1944, in order to avoid a recur-rence of such instability, leaders of the 44 allied nations gathered in Bretton Woods, New Hampshire, to create a process for international cooperation on trade and currency exchange. The intent of the meeting was to “speed economic progress everywhere, aid political stability and foster peace” (IBIBLIO/AIS 1946). International trade would create jobs in all countries. Those jobs would provide income that would allow people everywhere to obtain adequate food, housing, medical care, and other amenities. Improv-ing economic well-beImprov-ing was thus key to creatImprov-ing lastImprov-ing world peace. Growing the economy was seen as the path to economic well-being. The key outcomes of the meeting were the establishment of the Interna-tional Monetary Fund (IMF) and the InternaInterna-tional Bank for Reconstruction and Development (IBRD—now part of the World Bank). The IMF was created as a forum for collaborative management of international monetary exchange and for stabilization of the exchange rates of countries’ currencies. 2. Work by the US and UK Treasuries in the 1930s and 1940s was the foundation of GDP methodolo-gies. Since then the work has been expanded on by many nations and has been formalized in the System of National Accounts. 1993 documentation available at http://unstats.un.org/unsd/nationalaccount/
The World Bank was established to provide investment funds for infrastruc-ture reconstruction and development in war-torn areas and less developed nations in areas such as Latin America. In theory, the governing structures of these institutions were supposed to provide an equal voice to all member countries. In practice, because of its political and economic strength follow-ing WWII, the US dominated both institutions for the first quarter century. As a result, the US dollar, economy, and economic policies became the de facto standards against which other countries were compared. In addition, the work done by the US and UK Treasuries developing GDP methodolo-gies for analyzing economic activity informed much of the discussion at the Bretton Woods meeting. Thus GDP came to be used by the IMF and the World Bank as the primary measure of economic progress in the ensuing 60 years. With the restructuring of these institutions in the 1970s, the US has had a less dominant position within the World Bank and the IMF; however, GDP remains the most widely used measure of economic progress.
Economists have warned since its introduction that GDP is a specialized tool, and treating it as an indicator of general well-being is inaccurate and dangerous. However, over the last 70 years economic growth—measured by GDP—has become the sine qua non for economic progress. Per capita GDP is frequently used to compare quality of life in different countries. Governments often use changes in GDP as an indicator of the success of economic and fiscal policies. In the US, GDP is “one of the most comprehensive and closely watched economic
statistics: it is used by the White House and Congress to prepare the Federal budget, by the Federal Reserve to formulate monetary policy, by Wall Street as an indica-tor of economic activity, and by the business community to prepare forecasts of economic performance that provide the basis for produc-tion, investment, and employment planning” (McCulla and Smith 2007,1). Internationally, changes in a country’s GDP are used by both the IMF and the World Bank to guide policies and determine how and which projects are funded around the world.
Economists have warned since its introduction that GDP is a specialized
tool, and treating it as an indicator of general well-being is inaccurate and dangerous. However, over the last 70 years economic growth—measured by GDP—has become the sine qua non for economic progress.
Today GDP in particular and economic growth in general is regularly referred to by leading economists, politicians, top-level decision-makers, and the media as though it represents overall progress. In fact, a report recently released by the World Bank says that nothing besides long-term high rates of GDP growth (specifically, a doubling of GDP each decade) can solve the world’s poverty problem (Commission on Growth and Development 2008). This is like measuring a building’s energy use and saying that the more elec-tricity, the better the quality of life for the building’s inhabitants. Although electricity powers some of life’s amenities, a higher electric bill, as many people are beginning to find out, does not equate to a better life.
PRoBleMS wiTh uSiNG GDP To MeASuRe QuAliTy oF liFe AND ecoNoMic PRoGReSS
In presenting the GDP to Congress in 1934, Simon Kuznets discussed its uses and limits. After presenting an itemized list of the things measured by the GDP, Kuznets noted, “The boundaries of a “nation” in “national” income are still to be defined; and a number of other services, in addition to those listed above, might also be considered a proper part of the national economy’s end-product.” He went on to list “services of housewives and other members of the family,” “relief and charity,” “services of owned du-rable goods,” “earnings from odd jobs,” and “earnings from illegal pursuits” among others (Kuznets 1934, 3–5). His stated reasons for excluding these
GDP measures everything “…except that which makes life worthwhile.”
“Our Gross National Product…counts air pollution and cigarette advertising, and ambulances to clear our highways of carnage. It counts special locks for our doors and the jails for the people who break them. It counts the destruction of the redwood and the loss of our natu-ral wonder in chaotic sprawl. It counts napalm and counts nuclear warheads and armored cars for the police to fight the riots in our cities..., and the television programs which glorify violence in order to sell toys to our children. Yet the Gross National Product does not allow for the health of our children, the quality of their education or the joy of their play. It does not include the beauty of our poetry or the strength of our marriages, the intelligence of our public debate or the integrity of our public officials. It measures neither our wit nor our courage, neither our wisdom nor our learning, neither our compassion nor our devotion to our country, it measures everything, in short, except that which makes life worthwhile. And it can tell us everything about America except why we are proud that we are Americans.”
things from the GDP are several, but largely boil down to his intent that the GDP be a precise and above all a specialized tool, designed to measure only a narrow segment of society’s activity. This is reflected in his fear that the simplicity of the GDP makes it prone to misuse:
“The valuable capacity of the human mind to simplify a complex situation in a compact characterization becomes dangerous when not controlled in terms of definitely stated criteria. With quantitative measurements especially, the definiteness of the result suggests, often misleadingly, a precision and simplicity in the outlines of the object measured. Measurements of national income are subject to this type of illusion and resulting abuse, especially since they deal with mat-ters that are the center of conflict of opposing social groups where the effectiveness of an argument is often contingent upon oversimplifica-tion” (Kuznets 1934, 5–6).
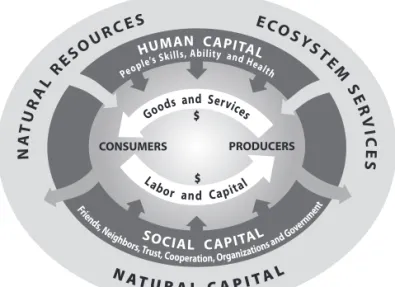
Because GDP measures only monetary transactions related to the produc-tion of goods and services, it is based on an incomplete picture of the system within which the human economy operates. A more complete picture of how the human economic system fits within the social and environmental systems upon which it depends is shown in Figure 2.
Figure 2: View of economy as Part of a larger System
Figure 2 shows that the economy draws benefits from natural, social, and human capital and that the quantity and quality of such capital, in turn, is affected by net investment from the economy. By measuring only marketed economic activity (the inner circle), GDP ignores changes in the natural, social, and human components of community capital on which the commu-nity relies for continued existence and well-being. As a result, GDP not only fails to measure key aspects of quality of life; in many ways, it encourages activities that are counter to long-term community well-being.
Of particular concern is that GDP measurement encourages the depletion of natural resources faster than they can renew themselves. Another concern is that current economic activity is degrading ecosystems, thereby reducing the services that, until now, have been provided to humans virtually for free. For example, in 1997 it was estimated that the world’s ecosystems provided benefits valued at an average of US$33 trillion per year. This was signifi-cantly larger than the total global GDP at the time (Costanza, d’Arge et al. 1997). GDP encourages depletion because clear-cutting a forest for lumber is valued more in GDP terms than the ecosystem services that forest pro-vides if left uncut. These services—including biodiversity habitat, reducing flooding from severe storms, filtration to improve water quality in rivers and lakes, and the sequestration of carbon dioxide and manufacture of oxy-gen—are not part of the market economy and as a result are not counted in GDP. As Herman Daly, formerly the senior economist at the World Bank, once commented, “the current national accounting system treats the earth as a business in liquidation” (cited in Cobb, Halstead et al. 1995).
Another concern that has been raised about GDP as a measure of progress is the ‘threshold effect.’ As GDP increases, overall quality of life often increases up to a point. Beyond this point, increases in GDP are offset by the costs as-sociated with increasing income inequality, loss of leisure time, and natural capital depletion (Max-Neef 1995; Talberth, Cobb et al. 2007). An increas-ingly large and robust body of research confirms that, beyond a certain threshold, further increases in material well-being have the negative side- effects of lowering community cohesion, healthy relationships, knowledge, wisdom, a sense of purpose, connection with nature, and other dimensions of human happiness. In fact, a strikingly consistent global trend suggests that as material affluence increases, these critical components of psychic
income often decline amidst rising rates of alcoholism, suicide, depression, poor health, crime, divorce, and other social pathologies. In his recent book Deep Economy, author Bill McKibben provides an excellent overview of findings from this emerging field (McKibben 2007).
In addition, GDP conceals a growing disparity between the haves and have-nots. An article by Anna Bernasek (The New York Times, June 25,
2006) discusses the links between income disparity and poorer overall health in a country, de-creased worker productivity, and increased social unrest. “A highly unequal distribution of income can be detrimental to economic welfare by increasing crime, re-ducing worker productivity, and reducing investment. Moreover, when growth is concentrated in the wealthiest income brackets it counts less towards improving overall economic welfare because the social benefits of increases in conspicuous consumption by the wealthy are less beneficial than increases in spending by those least well off” (Talberth, Cobb et al. 2007).
oTheR wAyS To MeASuRe PRoGReSS
A number of ways of measuring national-level progress have been pro-posed, developed, and used to address this growing realization that GDP is a measure of economic quantity, not economic quality or welfare, let alone social or environmental well-being. The measures also address the concern that GDP’s emphasis on quantity encourages depletion of social and natural capital and other policies that undermine quality of life for future genera-tions. In general, these new measures can be categorized as: (1) indexes that address the issues described above by making ‘corrections’ to existing GDP and SNA accounts; (2) indexes that measure aspects of well-being directly;
A number of ways of measuring na-tional-level progress have been pro-posed, developed, and used to address this growing realization that GDP is a measure of economic quantity, not economic quality or welfare, let alone social or environmental well-being. The measures also address the con-cern that GDP’s emphasis on quantity encourages depletion of social and natural capital and other policies that undermine quality of life for future generations.
(3) composite indexes that combine approaches; and (4) indicator suites. Like GDP, all these measures are abstracted indicators showing a view from 30,000 feet, not comprehensive reports on the heart and soul of individual communities. However, some can and are being used to inform local and regional decisions. This is an improvement on the misuse of GDP and eco-nomic growth as a proxy for well-being.
An ongoing debate within the indicators community is whether GDP should be improved on, replaced by these other approaches, or supple-mented. A case can be made for relying on measures that improve GDP because it would be rather straightforward to rearrange the accounting pro-tocols to recognize that some expenditures now counted as beneficial should actually be counted as harmful or defensive in nature. The case for replacing GDP altogether rests on the fact that GDP is not, in fact, a true measure of welfare and was never meant to serve that purpose at all. Advocates for supplementing GDP with these other measures point out that GDP, while a poor measure of welfare, nonetheless “serves crucial and helpful roles in macroeconomic policy” and is “unique in that it combines simplicity, linear-ity, and universality as well as carries the objectivity of the observable market price as its guiding principle” (Goossens, Mäkipää et al. 2007, 60). Below we consider some of the candidates. This is not a comprehensive list, but simply some of the better-known examples.
iNDexeS ThAT ‘coRRecT’ GDP
Some alternative indicators of economic well-being use the national ac-counts and GDP as the foundation and then add or subtract quantities in an attempt to address some of the issues discussed above. These include the Index of Sustainable Economic Welfare, the Genuine Progress Indicator, Green GDPs, and Genuine Wealth. Because these measures are based on much of the same economic data as GDP, these measures still have limita-tions, including:
• Lack of consensus on how to value items that are not regularly reported in monetary terms (e.g., volunteer labor or illegal activities);
• Subjectivity in deciding which expenses are beneficial and therefore should be added to the total and which are detrimental and therefore need to be subtracted (i.e., junk food and home security systems); and
• Lack of consensus on how to quantify the costs of depleting natural resources.
However, applications of these new accounting systems provide compelling evidence of a widening gap between GDP and true economic well-being, indicating that, over time, more and more economic activity may be self-canceling from a welfare perspective (Max-Neef 1995).
index of Sustainable economic welfare/ Genuine Progress indicator
The Index of Sustainable Economic Welfare (ISEW), later revised and re-named the Genuine Progress Indicator (GPI), is a measure that uses GDP as a foundation. It was first proposed in 1989 by Daly and Cobb in their book For the Common Good as “a way of measuring the economy that will give better guidance than the GNP to those interested in promoting economic welfare” (Daly and Cobb 1989, 401). In developing the ISEW, the authors built on work by Zolotas on the Index of Economic Aspects of Welfare (EAW) and Nordhaus and Tobin’s Measure of Economic Wealth (MEW). In particular Daly and Cobb wanted an index that accounted for both current environmental issues and long-term sustainable use of natural ecosystems and resources. In 1995, a group called Redefining Progress issued a revised methodology and changed the name of the measure to the Genuine Progress Indicator (GPI).
While GDP is a measure of current income, GPI is designed to measure the sustainability of that income, essentially measuring whether progress is a result of living off the interest of community capital or spending it down. “Both the GPI and ISEW use the same personal consumption data as GDP but make deductions to account for income inequality and costs of crime, environmental degradation, and loss of leisure and additions to account for the services from consumer durables and public infrastructure as well as the benefits of volunteering and housework. By differentiating between
economic activity that diminishes both natural and social capital and activity that enhances such capital, the GPI and its variants are designed to measure sustainable economic welfare rather than economic activity alone” (Tal-berth, Cobb et al. 2007, emphasis added).
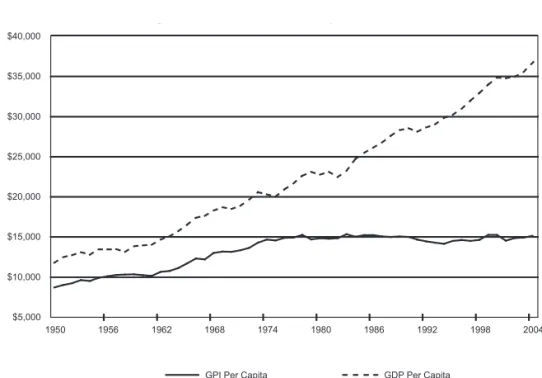
Figure 3: Real GDP and GPi Per capita 1950–2004
Source: Talberth, Cobb, et al. 2007.
Figure 3 shows the trend in GDP and GPI for the US from 1950 to 2004. Despite steady growth in GDP, the US economy, measured by GPI, has actually stagnated since the late 1970s as income inequality, environmental degradation, and the US’s failing international position take their toll on real economic progress (Talberth, Cobb et al. 2007).
Green GDP
Numerous attempts have been made to develop Green GDPs—GDPs that factor estimates for environmental degradation and depletion of natural resources into the national income accounts to arrive at a single number. Work on a Green GDP for Japan in the 1980s informed the Daly and Cobb efforts on the ISEW. Green GDP calculations also have been developed for
countries as diverse as Australia, Canada, China, Costa Rica, Indonesia, Mexico, Papua New Guinea, and the US, although none of these efforts have resulted in regular reporting of the results. The recent efforts by China to measure and report on a Green GDP are described below in the section on barriers.
Genuine Savings
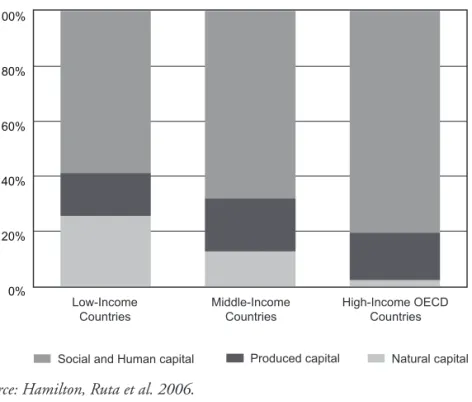
Genuine Savings (GS) was developed for the World Bank (World Bank 1997) and is defined as “the true level of saving in a country after deprecia-tion of produced capital; investments in human capital (as measured by education expenditures); depletion of minerals, energy, and forests; and damages from local and global air pollutants are taken into account” (Ham-ilton, Ruta et al. 2006, xv). This includes the value of global damages from carbon emissions. GS measures the built, natural, and intangible capital that is required for human society to exist and to thrive. Intangible wealth is related to the social and human capital of a nation and includes skills and know-how of the labor force, trust and cooperation/collaboration, efficient judicial systems, clear property rights, and effective government. Like the GPI, the national income accounts are the underpinnings of GS. The calcu-lation subtracts amounts for environmental degradation and resource deple-tion and adds in amounts for investments in human capital. GS attempts to measure sustainable use of resources although it does not take into account equity issues related to consumption. The GS has been calculated for 120 countries. One significant finding detailed in the World Bank’s 2006 report Where is the Wealth of Nations? Measuring Capital for the 21st Century is that increased wealth in a country is primarily the result of an increase in intangible wealth—human capital and the formal and informal institu-tions that humans create. As shown in Figure 4, 25 percent of the wealth of poor countries is natural capital—this percentage declines as a country gets wealthier because high income countries have a larger percentage of wealth in intangibles (human and social capital). One conclusion from this is that, especially for the poorest nations, increasing economic activity by selling off natural resources actually results in lower welfare in the long run.
Figure 4: Percent of wealth
Source: Hamilton, Ruta et al. 2006.
iNDexeS ThAT Do NoT uSe GDP
Some alternative indexes do not measure economic activity; rather, they measure environmental or social activities, well-being, or changes in envi-ronmental, social, or human capital.
ecological Footprint
The Ecological Footprint (EF) was developed by Mathis Wackernagel and William Rees as a way to account for flows of energy and matter into and out of the human economy and convert those flows into a measure of the area of productive land and water required to support those flows (Wacker-nagel and Rees 1996). The EF is intended to be used as a resource manage-ment tool for assessing whether and to what extent an individual, city, or nation is using available ecological assets faster than the supporting ecosys-tems can regenerate those assets. Most recent estimates show that humanity’s Ecological Footprint is 23 to 40 percent larger than renewable rates;
how-ever, the vast majority of this overshoot is attributable to carbon emissions and not mismanagement of terrestrial or aquatic biomes (Venetoulis and Talberth 2006). Future improvements to footprint methods will remedy EF’s current inability to distinguish between sustainable and unsustainable use of these biomes. The EF has been used as a stand-alone index of en-vironmental sustainability and is also used as part of composite indicators described below. Over the last 12 years, EFs have been calculated for most nations and for numerous subnational regions.
Subjective well-Being
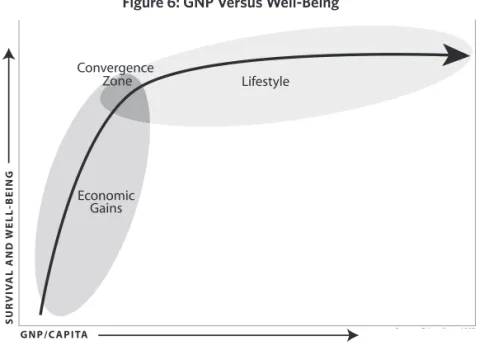
Over the last two decades, there has been a growing body of work that evaluates human well-being based on self-reporting by individuals and groups. Generally referred to as measures of subjective well-being (SWB), these studies attempt to measure “satisfaction” with quality of life or people’s moods and emotions (Diener and Suh 1999). The intent is to measure the extent to which human needs are actually being met. Because these mea-sures are based on the judgments of the survey respondents rather than on more easily quantifiable inputs of money and material goods, there are concerns that these “subjective” measures are not factually based and there-fore less valid than “objective” measures like GDP. However, as pointed out by Costanza and others, objective measures such as life expectancy, rates of disease, and GDP are only proxies for well-being that have been identified through the subjective judgment of decision-makers; “hence the distinction between objective and subjective indicators is somewhat illusory” (Costanza, Fisher et al. 2007, 268). There is also a concern that there are cultural dif-ferences that make it difficult to compare the results across different ethnic, gender, age, religion, and other cultural boundaries. As Figure 5 shows, comparisons of reported well-being and per capita GDP have shown that beyond a certain income level, happiness does not increase significantly with additional income. Figure 6 illustrates the trend in which economic gains beyond the threshold no longer correlate with increases in well-being (Ingle-hart 1997). The World Database of Happiness is a compilation of studies and data related to happiness and satisfaction surveys (Veenhoven 2008).
Figure 5: Percent Very/Quite happy vs. GDP
Sources: World Values Surveys; GDP per capita from United Nations Statistics Divi-sion—National Accounts. Nominal-Real GDP adjustments made with Consumer Price Index annual averages from US Bureau of Labor Statistics.
Figure 6: GNP Versus well-Being
Source: Inglehart 1997.
Figure 5: Percent Very/Quite Happy vs. GDP
Albania Algeria Argentina Austria Belgium Bulgaria Belarus Canada Chile China Czech Rep. Denmark El Salvador Estonia FinlandFrance Germany Greece Hungary Iceland India Indonesia Iran Iraq Ireland Israel Italy Japan Rep.Korea Latvia Lithuania Malta Mexico Rep.Moldova Netherlands Peru Philippines Poland Portugal Puert Romania Russian Fed.
Saudi Arabia Singapore
Slovakia Slovenia Zimbabwe Spain Sweden Egypt U.S.A. 40% 50% 60% 70% 80% 90% 100%
$0 $5,000 $10,000 $15,000 $20,000 $25,000 $30,000 $35,000 $40,000 $45,000
Real GDP per capita in 2004 US Dollars
Percent V
ery/Quite Happy
Gross National happiness
Gross National Happiness (GNH) is frequently mentioned as an alterna-tive measure of progress. It was originally suggested by the King of Bhutan in the early 1980s as a more appropriate measure for his small kingdom than GDP. It was not an actual index, but a principle for guiding Bhutanese development in a fashion consistent with the country’s culture and spiritual values rather than by focusing on increasing economic activity. Since 2004, the Bhutan government has sponsored four international conferences on GNH. Bhutan has established a Gross National Happiness Commission but a specific methodology for measuring GNH has not yet been defined (Ura and Galay 2004).
coMPoSiTe iNDexeS iNcluDiNG GDP
All of the alternatives to GDP (and GDP itself) are composite indexes that combine several different measures into a single number. Here we list some indexes that combine GDP or GDP variants with some of the non-GDP environmental or social indexes already described or with other measures of well-being.
human Development index
Since 1990, the United Nations Development Program has used the Human Development Index (HDI) in its annual Human Development Report. The purpose of the report is to show how well the management of economic growth and human development is actually improving human well-being in the nations of the world. The inaugural report defines human development as the “process of enlarging people’s choices...to live a long and healthy life, to be educated, have access to resources needed for a decent standard of living,...[to have] political freedom, guaranteed human rights and personal self-respect.” However, the authors acknowledge the difficulty of quantifying the last three components, and the index focuses on “longev-ity, knowledge and decent living standards” as proxies for people’s ability to live long and prosperous lives (UN Development Program 1990).
• Longevity is measured using life expectancy at birth. This also serves as a proxy for other aspects of well-being such as adequate nutrition and good health.
• Knowledge is measured using literacy rate and school enrollment, which are intended to reflect the level of knowledge of the adult population as well as the investment in the youth.
• Access to a decent standard of living is measured using GDP ad-justed to reflect purchasing power parity and the threshold effect using a logarithm of real GDP per capita.
Initially reported for 14 countries, the UN’s 2007 report presented HDI results for 177 countries (UN Development Program 2007).
living Planet Report
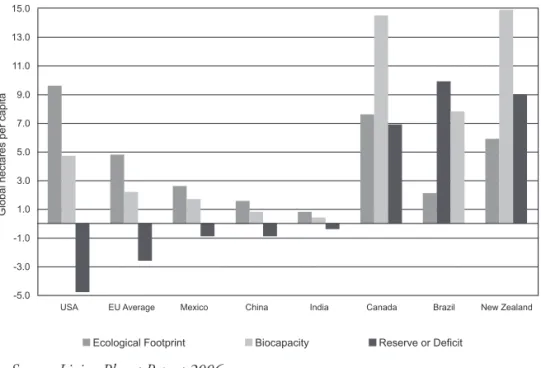
Along with several partner agencies, in 1998, the World Wide Fund for Nature (WWF, formerly the World Wildlife Fund) published the first Liv-ing Planet Report. The report has two components: the state of the world’s natural environment and the burden placed on the natural environment by humanity. The Living Planet Index (LPI) is a measure of the world’s forests, freshwater and marine ecosystems, specifically on the “extent and severity of biodiversity loss” (Hails 2006). The LPI tracks biodiversity trends by track-ing the populations of 1,313 species of fish, amphibians, reptiles, birds, and mammals. In the initial reports, the Global Consumption Pressure—a mea-sure of six subcomponents of human-related consumption of grain, marine fish, wood, cement, carbon dioxide emissions, and water withdrawals—was the measure of the human burden on the environment (Loh, Randers et al. 1998). Since 2002, the Ecological Footprint has been used as the measure of human consumption and waste generation. The 2006 Living Planet Report (LPR) showed that human use of the earth’s biocapacity is exceeding the regenerative capacity by 25 percent.3 Figure 7 compares selected countries’
biocapacities with their ecological footprints on a per capita basis using
3. Using a different method for factoring carbon emissions and the needs of other species, Redefining Progress estimated the degree of overshoot to be 40% (Venetoulis, J. and John Talberth. 2007. Refining the Ecological Footprint. Environment, Development, and Sustainability 10: 441–469).
the LPR estimates. Some countries like Brazil and Canada have a positive reserve because of their vast land areas, relatively small populations, and per capita use below the regeneration rate. However, most countries in the world are operating at a loss in terms of biocapacity.
Figure 7: living Planet index
ecological Reserve/Deficit for Selected countries
Source: Living Planet Report 2006.
happy Planet index
The purpose of the Happy Planet Index (HPI), developed and published by the New Economics Foundation (NEF), is to measure a country’s ecological efficiency in delivering human well-being. The index is a composite of three measures: life expectancy at birth, life satisfaction, and ecological footprint. The 2006 report by NEF shows the results for 178 countries using a color coding scheme that depicts graphically not only how a country rates on the HPI scale but also how the three components affected the rating. Countries can also have similar life satisfaction measures but different overall results. For example, although people in the US and New Zealand report similar levels of life satisfaction, New Zealand’s overall HPI is 13 points higher than the US’ because the average New Zealander has a slightly higher life
expec--5.0 -3.0 -1.0 1.0 3.0 5.0 7.0 9.0 11.0 13.0 15.0
tancy and uses only half the resources of the average US citizen as measured by their respective Ecological Footprints (Marks, Abdallah et al. 2006). An interesting result of comparing the HPI and HDI methodologies is that two countries can have very similar results for the HDI but have very differ-ent results of HPI. For example, Honduras’s HPI is 30 points higher than Moldova even though the two countries have similar HDI ratings, ecologi-cal footprint and life expectancy. The reason is that the Life Satisfaction in Honduras is more than double that of people in Moldova.
iNDicAToR SuiTeS
All of the indicators mentioned so far, including GDP, are based on the ag-gregation of a large number of variables into a composite index. Many new measures of progress do not attempt this final aggregation step, but simply report many indicators separately. These systems leave the final aggregation step, which answers the question: “what does this all mean?,” to the user. There are a very large number of these indicator suites in use at a variety of scales from municipal to national. For example, the UN Division for Sus-tainable Development lists on its website a large set of indicators, along with guidelines and methodologies (UN DESA 2009). Here we mention only a few of the more relevant examples.
National income Satellite Accounts
One problem with developing Green GDP methodologies is that the Sys-tems of National Accounts (SNA) on which GDP is based use exclusively monetary transactions to establish values for items. As a result, natural resources and ecosystem services, which are not traded in markets, are left out. Rather than estimating “shadow” values for these items and includ-ing them directly in the SNA, another method that has been used is the creation of supplemental or “satellite” accounts, some of which are reported in physical units. In 2003, the Handbook of National Accounting: Integrated Environmental and Economic Accounting was published jointly by the United Nations, International Monetary Fund (IMF), the Organization of Eco-nomic Cooperation and Development (OECD), the Statistical Office of the European Communities (Eurostat) and the World Bank, as guidance for this
process. They list four categories of satellite accounts to augment the SNA:
• Flow accounts that provide information at the industry level about the use of energy and materials as inputs and the genera-tion of pollutants and solid waste;
• Expenditure accounts that show the amount of money spent by industry, government, and households to protect the environ-ment or manage natural resources;
• Natural resource asset accounts that measure quantities of natural resources such as land, fish, forest, water, and minerals; and
• Accounts of the non-market flow and environmentally adjusted aggregates to show how non-market items are valued and ad-justed for natural resource depletion and degradation.
The Handbook of National Accounting satellite accounts do not include social and human capital components. But other efforts to produce satellite accounts are looking at components such as health, education, volunteer activity, and household production. In general, producing satellite accounts is a way to put additional information “on the table,” but avoids the difficult task of fully integrating such information into the existing SNA.
calvert-henderson Quality of life indicators
The Calvert-Henderson Quality of Life Indicators were developed as a col-laborative effort between the socially responsible investment firm, Calvert Group, economist and futurist Hazel Henderson, and a multi-disciplinary group of practitioners and scholars from government agencies, for-profit firms, and nonprofit organizations. The indicators, the result of an extensive six-year study, cover 12 issue areas: education, economy, energy, environ-ment, health, human rights, income, infrastructure, national security, public safety, recreation, and shelter. The indicators were developed as a suite rather than as a composite, leaving overall interpretation to the user. They were published in a report in 2000 and have been maintained online since then at www.calvert-henderson.com (Henderson, Lickerman et al. 2000).
Millennium Development Goals and indicators
In 2000, leaders of 189 countries signed the United Nations Millennium Declaration, which established eight international goals for improving the global human condition. The goals included eradicating extreme hunger and poverty, achieving universal primary education, promoting gender equality and empowering women, reducing child mortality, improving maternal health, combating HIV/AIDS, malaria and other diseases, ensur-ing environmental sustainability, and developensur-ing a global partnership for de-velopment. Forty-eight indicators were defined to measure progress towards these goals (UN DESA 2007).
BARRieRS To MeASuRiNG ReAl PRoGReSS
Although problems with GDP as a measure of economic progress have been known since its inception and numerous alternative measures have been proposed, there are still significant barriers to developing, implementing, and using better measures of progress. These can be generally categorized as data/methodology issues and social/institutional issues. The data/methodol-ogy barriers are common to all indicators, including GDP, and can be dealt with technically. The social/institutional barriers may ultimately be more difficult to overcome.
DATA AND MeThoDoloGy BARRieRS To BeTTeR MeASuReS oF PRoGReSS
Indicators are intended to provide information about a system—its current condition, how that condition has changed or will change over time, and the condition of and changes in the forces affecting the system. By choosing particular indicators, one is also defining what is important—one is defin-ing goals. To be useful, an indicator needs to be reliable and the underlydefin-ing data needs to be available in a timely fashion and at an appropriate scale and scope. In addition, an indicator needs to appropriately inform decisions or measure progress toward desired goals. Critics of alternative or complemen-tary measures argue that data and methodology issues are barriers to the use of these in place of GDP (Parris and Kates 2003; Fox 2008).
Data Barriers
The data-related barriers to better measures of progress involve the reliabil-ity and availabilreliabil-ity of the underlying data. Availabilreliabil-ity relates to the timeli-ness and the scale and scope of the data collected. It should be noted this is a partial list of data barriers. For example, data confidentially can also sorely limit the use of available data.
Data Reliability
Indicator reliability is whether a change in an indicator is an accurate signal of change in the system it is supposed to measure. To the extent that they are based on GDP and SNA data, alternative measures meet the same stan-dard of accuracy. Where alternative measures are based on environmental or social data, the data may be less accurate. However, given a similar level of investment of resources, the environmental and social data could probably match GDP data accuracy. But there will always be variation in data quality both within and between indicators, and instead of drawing an arbitrary line of acceptable data quality to include, we could do a better job of as-sessing and communicating data quality for all indicators and their compo-nents. For example, systems for “grading” data quality have been proposed for this purpose (Costanza, Funtowicz et al. 1992).
Data Timeliness
Timeliness relates to the frequency with which the underlying data is available. GDP is currently reported annually for all countries of the world. In the US and many other developed nations, GDP is reported quarterly. As with data accu-racy, where the alternative measures are based on GDP data, the timeliness is the same. Where the alternative measures are based on other sources—such as peri-odic non-market valuation surveys —the infrastructure does not currently exist to gather and report the data as frequently. However, several of the alternative measures have garnered sufficient support from governments, nonprofits, and foundations to begin creating the infrastructure to gather and report the data on a regular basis. The HDI, GPI, EF, and LPI all fall into this category.
Data Scope and Scale
Data scope is the breadth of the items that are measured. The scope of GDP data has evolved over its 70 year existence and is standardized in its meth-odology. Data scale is the level of detail of the data collected and reported. Although at the smallest scale, some data is collected at the level of an indi-vidual person or business, it is reported at larger scales for privacy reasons. The scale at which GDP data is reported depends on a nation’s informa-tional infrastructure. GDP data is reported at the nainforma-tional level for all coun-tries of the world. In the US and other developed nations, GDP is regularly reported at the national, state, and metropolitan regional scales, although the reliability and timeliness of the data decreases with the scale. As with data reliability and timeliness, where the alternative measures use GDP data, their scale and scope are the same as GDP. Since these methodologies were developed, the ISEW and GPI have been calculated for numerous countries including the UK, the US, Netherlands, Australia, Chile, and Canada. It has also been calculated for subnational regions including Alberta, Atlantic Canada, counties in the San Francisco Bay area, and Chittenden County, Vermont. However, for the environmental and social data, there is a lack of institutional infrastructure in all nations of the world. There is clearly a need for better data on multiple aspects of social and environmental condi-tions including human and ecosystem health, education, and community well-being.
Over its 70 year history, the evolution of the SNA has resulted in the devel-opment of the necessary informational infrastructure and intellectual know-how to collect, manage, analyze, and report GDP. This ensures that GDP is an accurate and timely measure of changes in marketed economic activity in developed nations. GDP efforts in nations with less developed governmen-tal and financial accounting institutions continue to improve with assistance from international standardization institutions. Because efforts to collect and manage data for alternative measures have been under way for only 20 to 30 years with extremely limited funding, the informational infrastruc-ture and expertise for this data is much less extensive. The lack of data and infrastructure is a significant barrier to implementing better measures of progress.
Methodology Barriers
The methodology-related barriers involve standardization issues and the values implied by what is actually measured.
Methodology Standardization
Methodology standardization refers to the decisions underlying the con-struction of an indicator—which items are chosen, how items are measured, and how different items are combined. Originally developed by the US and UK Treasuries, standardization of GDP methodologies is now overseen by the UN’s Department for Economic and Social Information and Policy Analysis Statistical Division. Green GDP is also being standardized by this agency. A number of the other alternative measures are also being refined by collaborative efforts of governments, nonprofits, and foundations. These include the GPI, EF, and LPI. As with Green GDP, these efforts have only been under way for a comparatively short period of time and much work remains to be done to reach consensus on the standards.
Values Embedded in Methodologies
Indicators reflect societal choices, values, and goals. We measure what we think is important and our choice of indicators implicitly defines our goals. As society changes, what is most important also changes and indicators should change to reflect that. GDP includes primarily those items that have readily quantifiable monetary value. This is seen by some as being a very ‘objective’ measurement, but it really reflects the relative social impor-tance of rebuilding material infrastructure after WW II. Some alternative measures are based on measures of ecosystem health and measures of the stocks and flows of natural resources. Many of these measures are consid-ered ‘objective’ although the accuracy or precision of the underlying data or lack of standardization of the methodology is often called into question. Other alternative measures are based on surveys of individuals’ perceptions of well-being. This is generally considered to be very ‘subjective’ data. A frequent criticism of alternative measures is the subjective nature of the decisions used to create the methodologies (England 1998; Neumayer 1999; Neumayer 2000; Lawn 2003; Lawn 2005). However, as Simon Kuznets
observed while designing GDP, “for those not intimately acquainted with [systems of national accounts] it is difficult to realize the degree to which estimates of national income have been and must be affected by explicit or implicit value judgments” (Kuznets, Epstein et al. 1941, 5).
SociAl AND iNSTiTuTioNAl BARRieRS To BeTTeR MeASuReS oF PRoGReSS
The social and institutional barriers to better measures of progress are pri-marily based on resistance to change. These barriers include the dominance of the “growth is good” paradigm, lack of leadership, and the power of those with a vested interest in maintaining the status quo.
Dominance of “Growth is Good” Paradigm
The belief that growing GDP will solve all economic problems is itself the biggest barrier to better measures of progress. Across the world, the growth of economic activity is heralded as a universal remedy. Most reports in the general press equate GDP growth
with improvements in human well-being. Business leaders, economists, media, and govern-ments claim that there is no better way to measure economic progress than GDP; there is no better way to eradicate poverty than growing GDP; and there is no way to maintain current levels of employment without growing
GDP. As a result, the general public believes that GDP is the correct mea-sure and that growth is good. In addition, many top-level leaders are fixated on the pursuit of throughput-increasing technological advancements and openly reject goals that are inconsistent with growth (Lawn 2001). In short, the main force supporting the continued use of GDP is the GDP-based growth paradigm itself.
The social and institutional barriers to better measures of progress are pri-marily based on resistance to change. These barriers include the dominance of the “growth is good” paradigm, lack of leadership, and the power of those with a vested interest in maintaining the status quo.
lack of political leadership
Political leadership on the issue is also lacking, in part because of the lack of public interest and attention, but also because of the perceived danger to political power—if the new indicators show that past and current policies create problems, this will reflect badly on the people in charge of mak-ing those policies. One of the most publicized examples of this is China’s recent attempt to develop a Green GDP. In 2004, the Chinese government announced that it would develop a methodology for measuring economic growth that factored in the environmental consequences of that growth. Re-leased in 2006, the initial report estimated that 20 percent of China’s GDP growth was counterbalanced by depletion of natural resources and degrad-ing the environment (Liu 2006; Jun 2007). China’s Green GDP project was canceled in 2007 because of political concerns, in part due to how the results reflected on the performance of specific regions (PBS 2007; Talberth 2008).
Vested interest in maintaining the status quo
There are also organizations and institutions with a vested interested in maintaining the status quo—this includes industries and businesses whose financial success is predicated on continually increasing economic activity as well as those institutions that are charged with collecting, managing, and reporting on the current indicators. Finally, those institutions and orga-nizations that are working on better measures of progress waste time and resources arguing over the minutia of methodology and data rather than presenting a united front on the pressing need for better measures.
MoViNG FoRwARD: ADoPTiNG BeTTeR MeASuReS oF GloBAl PRoGReSS
Agree to move forward
The first step is to agree on new global goals: goals that recognize that our economic system is a tool for improving well-being and not something to grow mindlessly for its own sake. The capacity for international consensus on global goals has been demonstrated with processes such as the United Nations Millennium Summit (results include the Millennium Development Goals) and the Intergovernmental Panel on Climate Change (IPCC) (results
include numerous Assessment Reports). An essential element of this step is to agree that GDP does not measure progress towards these new goals and to create an open and transparent process for a global dialogue on working towards the new goals and determining how progress will be measured. The process must engage all relevant stakeholders and define each participant’s contribution towards the goals, and how that contribution will be evaluated so that policies, programs, and plans can be adjusted as needed to ensure progress. In addition, we also have to understand, acknowledge, and truly grasp that these national measures are not for bragging rights, for deter-mining the best, happiest, healthiest country or the worst, sorriest, poorest country. Rather they are for defining common goals and measuring each country’s contribution towards those goals.
Facilitate the paradigm shift by redefining the problem
Donella Meadows wrote that “the shared idea in the minds of society, the great big unstated assumptions—unstated because unnecessary to state; everyone already knows them—constitutes that society’s paradigm, or the deepest set of beliefs about how the world works” (Meadows 1999, 17). Adopting new measures of global progress requires a significant change in the global consciousness as to what actually constitutes progress. The atten-tion of the general public is focused on the issues of climate change, rising oil prices, growing inequality, economic uncertainty, financial collapse, and global social unrest. Once we agree that GDP is not the right measure, we need to talk about how the new and improved measures will help move us in the right direction. This also requires changing the focus of the discussion from “growth” to “progress” and from economic production to sustainable human well-being.
work to change the paradigm at all scales and in all sectors
Two frequently stated axioms are “what gets measured, gets managed” and “what gets measured, gets done.” However these axioms generally are ap-plied at a small scale, where the person monitoring the measurement has control over actions that affect the measurement. At the scale of national and global well-being, the measurements, actions, and results are not the responsibility of or under the control of any single individual, organization,
or even nation. Consequently there is a disconnect between actions and outcomes. Westward expansion worked in the US as a paradigm until we reached the Pacific Ocean. Expansion continued to be a useful metaphor as long as the world was seen as an “empty world;” however, we are now enter-ing an era where a “full world” metaphor is the more accurate description of reality. We need new ways to talk about progress and new ways to measure progress. We need to change the paradigm and the measures that are used at all levels of society—from international down to individual.
Stop arguing about the details and strive for consensus on the big picture
The switch to better measures of progress is hampered by continuing argu-ment by indicator experts on what is the best or correct measure of eco-nomic and social progress. The aim is not an academic exercise to find the perfect indicator but an ongoing global dialogue to agree on workable solu-tions. All indicators are proxies and limited in scope. By themselves none
can really measure all significant aspects of economic, social, and environmental well-being. How-ever, there is a need for consensus on better indicators to set policy, inform decisions, and measure progress. Efforts to develop better measures have been under way for more than a quarter century. All of the proposed measures have issues related to data availability, reli-ability, and accuracy as well as concerns about the objectivity or subjectivity of the underlying methodology. However, arguments about measurement issues only serve to obscure the fact that GDP has the same problems and is no longer a useful tool for evaluating policy decisions. We desperately need to build consensus on new measures.
We need new ways to talk about ress and new ways to measure prog-ress. We need to change the paradigm and the measures that are used at all levels of society—from international down to individual.
use the appropriate indicators for the appropriate task
The purpose of national indicators is to act as a dashboard or a compass— providing a signal or sign as to whether national-level policies and programs are moving us in the right direction. Given the complexity of the problems confronting humanity, a single indicator will most likely not be sufficient; a comprehensive set of integrated indicators may be most effective at provid-ing a signal as to whether national level policies and programs are movprovid-ing us in the right direction.
coNcluSioNS
At the time it was conceived, GDP was a useful signpost on the path to a better world: a path where increased economic activity provided jobs, income, and basic amenities to reduce worldwide social conflict and prevent a third world war. That economic activity has created a world very different from the one faced by the world leaders who convened at Bretton Woods in 1944. We are now living in a world overflowing with people and man-made capital, where the emphasis on growing GDP and economic activity is leading the world back toward the brink of collapse. As Herman Daly said recently:
“Economists have focused too much on the economy’s circulatory system and have neglected to study its digestive tract. Throughput growth means pushing more of the same food through an ever larger digestive tract; development means eating better food and digesting it more thoroughly” (Daly 2008).
The world financial system is in crisis, partly as a result of overemphasis on material growth at all costs and a neglect of real and balanced development. Now, the world is in need of new goals and new ways to measure progress towards those goals. There is a need for a global dialogue and consensus on these issues.
The time is right to embark on a new round of consensus-building processes that will re-envision what was institutionalized over the last 65 years. The need is clear for:
(1) new goals with a broader view of interconnectedness among long-term, sustainable economic, social, and ecological well-being;
(2) better ways to measure progress towards these goals; and
(3) an invigorated campaign for the realization of this evolved economic system with new institutions.
We envision a series of coordinated meetings not dissimilar in scope from the IPCC or the Millennium Ecosystem Assessment, and with similarly appropriate leadership. This series of meetings would function somewhat like the original Bretton Woods meetings in that it would set the goals, institutions, and measures for progress at multiple scales, from communities to states, countries and the whole world. There would be major differences from the original Bretton Woods meetings, however. The new meetings would have additional clarity of purpose: to create solutions to today’s global challenges, with care to bring onboard all the new thinking about what progress is and how to measure it and with much broader stakeholder participation than the original Bretton Woods. The goal of such a series of meetings would be broad consensus, with broad participation, high-level input, and transparent incorporation of the issues put forth in this paper. The OECD’s Measuring the Progress of Societies initiative is already headed in this direction. There were global fora in Palermo in 2004 and Istanbul in 2007 and another is scheduled in South Korea in late 2009. As part of this process, a knowledge base has been created that: (1) describes initiatives around the world on measures of progress and demonstrates the growing interest in these new measures; (2) assists those interested in the develop-ment, use, and communication of indicators of progress; and (3) creates a community of experts who can share their experiences and together define best practices (OECD 2009). In November 2007, the European Commis-sion, European Parliament, Club of Rome, OECD, and WWF hosted a conference on Beyond GDP with the objectives of clarifying which indexes are most appropriate to measure progress, and how these can best be inte-grated into the decision-making process. In closing the conference, Stavros
Dimas, the European Commissioner for Environment, noted that “the main achievement of this conference has been to clearly demonstrate the politi-cal consensus on the need to go beyond GDP” (Environment Commission 2007). In October 2008, the European Economic and Social Committee voted overwhelmingly to recommend that the EU begin to measure and report on progress that is not exclusively based on economic growth but is also determined by social and environmental factors. The recommendation further calls for these better measures to be taken into account in policy making that will lead “to better and more balanced political choices and contribute to a more sustainable and socially inclusive economy” (EESC 2008). These initiatives need to continue, grow, and multiply, ultimately building a broad global consensus on new goals for society and new mea-sures of progress toward those goals.
The current financial crisis has laid bare some of the inherent flaws in the current system. It has also provided an opening to make significant changes in that system to help create a better, more sustainable, and desirable future. We need to seize that opportunity.
BiBlioGRAPhy
Cobb, C., T. Halstead, et al. 1995. If the GDP is Up, Why is America Down? The Atlantic Monthly. 276: 59–78.
Commission on Growth and Development. 2008. The Growth Report: Strategies for Sustained Growth and Inclusive Development. Washington, DC: World Bank. Costanza, R., R. d’Arge, et al. 1997. The value of the world’s ecosystem services and
natural capital. Nature 387: 253–260.
Costanza, R., B. Fisher, et al. 2007. Quality of life: An approach integrating opportunities, human needs, and subjective well-being. Ecological Economics 61: 267–276.
Costanza, R., S. O. Funtowicz, et al. 1992. Assessing and communicating data quality in policy relevant research. Environmental Management 16: 121–131. Daly, H. 2008. A Steady-State Economy. UK Sustainable Development Commission. Daly, H. E. and J. B. Cobb, Jr. 1989. For the Common Good: Redirecting the
Economy Toward Community, the Environment, and a Sustainable Future. Boston: Beacon Press.
Diener, E. and E. M. Suh. 1999. National Differences in Subjective Well-Being. Well-Being: The Foundations of Hedonic Psychology. Kahneman, Diener and Schwarz. New York: Russell Sage Foundation: 434–450.
EESC. 2008. Opinion of the EESC on Beyond GDP—Measurements for Sustainable Development. Brussels: European Economic and Social Committee.
England, R. W. 1998. Measurement of social well-being: alternatives to gross domestic product. Ecological Economics 25: 89–103.
Environment Commission. 2007. Summary notes from the Beyond GDP confer-ence: Highlights from the presentations and the discussion. Beyond GDP: Measur-ing Progress, True Wealth, and the Well-beMeasur-ing of Nations, Brussels: European Commission.
Fox, J. 2008. Don’t Ditch the GDP. Time Magazine. April 10.
Goossens, Y., A. Mäkipää, et al. 2007. Alternative Progress Indicators to Gross Domes-tic Product (GDP) as a Means Towards Sustainable Development. Brussels: Euro-pean Parliament, Policy Department A: Economic and Scientific Policy.
Hails, C. (ed). 2006. Living Planet Report 2006. Gland, Switzerland: World Wildlife Fund for Nature.
Hamilton, K., G. Ruta, et al. 2006. Where Is the Wealth of Nations? Measuring Capi-tal for the 21st Century. Washington, DC: The World Bank.
Henderson, H., J. Lickerman, et al. 2000. Calvert-Henderson Quality of Life Indicators: A New Tool for Assessing National Trends. Bethesda, Maryland: Calvert Group.