,19(67,*$7,1*7+(,03$&72),17(5$&7,9($33/(7621678'(176¶ UNDERSTANDING OF PARAMETER CHANGES TO PARENT FUNCTIONS: AN
EXPLANATORY MIXED METHODS STUDY
___________________________________ DISSERTATION
___________________________________
A dissertation submitted in partial fulfillment of the requirements for the degree of Doctor of Philosophy in the
College of Education at the University of Kentucky
By
Robin Rudd McClaran Lexington, KY
Co-Directors: Dr. Margaret J. Mohr-Schroeder, Associate Professor of Mathematics Education
and Dr. Carl W. Lee, Professor of Mathematics Lexington, KY
ABSTRACT OF DISSERTATION
,19(67,*$7,1*7+(,03$&72),17(5$&7,9($33/(7621678'(176¶ UNDERSTANDING OF PARAMETER CHANGES TO PARENT FUNCTIONS: AN
EXPLANATORY MIXED METHODS STUDY
The technology principle in the Principles and Standards for School Mathematics (NCTM, 2000) states that technology plays an important role in how teachers teach mathematics and in how students learn mathematics. The purpose of this sequential explanatory mixed methods study was to examine the impact of interactive applets on VWXGHQWV¶XQGHUVWDQGLQJRISDUDPHWHUFKDQJHVWRSDUHQWIXQFWLRQV6WXGHQWVLQWKH
treatment classes were found to have statistically significantly higher posttest scores than students in the control classes. Although the data analysis showed a statistically
significant difference between classes on procedural understanding, no statistically significant difference was found with regard to conceptual understanding. Student and teacher interviews provided insight on how and why the use of applets helped or hindered VWXGHQWV¶XQGHUVWDQGLQJRISDUDPHWHUFKDQJHVWRSDUHQWIXQFWLRQV
KEYWORDS: Technology, Mathematics Education, Procedural Understanding, Conceptual Understanding, Algebra
Robin Rudd McClaran
,19(67,*$7,1*7+(,03$&72),17(5$&7,9($33/(7621678'(176¶ UNDERSTANDING OF PARAMETER CHANGES TO PARENT FUNCTIONS: AN
EXPLANATORY MIXED METHODS STUDY
By
Robin Rudd McClaran
Margaret Mohr-Schroeder, Ph.D. Co-Director of Dissertation
Carl Lee, Ph.D.
Co-Director of Dissertation
Robert Shapiro, Ph.D. Director of Graduate Studies
I would like to dedicate this dissertation to the most important people in my life ± my husband, my mother and daddy, and my brother. Your love, support, and encouragement
iii
ACKNOWLEDGMENTS
Thank you to my committee ± Dr. Margaret Mohr-Schroeder, Dr. Carl Lee, Dr. Michael Mays, and Dr. Kelly Bradley ± for agreeing to serve, for asking questions that made me think more deeply about my study, and for all your support and guidance. A special thank you to Dr. Mays for making the trip from West Virginia to be present at my defense. I also want to thank Dr. Mays for introducing me to applets and for inspiring me to find effective ways to use technology in the teaching and learning of mathematics.
Thank you to my co-chairs ± Dr. Schroeder and Dr. Lee ± for sharing your
expertise and time every week. I have learned so much from you throughout this process. Your support and encouragement ensured that not only would I end up with a good study but that I would also successfully defend my dissertation. Although I am thrilled to have defended, I will definitely miss working with you.
Thank you to everyone associated with ACCLAIM for opening up a whole new world of mathematics education to me. A special thank you to Dr. Vena Long and Dr. William Bush for all the work you did in making ACCLAIM possible for all of us. ACCLAIM not only made getting a PhD possible, ACCLAIM changed my life.
Thank you to my ACCLAIM study buddies ± Mona Birch, Tonja Hudson, Landrea Miriti, Cindy Carter, and Tiana Taylor ± for your friendship, encouragement, and support. From our study sessions each summer to our Saturday afternoon study sessions on Adobe Connect each fall and spring, I learned so much from each of you.
Thank you to Wayne Nirode for all the Sunday evening Skype meetings
throughout the dissertation process. Our meetings kept me focused and helped me to not feel so isolated. Thank you for being a great friend, for encouraging me, and for
continuing to meet with me online after you had defended your dissertation.
Thank you to Dean Harrison and ZeZe Soper for participating in my study and for encouraging your students to do their best. Your work made the difference in my study.
Thank you to Sandra Shirey for the prayers, the encouragement, and for helping me with my writing. Thank you for being such a wonderful friend.
Thank you to Faye Whitlow and Mary Ware for the prayers, the encouragement, DQGWKHWULSVWRWKH5DQJHUV¶JDPHV<RXKDYHQRLGHDKRZPXFKWKDWPHDQWWRPH throughout this process. Your friendship has always been a blessing to me.
Thank you to my brother, David Rudd, for always believing in me and
encouraging me. It means so much to me that you are so proud of my accomplishment. Thank you to my parents, Frankie and LaJuan Rudd, for always supporting me and encouraging me in all my endeavors. Throughout my life, you made sure I had whatever I needed to pursue my dreams. Thank you for all the sacrifices you made, and for teaching me how to live my life and go about my work. I could not have done this without you.
Thank you to my husband, Rutledge McClaran, for all the sacrifices you made to make this possible. Not many husbands who would agree to do all the cooking, cleaning, washing, and grocery shopping so their wife could focus on getting her doctorate. Six \HDUVDJR,DVNHG³&DQZHGRWKLV"´<RXDQVZHUHG³<HV´+HUHZHDUHVL[\HDUVODWHU and I have a PhD. Thank you IRUtaking this amazing journey with me. None of this would have been possible without you.
iv
TABLE OF CONTENTS
ACKNOWLEDGMENTS ... iii
LIST OF TABLES ... vii
LIST OF FIGURES ... viii
CHAPTER I: Introduction ... 1
Statement of the Problem ... 3
Purpose of the Study ... 4
Research Questions ... 5
Significance of the Study ... 5
Delimitations ... 6
Limitations ... 7
Assumptions ... 8
Definition of Terms... 8
Organization of the Study ... 9
Chapter II: REVIEW OF LITERATURE ... 10
Technology Used to Teach High School Mathematics ... 10
Calculators ... 11
Attitudes and Beliefs ... 11
Student Achievement and Understanding ... 12
Computer Software ... 14
Attitudes and Beliefs ... 14
Student Achievement and Understanding ... 15
Internet ... 16
Attitudes and Beliefs ... 17
Student Achievement and Understanding ... 19
Research on Teaching Transformations of Parent Functions ... 19
Advantages of Using Applets ... 22
Constructivism and Discovery Learning ... 22
Multiple Representations ... 23
Other Advantages... 25
Disadvantages of Using Applets ... 27
Conclusions ... 28
Chapter III: METHODOLOGY ... 30
Research Questions ... 30
Research Design... 31
Population and Sample ... 32
Technology Intervention ... 33
Instrumentation ... 34
v
Phase Two ... 36
Validity ... 37
Pilot Study ... 39
Data Collection Procedures ... 40
Phase One... 40
Phase Two ... 40
Scoring Rubric for Assessment Items ... 41
Data Analysis ... 42
Phase One... 42
Data Screening ... 42
Descriptive Statistics ... 42
Assumptions ... 43
Phase Two ... 44
Selection of Interview Participants ... 44
Transcribing and Coding Interview Data ... 44
Research Bias ... 48
Chapter IV: RESULTS ... 50
Results ... 50
First Research Question ... 50
Second Research Question ... 60
Third Research Question... 63
Additional Findings ... 65
Summary of Results ... 67
Chapter V: DISCUSSION, CONCLUSIONS, AND IMPLICATIONS ... 69
Discussion of Results ... 69
Overall Impact ... 69
Conceptual Versus Procedural ... 70
Positive, Negative, and Nonexistent Impact ... 72
Beliefs and Attitudes ... 75
The Case of Mary... 76
Implementation and Utilization ... 80
Conclusions and Future Implications... 82
APPENDICES APPENDIX A: Pretest/Posttest - Parameter Changes to Parent Functions ... 87
APPENDIX B: Rubric for Pretest and Posttest ... 99
APPENDIX C: Parameter Changes to Parent Functions - Applet Activity #1... 100
APPENDIX D: Parameter Changes to Parent Functions - Applet Activity #2 .. 102
APPENDIX E: Semi-Structured Interview for Students ... 104
APPENDIX F: Semi-Structured Interview for Teachers ... 107
vi
vii
LIST OF TABLES
Table 3.1 Descriptive Statistics for Transformed Dependent Variables ...43 Table 4.1 ANCOVA on Transformed Posttest Scores with Transformed Pretest
Scores as Covariate ...51 Table 4.2 ANCOVA on Transformed Posttest Procedural Subscores with
Transformed Pretest Procedural Subscores as Covariate ...52 Table 4.3 ANCOVA on Transformed Posttest Conceptual Subscores with
viii
LIST OF FIGURES
Figure 3.1, Visual model of sequential explanatory mixed methods design adapted
From Designing and Conducting Mixed Methods Research ...32
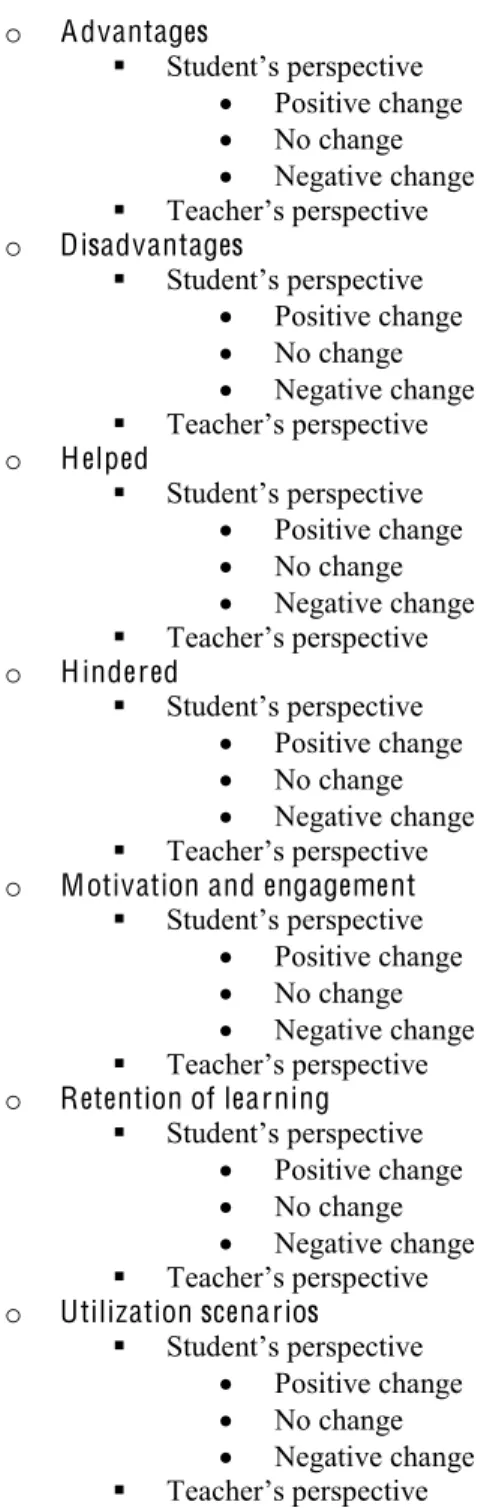
Figure 3.2, Hierarchy of nodes created by the researcher ...47
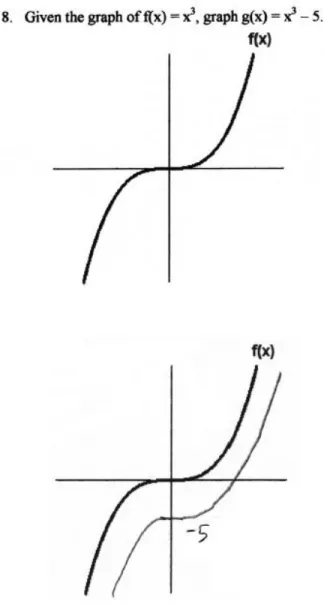
Figure 4.1, Part 2 #8 ...55
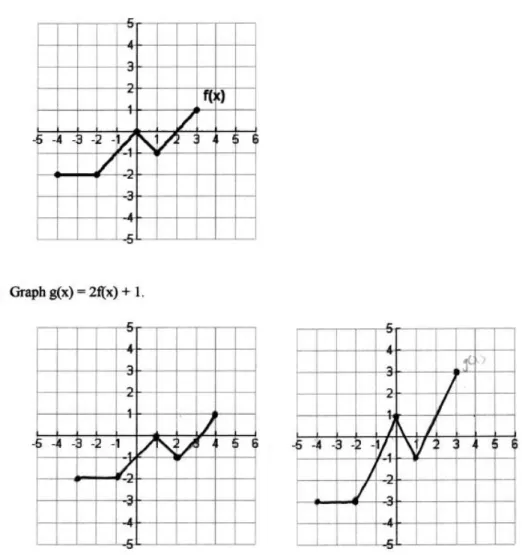
Figure 4.2, Part 2 #3 ...56
Figure 4.3, Part 1 #3 ...58
Figure 4.4, Part 2 #2 ...66
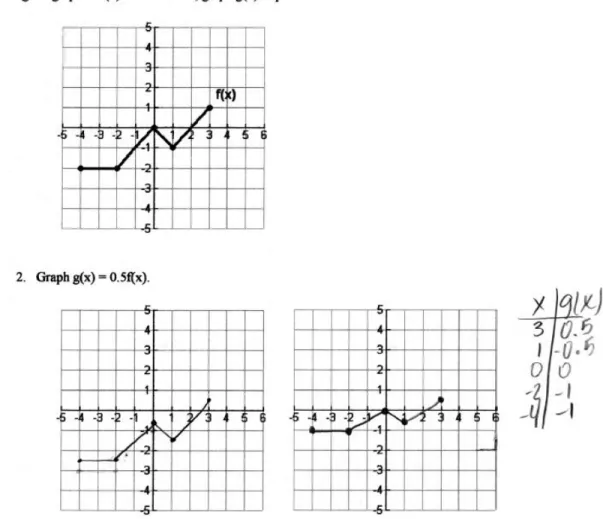
Figure 5.1, Part 2 #1 ...72
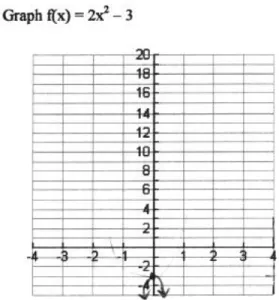
Figure 5.2, Part 1 #1 ...78
1
Chapter I: Introduction
The technology principle in the Principles and Standards for School Mathematics (National Council of Teachers of Mathematics, 2000) VWDWHV³7HFKQRORJ\LVHVVHQWLDOLQ teaching and learning mathematics; it influences the mathematics that is taught and HQKDQFHVVWXGHQWV¶XQGHUVWDQGLQJ´S7KHJRDORIHYHU\PDWKHPDWLFVWHDFKHULVWR enhancHWKHLUVWXGHQWV¶XQGHUVWDQGLQJRIPDWKHPDWLFV7KHXVHRIVLQJOHSXUSRVH applications such as interactive applets allows students to explore mathematical
SURSHUWLHVDQGUHODWLRQVKLSVLQZD\VWKDWFDQSRWHQWLDOO\HQKDQFHVWXGHQWV¶XQGHUVWDQGLQJ Single purpose applications have dynamically connected representations and
mathematical objects that students can manipulate. Single purpose applications assist students with visualization of concepts. Single purpose applications provide a setting in which students can discover mathematical properties and relationships on their own. In working with single purpose applications, students are actively engaged in learning and in constructing their own knowledge.
Other organizations have taken a stance on the role technology should play in teaching and learning mathematics. The International Society for Technology in (GXFDWLRQ¶V,67(1DWLRQDO(GXFDWLRQ7HFKQRORJ\6WDQGDUGVIRU7HDFKHUV1(76xT) has among its five standards one on teachers using their knowledge of content, pedagogy, DQGWHFKQRORJ\WR³IDFLOLWDWHH[SHULHQFHVWKDWDGYDQFHVWXGHQWOHDUQLQJ´DQGRQHRQ GHVLJQLQJDQGGHYHORSLQJOHDUQLQJH[SHULHQFHVWKDWXWLOL]HWHFKQRORJ\³WRSURPRWH VWXGHQWOHDUQLQJ´ISTE, 2008, p. 1).
2
VLQJOHSXUSRVHDSSOLFDWLRQV³WRH[SORUHDQGGHHSHQ WKHLUXQGHUVWDQGLQJRIFRQFHSWV´ (CCSSO, 2010, p.7). Although the state of Texas has not adopted the CCSSM, the Texas Education Agency (TEA) has technology application standards for teachers that include WKHDELOLW\WR³SODQRUJDQL]HGHOLYHUDQGHYDOXDte instruction for all students that LQFRUSRUDWHVWKHHIIHFWLYHXVHRIFXUUHQWWHFKQRORJ\´7($S
Calls have been made at the national and state level for technology to be used in the teaching and learning of mathematics as evidenced by the NCTM technology principle, the ISTE technology standards, the CCSSM standards for mathematical practice, and the TEA technology applications standards for teachers. The expectations have been set for teachers to use technology in the teaching and learning of mathematics. The critical question is, How can technology be used effectively in the teaching and learning of mathematics? This study attempts to address one aspect of this question.
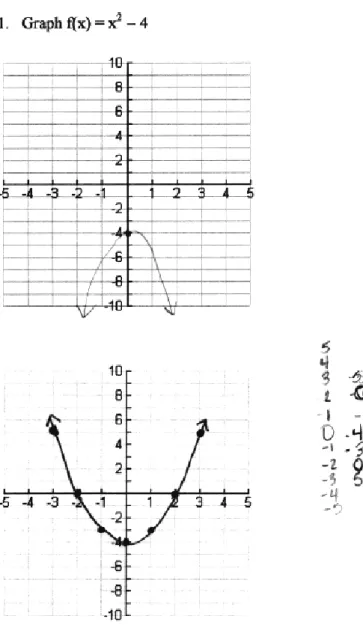
The content focus for this study is transformations of parent functions. In the Texas Essential Knowledge and Skills (TEKS) for Algebra I, students are expected to ³LQYHVWLJDWHGHVFULEHDQGSUHGLFW´WKHHIIHFWVRIFKDQJHVLQWKHSDUDPHWHUV a and c on the graph of y = ax2 + c (TEA, 2005, p. 42). In the TEKS for Algebra II, students are
H[SHFWHGWR³LQYHVWLJDWHGHVFULEHDQGSUHGLFW´WKHHIIHFWVRIFKDQJHVLQSDUDPHWHUVa, h,
3
conceptual understanding with the intent that students learn mathematics rather than having students continue the cycle of memorizing enough to pass tests without truly understanding the content (CCSSO, 2010).
Statement of the Problem
7KH1&70WHFKQRORJ\SULQFLSOHDOVRVWDWHV³:KHQWHFKQRORJLFDOWRROVDUH available, students can focus on decision making, reflection, reasoning, and problem VROYLQJ´1&70S)RUIDUWRRORQJVWXGHQWVKDYHSHUFHLYHGWKDWWKHIRFXVRI learning mathematics was memorizing formulas, rules, and procedures and getting correct numerical answers to problems. With technology, students can explore
mathematical relationships, reason mathematically about what they observe, and make sense of mathematical situations. In doing so, students have the opportunity to gain a true perspective of what learning mathematics is all about. Given the emphasis placed on using technology in the teaching and learning of mathematics as outlined in the 1&70¶V Principles and Standards of School Mathematics (2000) and the CCSSM, it is imperative
that the mathematics education community gain more insight into how technology can be used to positively impact student understanding.
4
examining why the impact was positive, negative, or non-existent the results cannot influence future development and implementation of technology for teaching mathematics.
Mathematics educators need to find ways to leverage the potential that technology has to offer by investigating the impact of technology in focused, specific ways so that educators gain a deeper understanding of what specific aspects of technology use have a positive effect as well as what aspects have a negative effect. The understanding gained from focused investigations, such as this research study, can then be parlayed into
changes in how technology is used on a much broader scale. Knowledge of effective uses will enable mathematics educators to develop and implement mathematics curriculum and instructional practices that continue to capitalize on the technology.
Purpose of the Study
5 Research Questions
This mixed methods study addressed the following research questions:
1. To what extent does the use of single purpose applications for teaching parameter FKDQJHVWRSDUHQWIXQFWLRQVLPSDFWDVWXGHQW¶VWUDQVLWLRQIURPSURFHGXUDO
understanding to conceptual understanding?
2. )URPWKHWHDFKHU¶VSHUVSHFWLYHto what extent does the use of single purpose applications impact DVWXGHQW¶VWUDQVLWLRQIURPSURFHGXUDOXQGHUVWDQGLQJWR
conceptual understanding of parameter changes to parent functions? To what does WKHWHDFKHUDWWULEXWHWKHVLQJOHSXUSRVHDSSOLFDWLRQVLPSDFWLQJVWXGHQWV¶WUDQVLWLRQ from procedural to conceptual understanding of parameter changes to parent functions?
3. )URPWKHVWXGHQW¶VSHUVSHFWLYHwhat additional insights on parameter changes to parent functions are gained by using a single purpose application? To what does the student attribute the single purpose applications providing additional insights on parameter changes to parent functions?
Significance of the Study
As stated previously, much of the research on using technology to teach
6
environment that promoted investigation, conjecturing, reasoning, and sense making. Although this study had a narrow focus, the results of this study provided valuable insight into effective and ineffective ways of using technology in the teaching and learning of mathematics. This knowledge of effective and ineffective ways to use technology to teach mathematics could pRWHQWLDOO\LPSDFWWHDFKHUV¶IXWXUHXVHRIWHFKQRORJ\RQD broader scale. As stated previously, the vision is that students have access to technology in their mathematics classes to promote learning through exploration facilitated by their teachers (NCTM, 2000).
Delimitations
Due to the nature of the study, the researcher believed the use of existing classes would best serve the purpose of the study ± to determine the impact that the use of single purpose applications such as interactive applets had on studHQWV¶XQGHUVWDQGLQJRI
parameter changes to parent functions. Although the use of random samples in
7 Limitations
Since it was not possible to test all high school Algebra 2 students in northeast Texas on all concepts related to functions, this study was limited to testing 97 students in two northeast Texas public high schools on parameter changes to parent functions. Although five high schools initially agreed to participate in the study, three schools declined when it was time to gather data for the first phase of the study. The reasons given by these schools for declining to participate included a change in campus leadership and the need to focus on meeting state assessment standards. This small sample size, along with the limited number of high schools choosing to participate, limits the generalizability of the findings.
Another limitation to the study involved the timing of events ± pretests, use of applet applications for treatment classes and instruction for control classes, posttests, and interviews. The two teachers participating in the study did not have computers in the classroom for students to use and had to schedule time in advance to go to the computer lab or get a laptop cart for their classes. This led to minor inconsistencies in time between pretests, guided explorations or instruction, and posttests between the two high schools. Specifically, there was a one-day difference between pretest and guided explorations or instruction for the two high schools, which led to a one-day difference in time from pretest to posttest for the two schools.
'XHWRWKHFRQVWUDLQWVRIWKHUHVHDUFKHU¶VFXUUHQWWHDFKLQJMREDORQJZLWKWKe need to interview students on two different campuses, the time between posttests and
8
while others were interviewed within three weeks of completing the posttest. These differences in times could not be controlled by the researcher and affected the qualitative data as evidenced by a few students needing to look over the applets and activities to be reminded of what they completed earlier. One other limitation to the study involved test-retest issues due not only to the time interval between ptest-retest and posttest but also to having the same questions on the pretest and posttest.
Assumptions
1. All student participants in the experimental classes actively participated in each guided exploration using the designated applet.
2. All student participants answered questions on the pretest and posttest to the best of their ability.
3. All student participants and participating teachers answered interview questions honestly.
Definition of Terms
The following definitions are provided for terms associated with this mixed methods study.
Applet: An application independent of the platform that is designed to perform a specific
task and run within another application such as a web browser (Boese, 2010). An applet is interactive and provides a means to capture user input that results in changes to the graphical, numerical, and algebraic content displayed on the applet. For this study, the applets were web-based.
Conceptual understanding8QGHUVWDQGLQJWKDWLVEDVHGRQKDYLQJDQ³LQWHJUDWHGDQG
9
UnderstandinJWKDWLVEDVHGRQNQRZLQJQRWRQO\³KRZWR´EXW³ZK\´%RVVH %DKU 2008).
Procedural understanding: Understanding that is based on knowing rules for solving
problems and how to perform step-by-step processes to get answers (Bosse & Bahr, 2008; Hiebert & Lefevre, 1986).
Single purpose application: A technology application, such as an interactive applet, that
was developed with a particular instructional focus and provides students the capability to manipulate the mathematical objects built into the applet without being able to edit the content.
O rganization of the Study
The study is organized into five chapters. Chapter 1 provides an introduction to the study including the statement of the problem, the purpose, and the significance of the study along with the research questions. Chapter 2 provides a review of literature relevant to the study. Chapter 3 provides a description of the research design and the methodology for conducting the research. Chapter 4 provides an explanation of the data analyses and the results. Chapter 5 provides a discussion of conclusions drawn by the researcher and recommendation for future research along with implications for future technology implementation in mathematics classrooms.
10
Chapter II: Review of Literature
Schools have been inundated with technology. Many believe technology is the answer to any educational problem that needs to be addressed. So often teachers are given technology with no research-based plan for how to effectively use the technology to impact their instruction and their studentV¶ learning. Mathematics educators need to continually examine how the technology affects the curriculum, how it changes the learning goals, and how it impacts instruction and the learning experiences for students. As such, it is important to find research-based ways to effectively use technology to teach mathematics. Knowledge of effective uses of technology in the mathematics classroom will enable mathematics educators to develop and implement the mathematics curriculum and instructional practices that continue to capitalize on the technology.
In a systematic review of the literature on integrating instructional technology in teaching mathematics, Ronau, Rakes, Niess, Wagener, Pugalee, Browning, Driskell, and Mathews (2010) found a low percentage of research studies, and most of these studies were qualitative studies. Some of the research studies found were quantitative studies, but very few were mixed methods studies (Ronau et al., 2010). Ronau et al. (2010) also identified potential gaps that existed in the literature, and this included research on the use of online technology such as interactive applets.
Technology Used to Teach High School Mathematics
Rakes and Ronau (2010) defined edXFDWLRQDOWHFKQRORJ\DV³GLJLWDOWRROVXVHGIRU WHDFKLQJ´DQGWKHVHWRROVLQFOXGHFDOFXODWRUVFRPSXWHUVRIWZDUHDQGWKHLQWHUQHW According to Rakes and Ronau (2010), graphing calculators are the main type of
11
high school mathematics included dynamic geometry and algebraic software as well as graphing software, and internet-based tools included virtual manipulatives and online applets (Rakes & Ronau, 2010).
Calculators. The use of graphing calculators (CAS and non-CAS) in high school
mathematics classes is widespread (Forster, 2004). CAS graphing calculators utilize a computer algebra system (CAS) to produce symbolic results (Texas Instruments, 2013). CAS and non-CAS graphing calculators are currently allowed on national assessments including Preliminary Scholastic Aptitude Test (PSAT), Scholastic Aptitude Test (SAT), Advanced Placement (Calculus, Statistics, Chemistry, Physics), and Praxis, but American College Testing (ACT) only allows the use of non-CAS graphing calculators (Texas Instruments, 2012). CAS and non-CAS graphing calculators are currently permitted to be used on a majority of stateV¶ assessments (Texas Instruments, 2012). It is not evident that graphing calculators (CAS and non-CAS) are used regularly in mathematics classes in states that allow graphing calculators to be used on their assessments.
Attitudes and Beliefs. The use of graphing calculators in high school
12
Student Achievement and Understanding. The use of graphing calculators in
high school mathematics classes has been shown not only to have a positive effect on VWXGHQWV¶DFKLHYHPHQWDQG understanding but has also been shown to have little or no effect (Burrill, Allison, Breaux, Kastberg, Leatham, & Sanchez, 2002; Ellington, 2003). In a study comparing algebra classes using a reform curriculum that incorporated graphing calculators to traditional algebra classes that did not incorporate graphing calculators, Thompson and Senk (2001) found that students in the reform algebra classes performed significantly better than students in the traditional classes. Although the results of this study are positive, Thompson and Senk (2001) noted that it was not possible to attribute the difference solely to the use of graphing calculators since the classes also utilized a different curriculum. In another study investigating the impact of graphing calculators on student achievement in algebra, Currie (2006) found that students who used a graphing calculator in their algebra class significantly outperformed students that did not use a graphing calculator. However, Hatem (2010) found that the use of graphing calculators in college algebra and pre-calculus classes did not improve student
achievement.
13
problem or apply what they knew to a new situation than students who did not use graphing calculators.
The use of graphing calculators has been shown to improve stXGHQWV¶DELOLW\WR symbolically represent function (Ruthven, 1990; Schwarz & Hershkowitz, 1999). In a study involving students in precalculus-level courses, Ruthven (1990) found that students who used graphing calculators scored higher on test items that required students to write an equation given the graph than students who did not use graphing calculators. No significant difference was found on items requiring students to answer questions about a given graph (Ruthven, 1990).
Hollar and Norwood (1999) examined the impact of graphing calculators in an intermediate college algebra course and found that students who used graphing
calculators not only performed better than students who did not use graphing calculators but were also more apt to examine functions from different perspectives. No difference was found between students who used graphing calculators and those who did not use graphing calculators on paper and pencil algebraic manipulations (Hollar & Norwood, 1999). In a similar study investigating the potential benefits of graphing calculators, Ford (2008) concluded that students who used graphing calculators had higher test scores and were more adept at using graphical and numerical representations to solve problems than students who did not use graphing calculators.
14
concluded that when calculators were used for instruction and testing, K-12 students improved ³in operational skill as well as paper-and-pencil skills and the skills necessary IRUXQGHUVWDQGLQJPDWKHPDWLFDOFRQFHSWV´(p. 456) although when calculators were used for instruction only students improved in operational skill.
Computer Software. Dynamic mathematical software used in teaching high VFKRROPDWKHPDWLFVLQFOXGHV*HRPHWHU¶V6NHWFKSDG*HR*HEUDDQG7,±Interactive. With dynamic mathematical software students can explore mathematics by constructing and manipulating objects, exploring patterns and relationships, and making and testing conjectures (Hollebrands, 2007). Thus, dynamic mathematical software provides an environment where students can discover mathematical properties and relationship on their own. The dynamic software enables students to generate many variations of a concrete model, which allows students to move to the abstract representation and generalize their findings (Wiest, 2001).
Attitudes and Beliefs. Several studies IRFXVRQWHDFKHUV¶DQGVWXGHQWV¶DWWLWXGHV
concerning the use of computer technology for teaching and learning mathematics. 6WXGHQWV¶SHUFHSWLRQVDERXWWHDFKHUVXVLQJWHFKQRORJ\WRWHDFKPDWKHPDWLFVZHUH
generally positive (Drickey, 2006; Hannafin, Burress, & Little, 2001; Mohd, Suncheleev, Shitan, & Mustafa, 2008). Hannafin et al., (2001) concluded that students believed the use of dynamic software made learning mathematics more enjoyable and more
15
Gadowsky conducted a study on the meanings students construct when exploring function transformations with graphing software. Gadowsky (2001) reported the majority of students felt the investigative process of exploring function transformations using graphing software was a positive experience for them and that learning on their own through investigation was more beneficial. Although participants were initially apprehensive about participating in a technology-based exploration, participants successfully navigated through the exploration and commented positively about their exploratory learning experiences (Gadowsky, 2001).
Teachers are highly supportive of using technology, especially mathematical software and web-based curricula, to teach mathematics (Al-$¶DOL+DQQDILQHWDO 2001). Although most teachers see the benefit of computer technology in mathematics classrooms, some teachers believe that the computer is best used for drill and practice rather than as a tool for exploration and questioned the long-term understanding gained by students exploring mathematical properties using dynamic software (Hannafin et al., 2001).
16
examining the impact that the implementation of mathematical software had on statewide benchmark scores, King (2004) found that scores improved for low performing
elementary school students in Tennessee that used this software. Using computers to help students solve problems requiring critical thinking and analysis rather than using
computers for drill and practice produced greater benefits for students (Wenglinsky, 2005). As Jones (2002) pointed out, though, when using computer software in the mathematics classroom, it is difficult to determine whether the measured learning gains were a direct result of using technology.
Internet. In their systematic review of the literature on technology integration in mathematics, Ronau et al. (2010) included virtual manipulatives, web-based courses and curriculum, and online applets as internet-based tools for teaching mathematics.
According to Moyer, Bolyard, and Spikell (2002)DYLUWXDOPDQLSXODWLYHLV³DQ interactive, web-based visual representation of a dynamic object that presents
17
found at several websites including the National Library of Virtual Manipulatives website (nlvm.usu.edu), and 1&70¶V,OOXPLQDWLRQVZHEVLWHLOOXPLQDWLRQVQFWPRUJ.
Web-based curricula such as Agilemind, offer teachers and students constant access to secondary mathematics content from Algebra 1 to Calculus. With web-based curricula such as Agilemind, teachers and students have access to teaching tools including topic introductions, in-depth explorations, formative and summative
assessments along with a way for teachers and students to track progress (Agilemind, 2012). Teachers can use web-based curricula to teach content with animations,
simulations, in-depth explorations, and discovery learning activities (Agilemind, 2012). Students can use web-based services to preview and review content as well as to assess their level of understanding (Agilemind, 2012).
Online applets can be defined as interactive, web-based dynamic representations that provide opportunities for exploring mathematics in much the same way that Moyer et al. (2002) defined virtual manipulatives. The difference is online applets are not modeled after concrete manipulatives. Online applets are typically designed with multiple
representations and one instructional focus. In the case of this study, the online applets were designed to teach parameter changes to parent functions. Online applets can be found on the National Library of Virtual Manipulatives website (nlvm.usu.edu), 1&70¶V Illuminations website (illuminatLRQVQFWPRUJ6KRGRU¶V,QWHUDFWLYDWHwebsite
(www.shodor.org/interactivate), *HR*HEUD¶VZHEVLWH(www.geogebra.com), and ([SORUH/HDUQLQJ¶Vwebsite (www.explorelearning.com).
Attitudes and Beliefs. In a VWXG\LQYHVWLJDWLQJVWXGHQWV¶DWWLWXGHVDQGEHOLHIV
18
and Braziel (2005) concluded students wanted and needed ³DOWHUQDWLYHIRUPDWVIRU OHDUQLQJ´DQGLQWHUQHW-based tools such as interactive applets provided an alternative to traditional ways of learning mathematics. Students believed the use of internet-based applets provided visual representations that helped them understand the mathematics (Heath, 2002; Pyzdrowski & Pyzdrowski, 2009). Also, students thought that not only did the use of virtual manipulatives assist them in learning, but that they were easy to use and made their learning experience enjoyable (Reimer & Moyer, 2005).
Many teachers maintained that virtual manipulatives or interactive applets should EHXVHG³GXULQJWKHFRUHSDUWRIWKHLQVWUXFWLRQDOVHTXHQFHLQWKHOHVVRQIRUVWXGHQW LQYHVWLJDWLRQDQGVNLOOVROLGLILFDWLRQ´UDWKer than merely being an add-on to the lesson (Moyer-Packenham, Salkind, & Bolyard, 2008, p. 209). While many educators believed WHFKQRORJ\XVHLQFUHDVHVVWXGHQWV¶DELOLW\WROHDUQPDWKHPDWLFDOFRQFHSWVWKH\DOVR thought that in some cases using technology can have a negative effect on learning (Heath, 2002; Sedig, Klawe, & Westrom, 2001). If students must contend with learning how to use a mathematical software package while trying to learn mathematical content, it is possible that learning to use the technology could be the focus for students rather than learning the mathematics. Heath (2002) suggested that the use of applets would PLQLPL]HWKHSRVVLEOHQHJDWLYHHIIHFWVLQFHDSSOHWV³HTXLSVWXGHQWVZLWKWRROVWR
LPPHGLDWHO\IRFXVRQFRQFHSWV´S:LWKthe use of single purpose applications, such as interactive applets, the focus is on learning mathematics and not on learning how to use the technology.
19
technology into the existing curriculum (Demetrius & Barbas, 2002; Pelgrum, 2001). According to Cuban (2001), although computers were readily available at most schools, they were not being used much by mathematics teachers. Computers were mainly used for demonstrations as well as drill and practice (Guerrero, Walker, & Dugdale, 2004). The reason that many teachers gave for not utilizing computers in the mathematics classroom was that the use RIFRPSXWHUVWRRN³DZD\IURPUHDOOHDUQLQJ´/L
Student Achievement and Understanding. Internet-based classroom technology includes online curriculum and course support services such as Agilemind. Gorman et al. (2008) measured the impact of Agilemind as a teaching and learning tool in high school mathematics by comparing school districts using Agilemind to similar districts not using Agilemind. State assessment scores were gathered for over 5500 students over a three-year period. The results were inconclusive, and the researchers noted that a critical issue in the study was low usage rates for schools using Agilemind (Gorman et al., 2008).
Virtual manipulatives and applets are also included in internet-based classroom technology. Reimer and Moyer (2005) reported that the use of virtual manipulatives led WRLPSURYHPHQWLQVWXGHQWV¶WHVWVFRUHVRQFRQFHSWXDONQRZOHGJH6WXGHQWVXVLQJERWK physical and virtual manipulatives showed more improvement from pretest to posttest than students using only one type of manipulative (Takahashi, 2002; Terry, 1995). Many believe for applet use to be most beneficial, applets must be used in a constructivist teaching/learning environment (Zhou et al., 2005).
Research on Teaching Transformations of Parent Functions
20
shrinking ± more difficult than vertical transformations (Baker, Hemenway, & Trigueros, 2000; Borba & Confrey, 1996; Eisenberg & Dreyfus, 1994; Kimari, 2008). Students had greater difficulty visualizing a horizontal translation than a vertical translation (Eisenberg 'UH\IXV:KHQDVNHGWRH[SODLQWKH³FRXQWHULQWXLWLYHEHKDYLRU´RIKRUizontal translations, students responded with memorized rules or generalizations from observed patterns (Zazkis, Liljedahl, & Gadowsky, 2003, p. 441).
$QRWKHUFRPPRQILQGLQJLQVWXGLHVRIVWXGHQWV¶XQGHUVWDQGLQJRIWUDQVIRUPDWLRQV of functions is that students have memorized rules for transformations (Kimani, 2008; Ninness, Rumph, McCuller, Vasquez, Harrison, Ford, Capt, Ninness, and Bradfield, 2005; Zazkis et al., 2003). According to Zazkis et al. (2003), students memorized rules for vertical and horizontal translations and were more concerned with remembering the rules than with understanding the behavior. Zazkis et al. (2003) found that the majority of WHDFKHUVZKRZHUHLQWHUYLHZHGIRUWKHLUVWXG\UHIHUUHGWRD³UXOHIRUKRUL]RQWDO
WUDQVODWLRQV´ZKHQDsked how they explained the counterintuitive behavior of horizontal WUDQVODWLRQVWRVWXGHQWVS6WXGHQWV¶UHOLDQFHRQPHPRUL]HGUXOHVRUSURFHGXUHV when answering questions regarding transformations of functions led Kimani (2008) to FRQFOXGHWKDW³Vtudents do not have a conceptual understanding of function
WUDQVIRUPDWLRQV´S
21
negative constant outside parentheses results in a vertical shift downward, subtracting a positive constant inside parentheses results in a horizontal shift right, and subtracting a negative constant inside parentheses results in a horizontal shift left (Ninness et al., 2005). The conclusion was that students were able to paraphrase rules for transformations of functions but that knowing the rules may not be sufficient for correctly applying them (Ninness et al., 2005). Some students were able to apply rules to graph functions with a single transformation but had difficulty applying rules to graph functions with multiple transformations (Ninness et al., 2005).
Gadowsky (2001) conducted a study where participants used graphing software to investigate the relationship between the algebraic and graphical representations of
quadratic functions. The focus of the study was to determine the extent to which participants made generalizations about function transformations. According to
Gadowsky (2001), technology-based explorations of transformations of functions helped VWXGHQWV³FRQFHSWXDOL]HDQGFRQVWUXFWPDWKHPDWLFDOPHDQLQJDERXWIXQFWLRQ
WUDQVIRUPDWLRQV´ (p. 110) and helped students make connections between algebraic and graphical representations.
Gadowsky (2001) also noted that students presented these connections among representations as observations of patterns rather than by providing mathematical justification for these connections. SWXGHQWVZHUHQRWLQFOLQHGWRWKLQNDERXW³ZK\D particular algebraic alteration of the equation affected the graphical output in a particular ZD\´Gadowsky, 2001, p. 80). All participants in the study were able to identify
22
(Gadowsky, 2001). However, this understanding of transformations of quadratic functions did not carry over to transformations of the parent absolute value function as evidenced by the inability of all participants to identify a vertical translation of the absolute value function (Gadowsky, 2001).
Advantages of Using Applets
Constructivism and Discovery Learning. Discovery learning activities using single purpose applications such as interactive applets align with the constructivist way of teaching. The basic premise of constructivism is that students actively create their own knowledge (Van de Walle, 1999). Essential to constructing new knowledge is the active engagement of students in the learning process and the use of existing knowledge to give meaning to new ideas they are developing (Inch, 2002). The connection between existing knowledge and new knowledge results in the development of a cognitive schema of related ideas, which leads to greater understanding by students (Van de Walle, 1999). Manipulating representations in a single purpose application should assist students with schema construction, and it is through the construction and automation of schema that students develop expertise (Van Merriënboer & Ayers, 2005). Students who do not connect new knowledge to existing knowledge have an overabundance of unrelated ideas rather than a cognitive network of related ideas.
Discovery learning activities using single purpose applications engage students in the learning process and provide an arena in which students can think and communicate mathematically as well as make and test conjectures. The dynamically linked
23
teacher guidance so that students can use the single purpose application to reach the desired results (Bos, 2009). Care must be taken when developing handouts since providing too much guidance in discovery learning activities has been shown to be detrimental to sWXGHQWV¶ODWHUXVHRIVXSSRVHG gained knowledge (Kirschner, Sweller, & Clark, 2006).
Current theories on learning mathematics state that mathematical knowledge must be constructed by students as they attempt to make sense of mathematical situations and identify patterns (Battista, 2001). Single purpose applications efficiently facilitate structured mathematical reasoning and sense-making endeavors that allow students to make conjectures and then test their ideas (Wiest, 2001). This structure enables students of all mathematical ability levels to manage their exploration and learning. Once students have discovered a mathematical property or relationship on their own using single
purpose applications, students have a basis for a more formal consideration of the mathematics (Rubin, 1999).
Multiple Representations. A mathematical representation is a representation that includes verbal, concrete, numerical, graphical, pictorial, or symbolic components (Piez & Voxman, 1997; TEA, 2005). Stated concisely, a mathematical representation is a graphical, numerical, algebraic, or analytical representation. According to Tripathi DPDWKHPDWLFDOUHSUHVHQWDWLRQLVD³PHQWDORU physical construct that describes aspects of the inherent structure of a concept and the interrelationships between the FRQFHSWDQGRWKHULGHDV´S
24
multiple representations in teaching mathematics was appropriate. Then it shifted to finding ways multiple representations could be used to teach specific mathematics concepts. The research on multiple representations in recent years has focused more on visual representations than any other representation (Tripathi, 2008). According to Arcavi (2003) visualization accompanies symbolic development and is an essential component in reasoning and problem solving. Stylianou and Silver (2004) examined the similarities and differences in the use of visual representations in problem solving by expert and novice mathematicians and found that although both experts and novices perceived visual representations as an important part of problem solving, experts used the visual representations more frequently and on a wider variety of problems.
Mathematics is not a disjoint set of concepts to be learned or skills to be mastered. Mathematical concepts are interconnected through a variety of relationships, and learning a concept entails not just knowing the meaning of the concept but also of understanding the relationships that connect this concept to others. Multiple representations can be a powerful tooOLQIDFLOLWDWLQJVWXGHQWV¶XQGHUVWDQGLQJRIPDWKHPDWLFDOFRQFHSWVHVSHFLDOO\ when connections are made between the representations (NCTM, 2000). As stated in the Principles and Standards for School Mathematics³5HSUHVHQWDWLRQVVKRXOGEHWUHDWHGDV
essenWLDOHOHPHQWVLQVXSSRUWLQJVWXGHQWV¶XQGHUVWDQGLQJRIPDWKHPDWLFDOFRQFHSWVDQG UHODWLRQVKLSVDQGLQUHFRJQL]LQJFRQQHFWLRQVDPRQJUHODWHGPDWKHPDWLFDOFRQFHSWV´ (NCTM, 2000, p. 67).
Further, the NCTM (2000) articulated in the Principles and Standards for School Mathematics³'LIIHUHQWUHSUHVHQWDWLRQVVXSSRUWGLIIHUHQWZD\VRIWKLQNLQJDERXWDQG
25
WKDWVWXGHQWV¶FRQFHSWXDOXQGHUVWDQGLQJLVHQKDQFHGE\YLVXDOizations, they contend that students construct very different visual representations on their own leading to different understandings of the concept. Therefore, it is critical that teachers provide appropriate visual representations for students that would lead to an understanding of the concept (Aspinwall & Shaw, 20020). According to Piez and Voxman (1997), as technology becomes more available in the classroom the use of multiple representations, particularly numerical, graphical, and analytical representations to teach concepts will increase, and teachers will need to develop activities using multiple representations so that students gain flexibility in problem solving. Erbas, Ledford, Polly, and Orrill (2004) state that technology plays an important role in allowing students to explore multiple
representations and the connections between those representations; and when supported by the teacher, students can use technology to investigate properties and relationships, explore, test conjectures, and make generalizations.
Other Advantages. The critical first step in teaching is to engage students. Investigations using single purpose applications such as interactive applets engage students in learning (Hannafin, 2004). Investigations are structured so students do not struggle with how to start the investigation or with what to do next. Most students find this type of learning experience not only engaging but also enjoyable (Rochowicz, 1996). The ease of use of single purpose applications enables students to focus on the
mathematics rather than the technology; thus, students focus on mathematical reasoning and sense making rather than on operating the technology (Battista, 2001).
26
2009). Single purpose applications have interactive mathematics objects, use multiple representations, and allow students to manipulate the objects and representations so that patterns are observed and conjectures are made and tested (Bos, 2009; Cavanaugh, Gillan, Bosnick, Hess, & Scott, 2008; Connell, 2001). When mathematical concepts are taught to a deep level of understanding, the concepts are retained by students and can be used as the foundation for understanding other concepts (Sfard, 1991). Also, with the multiple representations provided by single purpose applications, difficult abstract concepts are made more concrete which is the first step to better conceptual understanding (Bos, 2009).
Students who have difficulty understanding the mathematics respond at times by disengaging from the learning process. The use of single purpose applications, though, makes certain mathematical topics more accessible to students by relieving students of many of the computations and symbolic manipulations they struggle with and extends the ability to visualize the mathematics to a much broader audience (Rubin, 1999; Wiest, 2001). As the single purpose application performs computations and symbolic
manipulations that act as barriers to mathematical exploration for many students,
VWXGHQWV¶FRJQLWLYHORDGLVUHGXFHGDOORZLQJVWXGHQWVWRIRFXVRQH[SORULQJPDWKHPDWLFDO concepts and relationships (Wiest, 2001).
Another advantage of using single purpose applications such as interactive applets WRWHDFKPDWKHPDWLFVUHODWHVWRVWXGHQWV¶SHUFHSWLRQVDQGEHOLHIVDERXWOHDUQLQJ
mathematics. Single purpose applications enable students to experience learning
27
investigation and problem solving (Bos, 2009). When students are given the opportunity to explore a mathematical concept as well as make and test conjectures, they experience firsthand what learning mathematics encompasses. Also, the use of single purpose applications gives students access to mathematical topics once thought beyond their capabilities (Rubin, 1999).
Disadvantages of Using Applets
7KHIRFXVHGH[SORUDWLRQWKDWGHILQHVVLQJOHSXUSRVHDSSOLFDWLRQVOLPLWVVWXGHQWV¶ ability to explore ideas outside of the focus. With single purpose applications students are limited to the instructional focus built into the applet. Students can explore only aspects of the topic that are built into the application. This characteristic is an advantage with respect to providing a structured focus for students, but at the same time it is a
GLVDGYDQWDJHZLWKUHVSHFWWRVWXGHQWV¶DELOLW\WRIUHHO\H[SORUHRWKHr aspects of the topic or other topics altogether.
There are ways to deal with the disadvantages associated with limited exploration. One possible solution is to broaden the exploration possible with the applet while
28 Conclusions
Although many mathematics educators believe technology enhances mathematics teaching and learning, more research is needed not only to determine the impact
WHFKQRORJ\KDVRQVWXGHQWV¶XQGHUVWDQGLQJEXWDOVRWRIXUWKHULQYHVWLJDWHVSHFLILFDOO\KRZ and why the technology had an impact. The assumption that the use of technology to WHDFKPDWKHPDWLFVLVEHQHILFLDOWRVWXGHQWVHQKDQFHVVWXGHQWV¶XQGHUVWDQGLQg of mathematics, and increases student achievement needs more thorough investigation.
Past studies need to be replicated to build on the consistency of the findings. This may be challenging, however, due to the ever-changing state of technology. As the technology evolves, the methods for using the technology to teach mathematics will evolve. Studies to determine the most effective ways to harness the potential for new technology are greatly needed. Methods of using technology to teach mathematics will have to change to mirror the changes in technology. Researchers can utilize the
knowledge from the past to narrow the search for effective methods. Schools will continue to invest in computer technology for the mathematics classroom because it is present in nearly every facet of society. As such, teachers will need guidance on how to effectively use technology to teach mathematics and potentially impact student learning.
29
learning mathematics but also to positively impact their understanding of mathematics. Mathematics educators must continue to examine current practices for teaching
mathematics with technology to determine its effectiveness and to explore new ways to harness the potential that it brings as an instructional and learning tool.
30
Chapter III: Methodology
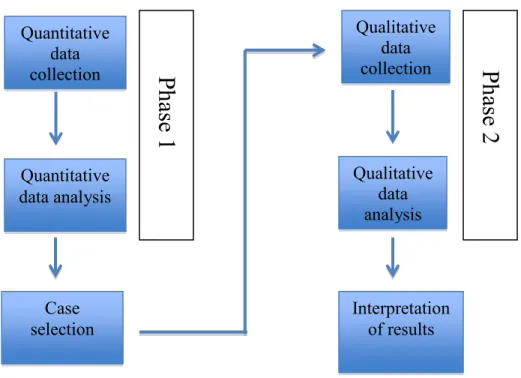
The purpose of this mixed methods study was to explain the effects of using single purpose applications, such as interactive applets, to teach parameter changes to parent functions. This study utilized an explanatory sequential mixed methods research design that begins with quantitative data collection and analysis followed by qualitative data collection and analysis (Creswell & Plano Clark, 2011). The quantitative phase of the study focused on examining the impact ± positive, negative, or nonexistent - the use RIVLQJOHSXUSRVHDSSOLFDWLRQVKDGRQVWXGHQWV¶FRQFHSWXDOXQGHUVWDQGLQJ, while the qualitative phase focused on LQYHVWLJDWLQJVWXGHQWV¶DQGWHDFKHUV¶EHOLHIVUHJDUGLQJKRZ and why the use of technology had the respective impact. The qualitative phase of this VWXG\ZDVLPSOHPHQWHGIRUWKH³SXUSRVHRIH[SODLQLQJWKHLQLWLDOUHVXOWVPRUHLQGHSWK´ (Creswell & Plano Clark, 2011, p. 82).
The researcher believes that if the mathematics education community is to harness the potential technology has to offer as a teaching and learning tool it must continue to examine not only what the impact of using technology is but also why. Regardless of the quantitative results ± positive, negative, or nonexistent impact - by having the qualitative follow-up, the researcher gained a deeper understanding of effective and ineffective ways technology can be used in the teaching and learning of mathematics.
Research Questions
This mixed methods study addressed the following research questions:
1. To what extent does the use of single purpose applications for teaching parameter FKDQJHVWRSDUHQWIXQFWLRQVLPSDFWDVWXGHQW¶VWUDQVLWLRQIURPSURFHGXUDO
31
2. )URPWKHWHDFKHU¶VSHUVSHFWLYHto what extent does the use of single purpose applications impact DVWXGHQW¶VWUDQVLWLRQIURPSURFHGXUDOXQGHUVWDQGLQJWR
conceptual understanding of parameter changes to parent functions? To what does the teacher attribute the single purpose applications imSDFWLQJVWXGHQWV¶WUDQVLWLRQ from procedural to conceptual understanding of parameter changes to parent functions?
3. )URPWKHVWXGHQW¶VSHUVSHFWLYHwhat additional insights on parameter changes to parent functions are gained by using a single purpose application? To what does the student attribute the single purpose applications providing additional insights on parameter changes to parent functions?
Research Design
Tashakkori and Teddlie (2006) define mixed methods research as research in which data is collected, data is analyzed, findings are merged, and inferences are drawn using both quantitative and qualitative methods in one study. The basic assumption in the definition of mixed methods studies is that the combination of both quantitative and qualitative research will enable the researcher to have a better understanding of the research problem than is possible with either research method alone (Creswell & Plano-Clark, 2007; Tashakkori & Teddlie, 2003). This study utilized the explanatory sequential mixed methods research design (see Figure 3.1).
32
single purpose applications. The qualitative data included teacher and student interviews that were analyzed to determine specifically how and why the use of single purpose applications assisted, hindered, or had no effect on WKHVWXGHQW¶VWUDQVLWLRQIURP
procedural to conceptual understanding. The qualitative results were used to explain the quantitative results and together the two provided a better understanding of not only what was happening but also why it was happening than either could provide alone (Creswell, 2008).
Population and Sample
This study included participants from two public high schools in northeast Texas. One Algebra 2 teacher at each high school along with students in their respective Algebra 2 classes, six at one high school and two at the other, were included in the study. Initially,
Quantitative data collection Quantitative data analysis Case selection Qualitative data collection Qualitative data analysis Interpretation of results
Ph
ase 1
Ph
ase 2
33
a decision was made as to which classes would be assigned as treatment classes and control classes based on input from the participating teachers regarding availability of computers. Once a laptop cart was secured at one of the participating high schools, the issue of computer availability was eliminated and classes were then assigned randomly as treatment and control classes. A total of 126 students returned consent and assent forms, but only 97 of the students completed all activities associated with the study ± pretest, technology intervention or instruction, and posttest. Of these 97 students, 49 were in treatment classes and 48 in control classes.
Technology Intervention
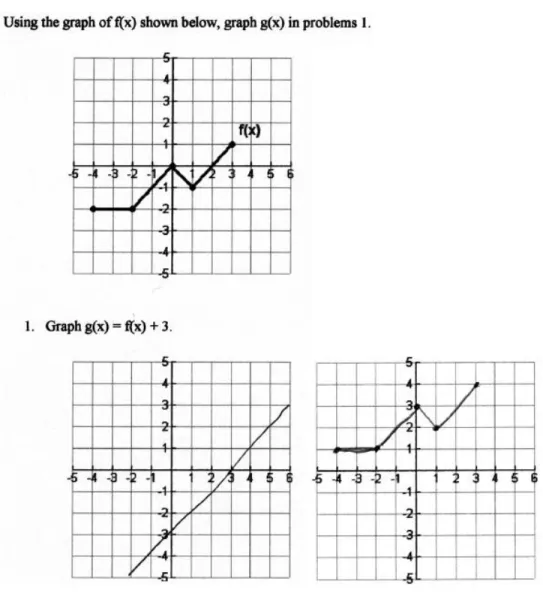
The technology interventions utilized in the study included two web-based interactive applets on parameter changes to parent functions that the researcher created using GeoGebra. The applets were uploaded to GeoGebraTube (www.geogebra.org) so that students would need only internet access to utilize the applets. One applet focused on parameter changes of the form g(x) = f(x) + c and was accessed using the web address www.geogebratube.org/student/m19019. The other applet focused on parameter changes of the form g(x) = a*f(x). This applet was accessed using the web address
34
the applet on parameter changes of the form g(x) = a*f(x) while students in the control classes were taught this transformation without the use of the applet. Each guided exploration took one class period to complete.
Although it is impossible to duplicate exactly the utilization of the technology intervention on each campus since the researcher could not be present, participating teachers were trained by the researcher on specific expectations for utilizing the technology interventions so that the difference between campuses would be minimal. Due to scheduling conflicts, the training for the teachers was held after school rather than on Saturday as initially planned. During the training, the researcher shared the purpose of the research study, described the applets, and modeled how to the use the sliders to change the representations on the applet. Specific guidelines (see Appendix G) were given to participating teachers on how to facilitate treatment classes completing the applet activities. Participating teachers were told to teach the two parameter changes to the control classes as they normally do. Neither teacher used computers or applets to teach parameter changes to parent functions. At the end participating teachers were given the opportunity to ask questions to clarify their role in the process.
Instrumentation
Phase One. The quantitative data collected in phase one were used mainly to
35
posttest assessments were developed by the researcher using current state and national standards for Algebra 2 along with questions from released Algebra 2 end-of-course exams from various states. Pretest and posttest questions were the same. The
pretest/posttest assessments were divided into four parts. Parts one and four addressed procedural understanding and parts two and three addressed conceptual understanding. The pretest consisted of 24 items ( , and the posttest consisted of 24 items ( . According to Nunnaly and Berstein (1994), an alpha of .70 can be used as a cutoff for reliability for newly developed instruments. For most basic research, though, an alpha of .80 should be used as a cutoff for reliability (Carmines & Zeller, 1979; Lance, Butts, & Michels, 2006; Nunnaly & Berstein, 1994). Thus, the posttest was found to be reliable. Although the pretest would not be considered reliable using .80 as the cutoff, the pretest would be considered reliable using .70.
The study took place in the fall semester when the participating teachers planned to teach parameter changes to parent functions. Students in both treatment and control classes were given a pretest prior to the time when these two transformations were to be taught. Students in the treatment classes completed the guided explorations using the applets while students in the control classes were taught the two transformations by their respective teacher. Students in the treatment classes took two days to complete the two guided explorations using applets while students in the controls classes received two days of instruction on parameter changes to parent functions without the use of applets.
36
from procedural understanding to conceptual understanding on parameter changes to parent functions and whether the use of guided explorations with applets had an impact on the transition.
The participating teachers were given a two-week timeframe for completing all events associated with the study including the pretest, two applet activities (treatment classes) or regular instruction (control classes), and the posttest. One week following the pretest, three consecutive days were scheduled to complete all remaining events
associated with the study. One the first scheduled day, students in the treatment classes completed the first applet activity on vertical translations while students in the control classes received instruction on vertical translations from their teachers. The following day, students in the treatment classes completed the second applet activity on vertical stretching and shrinking while students in the control classes received instruction on vertical stretching and shrinking from their teachers. The next day, students completed the posttest on parameter changes to parent functions. Since the researcher was required to administer the pretest and posttest, these assessments were not given on the same day at each campus. Due to the fact that both participating teachers were scheduled to teach parameter changes to parent functions at approximately the same time, the researcher was able to give the posttest at each high school within the same week.
37
quantitative results from phase one, students in the treatment classes were categorized by their score decreasing, not changing, or increasing from pretest to posttest. At least one student per category per school was interviewed. The interviews took place on the respective school campuses, and each interview was approximately 30 minutes. The interviews were audio taped, but the researcher also took notes during the interviews. Interviews were transcribed and participants verified that the interview transcripts were correct. The interview questions were used to determine what each teacher and student attributed the impact of the use of single purpose applications to regardless of whether the impact of using single purpose applications was positive, negative, or nonexistent.
Validity
Since the researcher created the pretest and posttest assessments, a critical step in the instrument development process was assessing content validity. In developing
questions for the pretest and posttest assessments, the researcher reviewed the Texas Essential Knowledge and Skills (TEKS) and the CCSSM so that assessment questions would be aligned with state standards and national recommended standards. According to WKH$OJHEUD7(.6VSHFLILFDOO\$%VWXGHQWVDUHH[SHFWHGWR³XVHWKHSDUHQW
function to investigate, describe, and predict the effects of changes in a, h, and k on the graph of y = a(x ± h)2 + k´(TEA, 2005, p. 45). According to the CCSSM students are H[SHFWHGWR³H[SHULPHQWZLWKFDVHVDQGLOOXVWUDWHDQH[SODQDWLRQRIWKHHIIHFWVRQWKH JUDSKXVLQJWHFKQRORJ\´RIWUDQVIRUPDWLRQVWRSDUHQWIXQFWLRQLQFOXGLQJf(x) + k , k(f(x)) , f(k(x)) , and f(x + k) (CCSSO, 2010, p. 70).
38
public research-intensive universities in south central United States who are considered experts in the field of mathematics. These reviews were followed by reviews from a team of mathematics professors from universities in northeast Texas. Also, colleagues that the researcher taught with over the years and considered to be expert high school
mathematics teachers reviewed the assessments. Changes were made to the pretest and posttest based on the expert reviews.
,QWHUYLHZSURWRFROVZHUHDOVRUHYLHZHGE\WKHUHVHDUFKHU¶VGLVVHUWDWLRQFRPPLWWHH prior to the proposal defense. Changes to the interview protocols were initially made based on input from the dissertation committee during the proposal defense. Following WKHSLORWVWXG\PRUHFKDQJHVWRWKHSURWRFROVZHUHPDGHEDVHGRQWKHUHVHDUFKHU¶V experiences interviewing participants during the pilot study.
39
used three consecutive days for completing applet activities and the posttest - two days for applet activities for treatment classes and instruction for control classes followed by one day for posttest. Each participating teacher was trained on the expectations for facilitating the guided explorations and verified during their interview that the
expectations were met. Since the unit on teaching parameter changes to parent functions started with the first of these three consecutive days, the researcher eliminated class time where these transformations can be discussed outside of the scope of the study. By doing this, the researcher minimized history effects.
Pilot Study
A pilot study was conducted in the spring of 2012 using existing precalculus classes at a northeast Texas high school. There were 21 students and one teacher that participated in the study pilot. Students who participated in the pilot study were in one of two precalculus classes taught by the participating teacher. One class was designated the treatment class and one the control class. Students in the treatment class had no major problems completing the two applet activities, but there were a few students who struggled initially to start the activities even though the activity sheets were intended to provide guidance for the exploration. Upon completion of the pretest, applet activities, and posttest, three students from the treatment class were selected and interviewed by the researcher. Following data collection and analysis, revisions were made to the
assessments, scoring rubric, and interview protocol.
40
and posttest assessments, part one was procedural, part two was conceptual, and part three was both. The researcher discovered during the pilot study the difficulty in scoring part three in terms of procedural and conceptual understanding. By adding part four that focused on procedural understanding and mirrored part three, the scoring difficulty was alleviated. The scoring rubric was also reworded to alleviate inconsistencies in grading that the researcher discovered during the pilot study while scoring documents a second time. The researcher also made minor changes in the wording of some questions on interview protocols.
Data Collection Procedures
Phase One. For the quantitative portion of the mixed methods study, each student was given the pretest on parameter changes to parent functions during his or her Algebra 2 class. Students were given 45 minutes to complete the pretest and were not allowed to use calculators or the applets on the pretest. The pretest assessment was monitored and collected by the researcher. The participating teachers took two consecutive days to teach the two transformations to the students in their control classes while the students in their treatment classes completed the two applet activities. The next day following the
FRPSOHWLRQRIWKHJXLGHGH[SORUDWLRQVXVLQJWKHDSSOHWVIRUWUHDWPHQWFODVVHVRUWHDFKHU¶V instruction for control classes, each student was given the posttest on parameter changes to parent functions. As with the pretest, students were given 45 minutes to complete the posttest and could not use calculators or the applets on the posttest. The researcher monitored and collected the posttest assessment.
41
participating in the study. Student selection was based on the following criteria: (a) there is change in score from pretest to posttest ± positive, negative, nonexistent ± and (b) each participating teacher would have at least three of his or her students interviewed. Teacher interviews began after the posttest had been given. Student interviews began once phase one data had been analyzed and students meeting the above criteria were selected.
Interviews took place on the respective high school campuses and took approximately 30 minutes each. On one campus, interviews took place in a conference room in the library. On the other campus, interviews took place in a conference room in the main office. Interviews were audio taped and later transcribed. The researcher met with each teacher and student interviewed to verify the accuracy of the transcription and to get clarification if necessary.
Scoring Rubric for Assessment Items
A scoring rubric (see Appendix B) for the pretest and posttest assessments was GHYHORSHGE\WKHUHVHDUFKHUDQGUHYLHZHGE\WKHUHVHDUFKHU¶VFRPPLWWHH$IWHUXVing the rubric to score pretests and posttests in the pilot study, revisions were made that
simplified the conditions for awarding specific points and enabled the researcher to score assessments consistently.
42 Data Analysis
Phase One. The purpose of this phase of the study was to determine the impact
the use of interactive appletVKDGRQVWXGHQWV¶FRQFHSWXDOXQGHUVWDQGLQJRISDUDPHWHU changes to parent functions.
Data Screening. A total of 126 students from the two high schools returned consent and assent forms. Twenty-nine students were identified as having not completed all activities associated with the study ± pretest, technology intervention or instruction, and posttest. The participating teachers reported that most of the absences were
extracurricular absences due to school-sponsored activities or excused absences due to illness. These twenty-nine students were eliminated from the study for not completing all activities associated with the study. This reduced the sample size to 97 students.
After eliminating participants from the study who were missing pretest or posttest scores, the researcher examined the distribution of the dependent variable posttest_score and the covariate pretest_score. Descriptive statistics were run initially using SPSS to determine if the variables pretest_score and posttest_score were normally distributed. Since both variables were positively skewed, the researcher completed a log
transformation of the data renaming the variables pretest_score_log and
posttest_score_log. Descriptive statistics were run again, and the transformed variables for pretest and posttest scores were normally distributed.
Descriptive Statistics. Before conducting the ANCOVAs to determine whether WKHXVHRIJXLGHGH[SORUDWLRQVXVLQJDSSOHWVKDGDQLPSDFWRQVWXGHQWV¶XQGHUVWDQGLQJ, descriptive statistics for the transformed dependent variables (see Table 3.1) ±
43
covariates ± pretest_score_log, pre_procedural_log, and pre_conceptual_log ± were calculated using SPSS. Skewness and kurtosis for the transformed dependent variables and transformed covariates were checked. Not only did the values for skewness and kurtosis for each transformed variable fall within the range of minus two standard errors to plus two standard errors, the absolute value of the skewness and kurtosis values for each transformed variable was less than one. Thus, the transformed dependent variables and transformed covariates were considered normally distributed.
Table 3.1
Descriptive statistics for transformed dependent variables Mean SD Variance Skewness Kurtosis Posttest
score 1.166 .325 .106 -.520 -.126 Posttest
procedural
subscore .930 .375 .140 -.565 -.400 Posttest
conceptual subscore
.783 .359 .129 -.565 .013
Assumptions. Having a dependent variable that is normally distributed is one assumption for ANCOVA. Other assumptions for ANCOVA include homogeneity of variances, homogeneity of the regression slopes, the use of independent random