DOI: 10.1051/0004-6361:20035788
c
ESO 2004
Astronomy
&
Astrophysics
Detection of CO
J = 1–0 in the z = 3.79 radio galaxy 4C 60.07
T. R. Greve
1, R. J. Ivison
2, and P. P. Papadopoulos
3,41 Institute for Astronomy, University of Edinburgh, Blackford Hill, Edinburgh EH9 3HJ, UK 2 UK ATC, Royal Observatory, Blackford Hill, Edinburgh EH9 3HJ, UK
e-mail:[email protected]
3 Department of Physics & Astronomy, University College London, Gower Street, London WC1E 6BT, UK
e-mail:[email protected]
4 Sterrewacht Leiden, PO Box 9513, 2300 RA Leiden, The Netherlands
Received 2 December 2003/Accepted 5 February 2004
Abstract.We report on the detection of the lowest COJ=1−0 transition in the powerful high-redshift radio galaxy 4C 60.07 atz=3.79. The CO emission is distributed in two spatially and kinematically distinct components as was previously known from the observations of the higher excitation COJ=4−3 line. The total molecular gas mass in 4C 60.07 inferred from the COJ=1−0 emission isM(H2)1.3×10¹¹M, sufficient to fuel the inferred star-formation rate of∼1600Myr−1for 108yrs. From our high-resolution COJ=1−0 VLA maps we find the dynamical mass of 4C 60.07 to be comparable to that of a giant elliptical at the present time. A significant fraction of the mass is in the form of molecular gas suggesting that 4C 60.07 is in an early state of its evolution. The merging nature of 4C 60.07 along with its large dynamical mass imply that this system is a giant elliptical caught in its formative stages.
Key words.galaxies: individual: 4C 60.07 – galaxies: active – galaxies: formation – galaxies: ISM – cosmology: observations
1. Introduction
High-redshift radio galaxies (HzRGs) are amongst the most lu-minous objects known, and are believed to serve as tracers of the peaks of the primordial density field around which giant elliptical galaxies and clusters of galaxies form (Kauffmann 1996; West et al. 1994). In the radio, HzRGs typically dis-play a double-lobe morphology and large radio luminosities (P178 MHz ∼5×1035 erg s−1 Hz−1), indicating a highly active black hole.
Recently, evidence has been mounting that HzRGs are massive starburst galaxies. This has come about from sub-millimetre detections of a number of HzRGs, implying large rest-frame far-IR luminosities (LFIR 1013 L) powered by intense star formation (SFR 1000−2000Myr−1 – Dunlop et al. 1994; Hughes et al. 1997; Ivison et al. 1998; Archibald et al. 2001). In a recent SCUBA survey of seven HzRGs and their surroundings, Stevens et al. (2003) not only found the star formation in the radio galaxies themselves to be ex-tended on several tens of kilo-parsec scales but also found one or more previously undetected submm sources in the vicin-ity (50−250 kpc) of more than half of the targeted objects. It is difficult to see how the Active Galactic Nucleus (AGN) could power the far-IR luminosity on>∼10 kpc scales, and a massive starburst seems to be the natural explanation. Indeed, Send offprint requests to: T. R. Greve, e-mail:[email protected]
adequate “fuel” for such large star formation rates has been found in the four HzRGs which have been detected in CO to date (Papadopoulos et al. 2000; De Breuck et al. 2003a,b). These observations revealed the presence of mas-sive (∼1011 M
) reservoirs of molecular gas, enough to fuel
a∼1000 Myr−1 starburst for∼108 yr, and in in half of the cases the CO emission was found to be extended on tens of kpc scales (Papadopoulos et al. 2000; De Breuck et al. 2003a). Similar large molecular gas masses distributed in clumps on tens of kilo-parsec scales has been found in a number of QSOs at high redshifts (Carilli et al. 2002a,b). In general, HzRGs have the advantage over quasars that they are not gravitation-ally lensed since they are usugravitation-ally selected on the basis of ex-tended lobe-emission whereas quasars are often found to be lensed. Furthermore, HzRGs are known to be associated with giant ellipticals in the local Universe (McLure & Dunlop 2000). In this paper we present high-resolution observations of the COJ=1−0 emission from 4C 60.07 at z = 3.788 using the Very Large Array1. Throughout we have assumed H
0 =
65 km s−1Mpc−1,ΩM=0.3 andΩ
Λ =0.7. In this cosmology the luminosity distance of 4C 60.07 is 36.2 Gpc and 1 corre-sponds to 7.7 kpc.
1 The Very Large Array (VLA) is operated by the National Radio
2. 4C 60.07
4C 60.07 is an ultra-steep-spectrum (USS) radio galaxy at red-shift of z = 3.788 (Chambers et al. 1996; R¨ottgering et al. 1997). It displays a Fanaroff-Riley II (FR II) edge-brightened double-radio morphology (Fanaroff& Riley 1974). The radio morphology of 4C 60.07 is seen in Fig. 1 which shows a VLA C-band (6 cm) archive image of 4C 60.07. The system consists of two main bright hot spots separated by about 9. The south-eastern component is further comprised of two components (B and C). Continuum emission is also seen from the radio core which is located∼2west-northwest of theC-component.
The COJ=4−3 line and 1.25 mm continuum emission from 4C 60.07 have been imaged using the IRAM Plateau de Bure Interferometer (Papadopoulos et al. 2000). The CO emis-sion was found to emerge from two kinematically distinct com-ponents separated in velocity space by∼700 km s−1. The com-ponent with the narrowest line profile (FWHM∼150 km s−1) is offset byV −224 km s−1 from the systemic velocity cor-responding toz=3.788 and spatially coincident with the po-sition of the radio core. The broader component (FWHM ≥ 550 km s−1) peaks∼7(∼30 kpc) west of the radio core, and is offset by483 km s−1from the systemic velocity. Such large offsets between the redshift of the optical emission lines and the CO emission has been observed in several other high redshift systems, and is commonly attributed to the optical lines orig-inating in strong outflows and winds (Guilloteau et al. 1999; Cox et al. 2002). Strong gravitational lensing can be ruled out as the origin of the double source and large apparent luminosity since not only do the two components have different line widths but they are also offset in velocity with respect to each other. Furthermore, there are no indications from observations in the optical and radio suggesting that 4C 60.07 might be lensed.
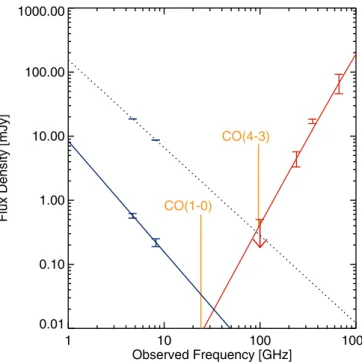
In order to get a handle on the non-thermal contribution to the submm and CO fluxes, we usedCandXband images from the VLA Archive to measure the radio fluxes of the various components in 4C 60.07 at 6 cm and 3.6 cm. In Fig. 2 we have plotted the submm/far-IR spectral energy distribution (SED) of 4C 60.07 along with the radio spectra of the A-component and the radio core. The A-component (the dotted line in Fig. 2) is the brightest component in the radio and furthermore has the shallowest spectral slope (α3.6 cm6 cm =−1.4) which means it provides a strict upper limit on the non-thermal flux at submm wavelengths. The 1.25 mm continuum emission from 4C 60.07 is likely to be thermal in origin, i.e. from warm dust, since non-thermal processes are unable to account for the observed flux, see Fig. 2. Furthermore, the 1.25 mm continuum emission is offset by∼4to the west from the radio core position, and does not appear to be associated with the non-thermal emission.
The radio core has a spectral slope of α3.6 cm6 cm = −1.7. Extrapolating to the frequency of the COJ=1−0 line (∼24 GHz) we find that the radio continuum is expected to con-tribute a non-neglibleS24 GHz =0.03 mJy. In comparison, the contribution from the thermal dust spectrum seems completely neglible, see Fig. 2.
ARC SEC
ARC SEC
6 4 2 0 -2 -4 -6 -8
6
4
2
0
-2
-4
-6
-8
A
B C
Fig. 1.6 cm VLA map of 4C 60.07 overlaid on anI-band image ob-tained with the William Herschel Telescope. The radio hot spots are denoted by A, B and C. The cross marks the position of the radio core: RA(J2000): 05h12m55s.147, Dec(J2000):+60◦3051.0. The insert in the bottom right corner shows the synthesized beam.
1 10 100 1000
Observed Frequency [GHz] 0.01
0.10 1.00 10.00 100.00 1000.00
Flux Density [mJy] CO(1-0)
CO(4-3)
Fig. 2. The submm/far-IR spectral energy distribution (SED) of 4C 60.07 (red line) along with the radio spectra of the A-component (blue dotted line) and the radio core (blue solid line). The submm points are taken from SCUBA observations by Archibald et al. (2001) while the IRAM 30 m Telescope data-points at 252 GHz (1.25 mm) and 100 GHz (3 mm) are from Papadopoulos et al. (2000). The ra-dio points are measured from C and X band data of 4C 60.07 from the VLA Archive. The positions and strengths of the COJ=1−0 and
3. Observations
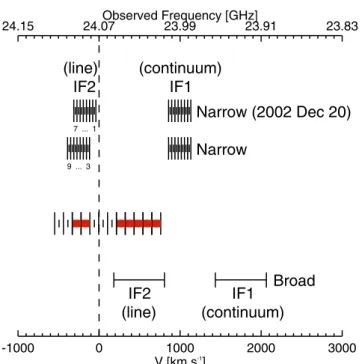
The COJ=1−0 line (νrest = 115.27 GHz) from 4C 60.07 is redshifted into the VLA’s K-band (1.3-cm) receivers. Since non-thermal continuum emission from the radio core was ex-pected, we used two IF pairs (right- and left-hand circular po-larisation) centred on the two kinematically distinct emission-line components, each pair set up such that one IF pair was centred on the line and the other pair was offset from this by 100 MHz to measure the continuum. The IF set-up for both the broad and narrow component is detailed in Fig. 3. The broad-line component was observed in continuum mode with a 50 MHz-wide IF centred at 24.035 GHz, which corre-sponds to a velocity coverage of 624 km s−1. Not only does this not properly cover the broad component but, since the ob-servations were done in continuum mode, no information on the line shape was available, and one therefore has to rely on the IRAM COJ=4−3 observations to infer a line width for the broad component. The narrow component was observed in spectral-line mode with a 7-channel IF centered at 24.095 GHz, each channel being 3.125 MHz wide. This was to avoid under-resolving the narrow line in velocity space. However, the line datasets from the 2002 December 20 and 2003 March 09 are centred at 24.089 GHz, corresponding to a shift of two channels, in order to get a better spectral coverage at the low-frequency side of the line. Thus nine channels (denoted channels 1,..., 9 in Fig. 3) covered the line, corresponding to a velocity coverage of 350 km s−1. 4C 60.07 was observed in the VLA’s CD, D and C configurations (see Table 1). The D-configuration data, however, turned out not to have the spatial resolution required to properly separate the (B, C) component from the radio core, and was therefore discarded. The lack of D-array data is very unlikely to result in “filtering out” any tended CO emission since such emission would have to be ex-tended over scales>∼60(>∼460 kpc). The fact that we do not find any change in total flux after including the D-array data verifies this point.
In total, after calibration overheads, we obtained 6.3 h of integration time on source for both the broad and narrow com-ponents. Calibration and data reduction was done using stan-dard recipes in the NRAOAIPS Cookbook. The amplitude was calibrated with the quasars 3C 48 and 3C 286 at the be-ginning and/or end of each transit. The phase drift was cali-brated using a fast-switching technique in which we observed the nearby source 04494+63322 every few minutes. The data were obtained in good weather conditions, and the rms phase fluctuations after calibration was less than 10◦. For the spectral-line mode observations of the narrow component, the bandpass of the system was calibrated using 0319+415. In all cases the bandpass calibration averaged over the 7 channels was better than 92%. Data taken at different times and in different config-urations were combined using DBCON, weighting each dataset with the its total gridded weight.
4. Results and analysis
The radio morphology of 4C 60.7 in the broad and narrow component IF set-ups is shown in Fig. 4. Figures 4a and 4b
-1000 0 1000 2000 3000
V [km s-1
]
24.15 24.07Observed Frequency [GHz]23.99 23.91 23.83
IF2 (line)
IF1 (continuum) IF2
(line)
IF1 (continuum)
Narrow (2002 Dec 20)
Narrow
Broad
3 ... 9
1 ... 7
Fig. 3.Velocity and frequency coverage of the IF set-up used in our VLA COJ=1−0 observations. The dashed line outlines the sys-temic velocity corresponding to z = 3.788. In red is shown the velocity-channels of the IRAM PdBI observations of Papadopoulos et al. (2000); channels in which COJ=4−3 emission was detected are marked in thick red.
Table 1.VLA observations.
Date Configuration tint/h
2001 Oct. 2 CD 1.4
2001 Oct. 9 CD 1.7
2001 Oct. 11 D 1.7
2001 Oct. 19 D 2.8
2002 Nov. 12 C 1.7
2002 Dec. 20 C 1.5
show pure continuum emission and continuum emission plus the broad CO line emission, respectively; similarly for Figs. 4c and d but for the narrow component.
ARC SEC
ARC SEC
8 6 4 2 0 -2 -4 -6 -8
8
6
4
2
0
-2
-4
-6
-8
ARC SEC
ARC SEC
8 6 4 2 0 -2 -4 -6 -8
8
6
4
2
0
-2
-4
-6
-8
J164502 (8.0 mJy)
J164502−SMM1 (6.4 mJy)
a)
(continuum)
(continuum + line)
a) BROAD: IF1, 23.9951 GHz
b) BROAD: IF2, 24.0351 GHz
ARC SEC
ARC SEC
8 6 4 2 0 -2 -4 -6 -8
8
6
4
2
0
-2
-4
-6
-8
ARC SEC
ARC SEC
8 6 4 2 0 -2 -4 -6 -8
8
6
4
2
0
-2
-4
-6
-8
J164502 (8.0 mJy)
J164502−SMM1 (6.4 mJy)
a)
d) NARROW: IF2, 24.0951 GHz
c) NARROW: IF1, 23.9951 GHz
(continuum)
(continuum + line)
Fig. 4.Naturally weighted, untapered maps, showing the morphology of 4C 60.07 in the two IF set-ups.Top row: the spatial resolution is 1.36×1.19 with the major axis PA=89◦. The rms noise is 0.030 mJy beam−1. Contours are shown at−2, 2, 3, 4, 5, 6, 7, 8, 9, 10, 20, 30,
and 40×35µJy beam−1.Bottom row: the spatial resolution (FWHM) is 1.32×1.17 with the major axis PA=275◦, and the rms noise level is 0.051 mJy beam−1. Contours are shown at−2, 2, 3, 4, 5, 6, 7, 8, 9, 10, 15, and 20×60µJy beam−1. The cross marks the position of the radio
core RA(J2000): 05:12:55.147, Dec(J2000):+60:30:51.0.
This suggests that what we are seeing in the IF2 maps is con-tinuum emissionplusCOJ=1−0 emission from the emission features detected in the COJ=4−3 maps.
4.1. The broad line component
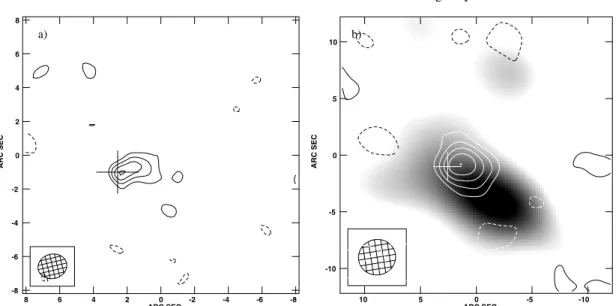
In order to disentangle the broad CO emission from the contin-uum, a box was put around the entire system and a CLEAN-component model of the continuum emission shown in Fig. 4a was constructed. The CLEANing was stopped when the rms of the residuals reached the noise level in the image. This was then subtracted in uv-space from the IF2 data using theAIPStask UVSUB, resulting in uv-data from which maps free of con-tinuum emission could be produced. Figure 5a shows the re-sulting COJ=1−0 map of the broad component. The lack of residual emission at the positions of the two radio lobes demon-strates the effectiveness of the continuum emission subtrac-tion. The COJ=1−0 emission is detected at 5σ, peaking at a
position which is coincident with the radio core position but with emission appearing to extend 2−3 to the west. In com-parison, the broad component of the COJ=4−3 emission was found to peak∼4south-west of the radio core (Papadopoulos et al. 2000).
In Fig. 5b we have overlaid the COJ=1−0 contours on top of a gray-scale image of theJ=4−3 emission. The 1−0 map has been tapered down to 60 kλin order to better match the resolution of the 4−3 data (FWHM = 8.9×5.5). The offset between the centroids of the 1−0 and 4−3 emission is within the positional errors given the largeJ=4−3 synthesized beam, and in general there is good spatial correspondence between the two.
Assuming that the IF covers the entire line, we can estimate the velocity-integratedJ=1−0 flux density using
∆vSνobsdv= ∆νIF c
νobs
ARC SEC
ARC SEC
8 6 4 2 0 -2 -4 -6 -8
8
6
4
2
0
-2
-4
-6
-8
a)
ARC SEC
ARC SEC
10 5 0 -5 -10
10
5
0
-5
-10
b)
Fig. 5. a)Naturally weighted COJ=1−0 map of the broad component obtained by combining the entire data-set and tapering it with a Gaussian with a half-width at 0.30 amplitude of 200 kλ. The spatial resolution is 1.72×1.45 with the major axis PA=283◦. The contours are at−2, 2, 3, 4, and 5×σ, whereσ=35µJy beam−1.b)The COJ=1−0 emission tapered down to 60 kλ(FWHM=3.33×3.12) overlaid as
contours on a gray-scale representation of theJ=4−3 emission by Papadopoulos et al. (2000). The contours are−2, 2, 3, 4, 5, and 6σwith
σ=0.4 mJy beam−1, and the gray-scale range is 0.6−2.0 mJy beam−1.
where∆νIF is the width of the IF andSCOis the flux density. We find SCO = (0.27±0.05) mJy which yields a velocity-integrated flux density of (0.15±0.03) Jy km s−1, where we have usedνobs=24.035 GHz and an IF bandwidth of 45 MHz (560 km s−1) instead of 50 MHz due to bandpass rollover. The COJ=1−0 emission from the broad component in the uvtaper 200 map appears to be somewhat extended in the north-west direction, although the low signal-to-noise of the data does not warrant a firm conclusion on this issue.
4.2. The narrow line component
The continuum subtraction in the case of the narrow-line emis-sion was done in a similar fashion as for the broad component: a continuum model was constructed by combining all IF1 nels and then subtracted from the IF2 channels. Since chan-nels 1 and 2 had a different uv-coverage than channels 3 to 7 which again had a different uv-coverage than channels 8 and 9, three different continuum models had to be constructed, one for each of these three sets of channels. In order to increase the signal-to-noise ratio we averaged neighbouring channels dur-ing the imagdur-ing of the continuum-subtracted IF2 channels. We then searched for any residual emission at the expected po-sition of the narrow component and used the task
to measure the flux. The resulting spectrum of the COJ=1−0 emission is shown in Fig. 6 where we have also plotted the velocity-coverage of the two IRAM PdBI channels in which J=4−3 emission from the narrow component was detected. Note that channels 1–2 and 8–9 are somewhat more noisy than the other channels, since the corresponding integration time is less. We detect COJ=1−0 emission in channels 3 to 6, which in velocity-space overlaps with the two IRAM PdBI channels in which the strongest COJ=4−3 emission is detected. Only very weak COJ=4−3 emission was found in the third IRAMPdBI channel at 96.3095 GHz which is in agreement with the J=1−0 line profile. From a Gaussian fit to the line profile, we find the 1−0 spectrum to peak atV (−220±40) km s−1 offset from the systemic velocity of 4C 60.07 which is consis-tent with that found for the 4−3 line given the large velocity bins. The formal linewidth is∆VFWHM (165±24) km s−1,
again in good agreement with that of the COJ=4−3 line profile. The fit yields a velocity-integrated flux density of 0.09±0.01 Jy km s−1, see also Table 2.
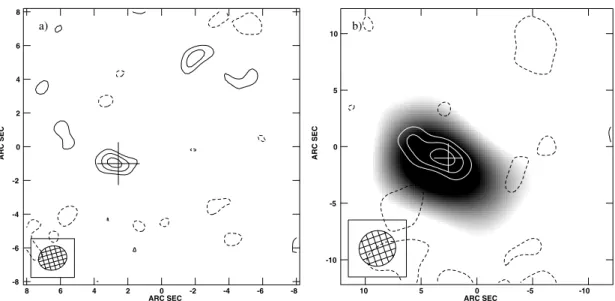
Combining channels 3 to 6 we obtain the velocity-integrated COJ=1−0 emission map shown in Fig. 7a. In Fig. 7b we have overlaid contours of the COJ=1−0 emission on a gray-scale image of theJ=4−3 emission where the latter has been tapered down to 60 kλ. TheJ=1−0 emission peaks at∼0.7 east of the radio core which is consistent with the po-sition of the narrowJ=4−3 component. Similar to what was found for theJ=4−3 line, inJ=1−0 the narrow component appears to be more compact and less extended than the broad component.
5. Discussion
5.1. CO luminosity and molecular gas mass
-400 -300 -200 -100 0 Velocity [km s-1
] 0.0
0.2 0.4 0.6 0.8 1.0 1.2
Flux Density [mJy]
VLA CO(1-0)
IRAM PdBI CO(4-3)
96.3795 96.3445 Frequency [GHz]
Fig. 6. The spectrum of the narrow COJ=1−0 component in 4C 60.07. All channels maps were tapered with a 200 kλGaussian. The rms noise in channels 1–2 is 0.12 mJy beam−1 at a spatial
reso-lution of 1.4×1.3; the noise in channels 3–6 is 0.086 mJy beam−1
at a spatial resolution of 1.7×1.4, and the noise in channels 7–8 is 0.09 mJy beam−1at a spatial resolution of 1.9×1.5. Above the line-profile we have plotted the velocity coverage of the channels in which
J=4−3 emission was detected (Papadopoulos et al. 2000). The verti-cal dashed line corresponds to the systemic velocity (z=3.788).
(e.g. Strong et al. 1988). XCO is the COJ=1−0 line lumi-nosity to H2-mass conversion factor which in the extreme UV-intense environments found in local Ultra Luminous Infra-Red Galaxies, and presumably also in high redshift galaxies such as 4C 60.07, has a value of about 0.8 (K km s−1 pc2)−1M
(Downes & Solomon 1998). In doing so we find molecular gas masses ofM(H2)∼8×10¹⁰ MandM(H2)∼5×10¹⁰Mfor the broad and narrow CO emitting components, respectively. Hence, even for a conservative, non-Galactic value ofXCOwe find that about∼1011 M
of molecular gas is associated with
4C 60.07. The estimated gas masses are in very good agree-ment with those of Papadopoulos et al. (2000).
The total gas mass in 4C 60.07 will of course be larger once the neutral hydrogen has been accounted for. Assuming a value ofM(HI)/M(H2)=2 which is typically found in IRAS galaxies (Andreani et al. 1995) we find a total gas mass of Mgas=M(H2)+2M(H2)=2.4×10¹¹Mfor the broad compo-nent and 1.5×10¹¹ Mfor the narrow component. In case that metal-poor gas is also present the gas mass can be even higher.
5.2. FIR luminosity and star-formation efficiency
In the case where the far-IR luminosity is powered by a star-burst and not an AGN, and all the stellar radiation is absorbed by dust, the far-IR to CO luminosity ratio,LFIR/LCO, provides a rough measure of the integrated luminosity of massive stars responsible for heating the dust (LFIR) relative to the amount of fuel available for star formation (LCO). We estimate the far-IR luminosity of 4C 60.07 to beLFIR4×1013L, where we have
Table 2.Observed and derived properties for 4C 60.07.
Parameter 4C 60.07 4C 60.07
(broad) (narrow)
RA(J2000) 05h12m54s.75 05h12m55s.30
Dec(J2000) +60◦3050.92 +60◦3052.29
SCO(1−0)[mJy] (0.27±0.05) (0.30±0.10) SCO(1−0)∆V[Jy km s−1] (0.15±0.03) (0.09±0.01)
LCO(1−0)[K km s−1pc2] (1.0±0.2)×1011 (6.0±0.7)×1010
M(H2) [M] 8×10¹⁰ 5×10¹⁰
used the 850-µm flux measurement of Archibald et al. (2001) and adopted a dust temperature and spectral index ofTd =50 K andβ=1.5, respectively. This yields aLFIR/LCOratio of(4× 10¹³L
)/(1.6×1011K km s−1pc2)=250L(K km s−1pc2)−1,
which is similar to values found in ULIRGs (e.g. Solomon et al. 1997). Carilli et al. (2002a) found continuum-to-line ra-tios of 350 and 323 in the QSOs BRI 1202-0725 (z=4.70) and BRI 1335-0417 (z = 4.41), respectively. A somewhat lower value of 200 was found in thez=4.12 QSO PSS J2322+1944 (Carilli et al. 2002b).
The current star-formation rate measured in M yr−1 is given by
SFR(LFIR10−10/L)δMFδSB, (2) whereδMF ∼0.8−2 depends on the mass function of the stel-lar population, andδSBis the fraction of the far-IR luminosity which is powered by the starburst and not the AGN (Omont et al. 2001). If we adoptδMF =0.8 and conservatively assume that only 50% ofLFIR is powered by the starburst (δSB =0.5) we findSFR∼1600M; yr−1. Assuming that the total amount of molecular gas observed towards 4C 60.07 ends up as fuel for the starburst, we find that there is enough molecular gas to sustain the inferred star-formation rate for∼8×10⁷yr. While this is short compared to the Hubble time it is still sufficient to produce a giant elliptical with a stellar mass ofM∗1011 M
.
The efficiency with which stars are being formed, i.e. the rate of star-formation per solar mass of molecular hydrogen, is given bySFE = SFR/M(H2) or equivalently LFIR/M(H2). For 4C 60.07 we find SFE = LFIR/M(H2) 300L M−1, which is somewhat higher than the∼190LM−1reported by Papadopoulos et al. (2000) who derived their value based on their flux density measurement ofS850µm =11 mJy. Here we have used the measurement by Archibald et al. (2001) which yields a somewhat higher 850µm flux density of 17 mJy, al-though still lower than the 22 mJy reported by Stevens et al. (2003).
Local ULIRGs exhibit star-formation efficiencies compara-ble to that of 4C 60.07, once the sameXCO-factor has been used (Solomon et al. 1997). It is worth stressing that our detection of COJ=1−0 enables us to make a direct comparison ofSFEs with that of local ULIRGs since the same gas mass measure (theJ=1−0 line) is used for ULIRGs.
ARC SEC
ARC SEC
8 6 4 2 0 -2 -4 -6 -8
8
6
4
2
0
-2
-4
-6
-8
a)
ARC SEC
ARC SEC
10 5 0 -5 -10
10
5
0
-5
-10
b)
Fig. 7. a)The narrow component tapered at 200 kλ. The resolution is 1.72×1.42 at PA=285◦. Contours are at−2, 2, 3, and 4×σ, where
σ = 55 µJy beam−1.b)The COJ=1−0 emission tapered down to 60 kλ(FWHM = 3.22×3.07) overlaid as contours on a gray-scale representation of theJ=4−3 detection by Papadopoulos et al. (2000). The contours are−2, 2, 3, and 4σwithσ=0.6 mJy beam−1, and the
gray-scale range is 0.6−2.0 mJy beam−1.
detection of CO together with the fact that 4C 60.07 and other HzRGs appear extended on several tens of kilo-pc scales at submm-wavelengths (Ivison et al. 2000; Stevens et al. 2003) strongly suggests that the far-IR emission is powered by large-scale starburst and not the AGN. Here we must mention that while COJ=1−0 may be a good indicator of the total metal-rich H2gas resevoir, it may be a poor one regarding the dense gas phase (n≥105cm−3) that “fuels” star-formation. The latter could be particular true in the tidally disrupted giant molecular clouds (GMCs) expected in ULIRGs where a diffuse phase may dominate the COJ=1−0 emission but has little to do with star formation. This could be the reason why theLFIR/LCOratio is found to be such a strong function ofLFIR, increasing for the merger systems associated usually with large far-IR luminosi-ties. Interestingly, recent work shows that theSFEof dense gas, parametrised by the LFIR/LHCN(1−0) ratio (the HCN J=1−0 critical density is 2×105cm−3), remains constant from GMCs all the way to ULIRG system (Gao & Solomon 2003).
5.3. Excitation conditions
From the detections of CO in 4C 60.07 we can infer the CO (4−3)/(1−0) velocity/area-averaged brightness temperature ra-tio usingr43 =LCO(4−3)/LCO(1−0). The global line ratio, i.e. the line ratio obtained by combining the flux from the two compo-nents, isr43=0.7+0.3−0.2. The line ratios for the broad and narrow components are 0.7+0.3−0.2and 0.6+0.2−0.2, respectively. Hence, given the large uncertainties we find no significant difference in the excitation conditions between the two components. Thus in this case H2mass estimates solely from COJ=4−3 assuming full thermalisation and optical thickness of the latter (i.e.r43 1) would not result in too large errors. However, the sub-thermal excitation of such high-JCO lines remains a possibility even in starburst environments (e.g. Papadopoulos & Ivison 2002; Greve et al. 2003).
In Fig. 8 we plotted the velocity-integrated CO line flux densities (normalised to J=4−3) for the broad and nar-row components in 4C 60.07 as well as the normalised line fluxes for PSS J2322+1944. We have used a standard single-component large velocity gradient (LVG) code to interpret the observed line ratio. In fact, given the large range compatible with our measurements we can only put a lower limit on the density. Indeed, for both components the upper values forr43 are compatible with LTE and optically thick emission where the ratio is no longer sensitive to the density.
200 400 600 800 Rest Frequency [GHz]
0.1 1.0
Velocity Integrated CO Line Flux (Normalised)
1-0 2-1 3-2 4-3 5-4 6-5 7-6 Milky Way
M82
1-0 2-1 3-2 4-3 5-4 6-5 7-6 Milky Way
M82
1-0 2-1 3-2 4-3 5-4 6-5 7-6 Milky Way
M82
1-0 2-1 3-2 4-3 5-4 6-5 7-6 Milky Way
M82
1-0 2-1 3-2 4-3 5-4 6-5 7-6 Milky Way
M82
1-0 2-1 3-2 4-3 5-4 6-5 7-6 Milky Way
M82
1-0 2-1 3-2 4-3 5-4 6-5 7-6 Milky Way
M82
1-0 2-1 3-2 4-3 5-4 6-5 7-6 Milky Way
M82
Fig. 8.Velocity-integrated CO line flux densities from 4C 60.07 are shown as filled squares. The integrated line fluxes have been nor-malised to theJ=4−3 line. Also shown are the line fluxes from the
z=4.12 QSO PSS J2322+1944 (filled triangles – Carilli et al. 2002b; Cox et al. 2002), thez = 4.69 QSO BRI 1202-0725 (open circles – Omont et al. 1996; Carilli et al. 2002a), the local starburst galaxy M 82 (open triangles – Mao et al. 2000), and the integrated emis-sion from within the solar radius of the the Milky Way (filled cir-cles – Fixsen et al. 1999). The red dotted line shows the line flux in-creasing as frequency squared which is expected for optically thick conditions. The green lines show results from a LVG-model with
Tkin= 50 K,XCO/(dV/dr) =10−5(km s−1pc−1)−1, andn(H2) equal
to 3.0×103cm−3(solid line) and 2.2×103cm−3(dashed line).
5.4. What is the evolutionary status of 4C 60.07?
A comparison between the molecular gas mass and the dynam-ical mass allows for the determination of the evolutionary sta-tus of a galaxy, while a comparison of its dynamical mass with that of present-day spiral or elliptical can point toward its pos-sible descendant. Typically, dynamical masses are calculated assuming the gas is distributed in a disk in Keplerian rotation (e.g. Carilli et al. 2002a). In the case of 4C 60.07, however, we have sufficient spatial and kinematical information to conclude that the two gas components do not belong to such a struc-ture. The detection of two kinematically distinct gas resevoirs in 4C 60.07, each with a large gas mass, suggest a major merger event. Hence, a more plausible scenario might be that the two clouds are part of spherical system in the process of collaps-ing. Assuming the system is virialised, one can apply the virial theorem to derive the following expression for the dynamical mass
Mdyn=2.33×10⁹
R kpc
∆VFWH M
100 km s−1
2
1
α(1+q)
, (3)
where q is a factor which described the influence of non-gravitational forces on the virial equilibrium, and α ranges from 0.55 to 2.4 with a typical value of 1.5 which we shall
adopt here (see Bryant & Scoville 1996 for details). A pos-sible caveat to this argument comes from the fact that if the assumption of a virialised system is not true, Eq. (3) will tend to overestimate the true dynamical mass. Adopting a radius of the sphere corresponding to half the separation between the two components, i.e.R ∼ 15 kpc (corresponding to 2), and aFWHMwidth equal to the velocity offset between the line centers of the two gas resevoirs, i.e.∆VFWHM ∼ 700 km s−1,
leads to an enclosed dynamical mass ofMdyn<∼1.1×10¹²M,
where we have assumed that non-gravitational forces are neg-ligible, i.e.q 1. Note that since Bryant & Scoville (1996) derived Eq. (3) by examining a large number of clouds fill-ing up a spherical region, we have in the above assumed that the velocity and spatial separation between the two CO com-ponents is a fair approximation for∆VFWHM andRin Eq. (3).
Alternatively, we can do the more simple calculation of find-ing the virial mass required to keep the two clouds bound by a spherical potential. In this case the velocity dispersion be-comes ∆V = (1/2)700 km s−1 = 350 km s−1, and we find Mvirial = G−1R∆V2 4.3 ×10¹¹ M, where we have as-sumedR = 15 kpc. Projection effects will only tend to make Rand∆VFWHM, and therefore also the above mass estimates,
larger. Thus, 4C 60.07 is a massive system with a dynamical mass comparable to that of giant elliptical galaxies seen in the present day Universe. The inferred ratio of the molecular-to-dynamic mass for the system as a whole isM(H2)/Mdyn∼0.12, and the total gas fraction is Mgas/Mdyn ∼ 0.35. The high gas fraction, along with the large velocity dispersion of the system suggest that 4C 60.07 is a very young system in its early stages of formation.
The fact that such a massive (Mdyn ∼ 1012 M) system has assembled atz = 3.8, which corresponds to a time when the Universe was only ∼10% of its present age, seems to favour the monolithic collapse model (e.g. Eggen et al. 1962; Tinsley & Gunn 1976) of massive ellipticals over the hierar-chical formation scenario (e.g. Baron & White 1987; Baugh et al. 1996; Kauffmann & Charlot 1998). Further in support of the monolithic collapse scenario is the large star-formation rate (SFR∼1600Myr−1) we infer from the far-IR luminosity. If such a large star-formation rate can be sustained it is capable of producing a giant elliptical in a time scale comparable to the dynamical time. The dynamical time-scale for a system with a massMwithin a radiusRis
tdyn=7.42×10¹¹
R kpc
3/2
M M
−1/2
, (4)
where tdyn is measured in years (see p. 37 of Binney & Tremaine 1987). For a giant elliptical with a mass Mell = 1012 M
and a radiusR=30 kpc, we findtdyn 1.2×10⁸yr. Hence, in order to form a giant elliptical within a dynami-cal time sdynami-cale, star-formation rates of the order Mell/tdyn 8000 M yr−1 are required, which is comparable to what we find in 4C 60.07. It is important to note that even if the true dynamical mass or the star-formation rate of this system are less than the above estimates, the fact that at z = 3.8 about 1.3×10¹¹M
This mass can only be revised upwards and typically reach ∼4×10¹¹ M
if HI is also accounted for, thereby making the
case for a monolithic collapse scenario even stronger.
4C 60.07 is not the only system with extended CO emis-sion. Molecular gas distributed on tens of kpc scales, some-times in separate gas components, have been observed in high redshifts quasars (e.g. Carilli et al. 2002a; Papadopoulos et al. 2001) and radio galaxies (De Breuck et al. 2003; De Breuck et al., in preparation). Thus, there is evidence to show that at least some luminous active galaxies in the early Universe, in addition to harbouring supermassive black holes in their cen-tres, are associated with massive reservoirs of molecular gas distributed on tens of kpc scales which are in the process of merging. This observed coevality between large scale mergers of gaseous subsystems and the epoch of AGN-activity might provide clues to the origin of the tight relationship observed lo-cally between the velocity dispersion of spheroids and the mass of their central black holes (Ferrarese & Merritt 2000). Acknowledgements. T.R.G. acknowledges support from the Danish Research Council and from the EU RTN Network POE. PPP acknowl-edges a Marie Curie Individual Fellowship HPMT-CT-2000-00875. We are grateful to Ignas Snellen and Philip Best for useful advice on
AIPS. We are also greatly indebted to Carlos De Breuck and Michiel Reuland for providing us with the IRAM PdBI COJ=4−3 data.
References
Andreani, P., Casoli, F., & Gerin, M. 1995, A&A, 300, 43
Archibald, E. N., Dunlop, J. S., Hughes, D. H., et al. 2001, MNRAS, 323, 417
Baron, E., & White, S. D. M. 1987, ApJ, 322, 585
Baugh, C. M., Cole, S., & Frenk, C. S. 1996, MNRAS, 283, 136 Binney, J., & Tremaine, S. 1987, Galactic Dynamics, Princeton Ser.
Astrophys. (Princeton University Press) Bryant, P. M., & Scoville, N. Z. 1996, ApJ, 457, 678
Carilli, C. L., R¨ottgering, H. J. A., van Ojik, R., Miley, G. K., & van Breugel, W. J. M. 1997, ApJS, 109, 1
Carilli, C. L., Kohno, K., Kawabe, R., et al. 2002a, AJ, 123, 1838 Carilli, C. L., Cox, P., Bertoldi, F., et al. 2002b, ApJ, 575, 145 Carilli, C. L., Lewis, G. F., Djorgovski, S. G., et al. 2003, Science,
300, 773
Chambers, K. C., Miley, G. K., van Breugel, W. J. M., et al. 1996, ApJS, 106, 247
Colbert, J. W., Malkan, M. A., Clegg, P. E., et al. 1999, ApJ, 511, 721 Cox, P., Omont, A., Djorgovski, S. G., et al. 2002, A&A, 387, 406 De Breuck, C., Neri, R., Morganti, R., et al. 2003a, A&A, 401, 911 De Breuck, Neri, R., & Omont, A. 2003b, Radio Galaxies: Past,
present and future, Leiden, 11–15 Nov. 2002, ed. M. Jarvis et al. Downes, D., Solomon, P. M., & Radford, S. J. E. 1993, ApJ, 414, L13 Downes, D., & Solomon, P. M. 1998, ApJ, 506, 615
Dunlop, J. S., Hughes, D. H., Rawlings, S., Eales, S., & Ward, M. 1994, Nature, 370, 347
Eggen, O. J., Lynden-Bell, D., & Sandage, A. R. 1962, ApJ, 136, 748 Fanaroff, B. L., & Riley, J. M. 1974, MNRAS, 167, 31
Ferrarese, L., & Meritt, D. 2000, ApJ, 539, L9
Fixsen, D. J., Bennett, C. L., & Mather, J. C. 1999, ApJ, 526, 207 Gao, Y., & Solomon, P. M. 2003, in Star formation at high angular
resolution (Sydney Australia), IAU Symp., 221, 95
Greve, T. R., Ivison, R. J., & Papadopoulos, P. P. 2003, ApJ, in press Guilloteau, S., Omont, A., Cox, P., McMahon, R., & Petitjean, P. 1999,
A&A, 349, 363
Hughes, D. H., Dunlop, J. S., & Rawlings, S. 1997, MNRAS, 289, 766 Ivison, R. J., Dunlop, J. S., Hughes, D. H., et al. 1998, ApJ, 494, 211 Ivison, R. J., Dunlop, J. S., Smail, I., et al. 2000, ApJ, 542, 27 Kauffmann, G. 1996, MNRAS, 281, 487
Kauffmann, G., & Charlot, S. 1998, MNRAS, 294, 705 Mao, R. Q., Henkel, C., Schulz, A., et al. 2000, A&A, 358, 433 McLure, R. J., & Dunlop, J. S. 2000, MNRAS, 317, 249
Omont, A., Petitjean, P., Guilloteau, S., et al. 1996, Nature, 382, 428 Omont, A., Cox, P., Bertoldi, F., et al. 2001, A&A, 374, 371
Papadopoulos, P. P., R¨ottgering, H. J. A., van der Werf, P. P., et al. 2000, ApJ, 528, 626
Papadopoulos, P. P., & Ivison, R. J. 2002, ApJ, 564, L9
Papadopoulos, P. P., Ivison, R. J., Carilli, C. L., & Lewis, G. 2001, Nature, 409, 58
R¨ottgering, H., van Oijk, R., Miley, G., et al. 1997, A&A, 326, 505 Solomon, P. M., Downes, D., Radford, S. J. E., & Barrett, J. W. 1997,
ApJ, 478, 144
Stevens, J. A., Ivison, R. J., Dunlop, J. S., et al. 2003, Nature, 425, 264 Strong, A. W., Bloemen, J. B. G. M., Dame, T. M., et al. 1988, A&A,
201, 1