The buck stops here:
Vanguard money market funds
Keys to improving
the odds of active
management success
Daniel W. Wallick; Brian R. Wimmer, CFA; James Balsamo
Vanguard Research December 2015
■
Although Vanguard is a globally recognized indexing expert, it also has nearly $1 trillion
of actively managed assets under management worldwide, of which $420 billion is active
equity.
1The company has offered actively managed funds since its founding in 1975.
During this time, its distinctive active management philosophy has produced a track record
of success.
■
Active management is challenging. However, we believe three factors are most critical
to improving the probability of outperformance: low cost, top talent, and patience.
— Low cost continues to be the quantitative filter that has proven, with some consistency,
to most effectively predict subsequent relative performance.
— However, no quantitative factor alone can help ensure outperformance. A rigorous and
thoughtful qualitative manager-selection process to identify top talent is also essential.
— Finally, patience is necessary, because returns are inconsistent, even for managers
that outperform over the long term.
■
Low-cost active funds run by talented managers can achieve long-term outperformance
for patient investors, as demonstrated by the results of Vanguard active equity funds.
Note: This research paper was written in the context of the U.S. market, and it may contain data and analysis specific to the United States. All figures are in U.S. dollars. 1 Source: Vanguard data as of June 30, 2015. The amount of actively managed assets is $976.6 billion and includes equity, fixed income, balanced, and money market funds.
2 Many of Vanguard’s actively managed funds are managed by external, independent managers hired to oversee a particular mandate, such as global equities or small-caps. Throughout this paper, we refer to these managers as “sub-advisors.”
Introduction
Why is Vanguard, an indexing expert, publishing research on active management? The company has offered actively managed funds for nearly 40 years. In the United States, it holds more than $420 billion in actively managed equity mutual fund assets, making it the third-largest active equity mutual fund manager in the world. (Source: Morningstar, as of June 30, 2015.) The firm uses both in-house management and external sub-advisors2 to manage these assets, giving it extensive experience in internal active management as well as active manager selection. Based on this experience, Vanguard has formulated an approach to offering actively managed equity portfolios that incorporates best practices refined over decades.
In this paper, we analyze and explain the three factors we’ve found to be most critical in trying to improve the odds of outperformance: low costs, top talent, and patience. Indexing is an excellent option for constructing a portfolio. But for investors who choose active manage-ment instead of or as a complemanage-ment to indexing, we believe our strategy increases the probability of success. A historical performance analysis substantiates the effectiveness of our philosophy.
Notes about risk and performance data: All investments are subject to risk, including the possible loss of the money you invest. Past performance is no guarantee of future returns. The performance of an index is not an exact representation of any particular investment, as you cannot invest directly in an index. There may be other material differences between products that must be considered prior to investing. Diversification does not ensure a profit or protect against a loss in a declining market. There is no guarantee that any particular asset allocation or mix of funds will meet your investment objectives or provide you with a given level of income.
Be aware that fluctuations in the financial markets and other factors may cause declines in the value of your account. Investments in stocks or bonds issued by non-U.S. companies are subject to risks including country/regional risk, which is the chance that political upheaval, financial troubles, or natural disasters will adversely affect the value of securities issued by companies in foreign countries or regions, and currency risk, which is the chance that the value of a foreign investment, measured in U.S. dollars, will decrease because of unfavorable changes in currency exchange rates. Funds that concentrate on a relatively narrow market sector face the risk of higher share-price volatility.
3 Sources: Vanguard calculations, using Morningstar data for the following categories: small-cap value, small-cap growth, small-cap blend, mid-cap value, mid-cap growth, mid-cap blend, large-cap value, large-cap growth, and large-cap blend. Note: Because of fees, most index funds also underperform their benchmarks.
4 Asset-weighted expense ratio. For more information about costs, see Philips et al. (2015).
5 As of December 31, 2014, the median expense ratio for U.S.-domiciled Vanguard active equity funds was 0.36%, and the median for U.S.-domiciled non-Vanguard active equity funds was 1.34%. Data include U.S. and non-U.S. equity funds (excluding sector/specialty funds). See Appendix I for a summary of the expense ratio impact.
The challenge of outperforming
Over the past 20 years, only 27% of actively managed U.S. equity mutual funds outpaced their prospectus benchmarks.3 Research has shown that the under-performance of actively managed funds is relatively consistent across countries, market segments, and time periods. Why does this occur?
The poor results of active managers can be understood as a product of the zero-sum game theory as it applies to financial markets. The theory posits that in any market, the holdings of all participants aggregate to form that market (Sharpe, 1991). Therefore, every dollar of outperformance achieved by one investor in the market is offset by a dollar of underperformance from the others. This would appear to suggest an outperformance probability of 50%. However, the concept assumes no transaction-related costs (or taxes). In reality, these costs can be significant, and they will reduce the returns investors realize over time (Philips et al., 2015). Although both active and index funds are subject to costs, research shows that the expense ratios of actively managed funds are typically higher. Active large-cap equity funds, for example, charge an average of 0.77%; comparable index funds charge 0.11% (Philips et al., 2015).4
One potential counterargument to this powerful concept is that active mutual fund managers do not represent the totality of active investors in a given market. Other investors include, but are not limited to, hedge funds, pension funds, separately managed account managers, and holders of individual securities. If active fund managers were able to systematically outperform their benchmarks before costs, this might compensate for or even outstrip the harmful effects of higher costs. However, Philips et al. (2015) suggests that such an outcome is unlikely and provides evidence that the average active fund manager is unable to compensate for higher costs. Such a fund will still have a higher probability of underperforming relative to passively managed funds.
Another factor impeding success is the lack of persistence among top-performing managers (Philips et al., 2015; Carhart, 1997; Brown and Goetzmann, 1995). It has long been stated that past performance is not indicative of future results, but many investors are still tempted to select mutual funds based on this factor. Philips et al. (2015) confirms that past performance is unreliable when trying to identify active managers who will outperform in the future. And according to significant research, most other quantitative measures of fund attributes or performance (such as fund size, active share, past alpha, etc.) are equally undependable (Wallick, Wimmer, and Balsamo, 2015; Financial Research Corporation, 2002; Philips and Kinniry, 2010; Schlanger, Philips, and LaBarge, 2012).
Although such studies clearly reveal many of the challenges of successful active management, we find that investors’ odds can be improved through the use of low-cost mutual funds.
Low costs: Increasing the chance of success
Many investors search for the quantitative “silver bullet” that would enable them to identify talented managers in advance. In this ongoing search for the perfect metric, many overlook a very good metric that can improve the odds of success: the expense ratio (Wallick, Wimmer, and Balsamo, 2015; Financial Research Corporation, 2002; Kinnel, 2010). A fund’s current expense ratio—a simple and readily available figure—has historically proven to be an effective predictor of relative future fund performance. Intuitively, this approach seems to make sense, because an investor’s return is decreased by every dollar spent on investment-related costs.5 Yet some may argue that higher costs are indicative of a more skilled manager that would be able to overcome this hurdle. Our results suggest otherwise.
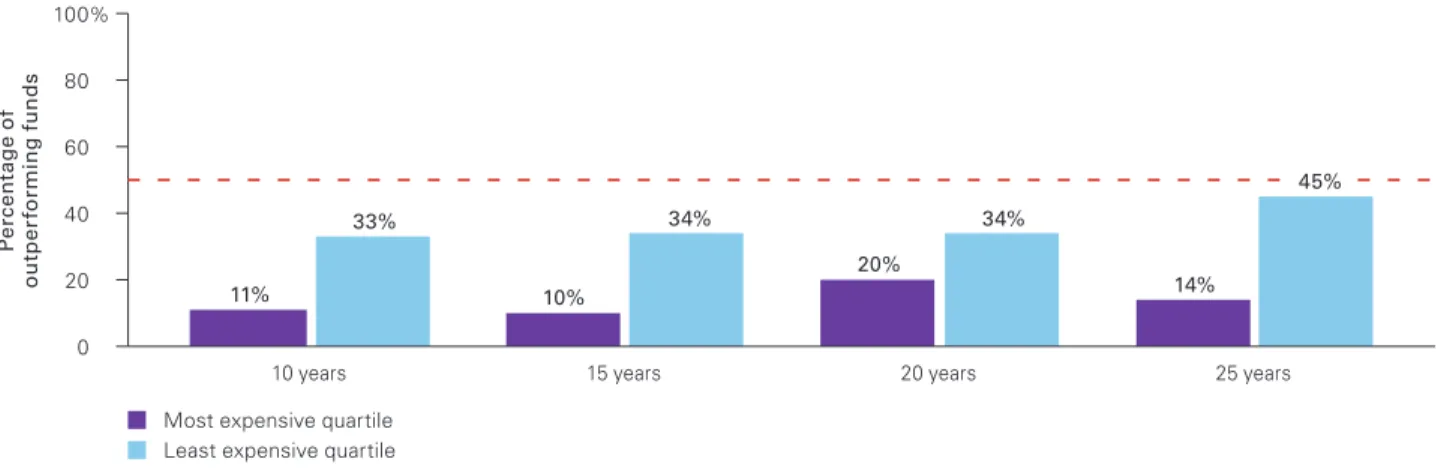
Figure 1 shows the portion of actively managed equity funds that have outperformed their prospectus benchmarks in the United States over various periods. The blue bars indicate funds in the least expensive quartile; the purple bars represent those in the most expensive quartile. Two conclusions can be drawn from this figure. First, each time period shows a clear trend of lower costs leading to higher relative performance. Second, although this trend is favorable for low-cost funds, it does not by itself consistently identify active funds that will outperform. Indeed, if we look at the average of the four overlapping periods, we see that 36% of the funds outperformed their benchmark—still well below 50/50 odds.
It should be noted that the graph is calculated relative to cost-free benchmarks. If we lower the benchmark returns by 20 basis points to compensate for the cost of investing in a low-cost index fund, the probability of the lowest-cost-quartile funds’ success rises from 36% to 40%.
Although low cost has proven to be the most consistent and effective quantitative factor that investors can use (ex-ante) to noticeably improve their odds,6 it does not guarantee results. To give investors the best chance of achieving success using active management, talent is also needed.
6 See Wallick, Wimmer, and Balsamo (2015).
Figure 1. Percentage of actively managed funds that have outperformed their benchmark
Notes: Data are as of December 31, 2014. Because of fees, most index funds also underperform their benchmarks. Our analysis was based on expenses and fund returns for active equity funds available to U.S. investors at the start of each period. The oldest and lowest-cost single share class was used to represent a fund when multiple share classes existed. Each fund’s performance was compared with that of its prospectus benchmark. Funds that were merged or liquidated were considered underperformers for the purposes of this analysis. The following fund categories were included: small-cap value, small-cap growth, small-cap blend, mid-cap value, mid-cap growth, mid-cap blend, large-cap value, large-cap growth, and large-cap blend.
Sources: Vanguard calculations, using data from Morningstar, Inc.
P er ce n ta ge o f o ut p er fo rm in g f u n d s 0 20 40 60 80 100% 25 years 20 years 15 years 10 years 11% 33% 10% 34% 20% 34% 14%
Most expensive quartile Least expensive quartile
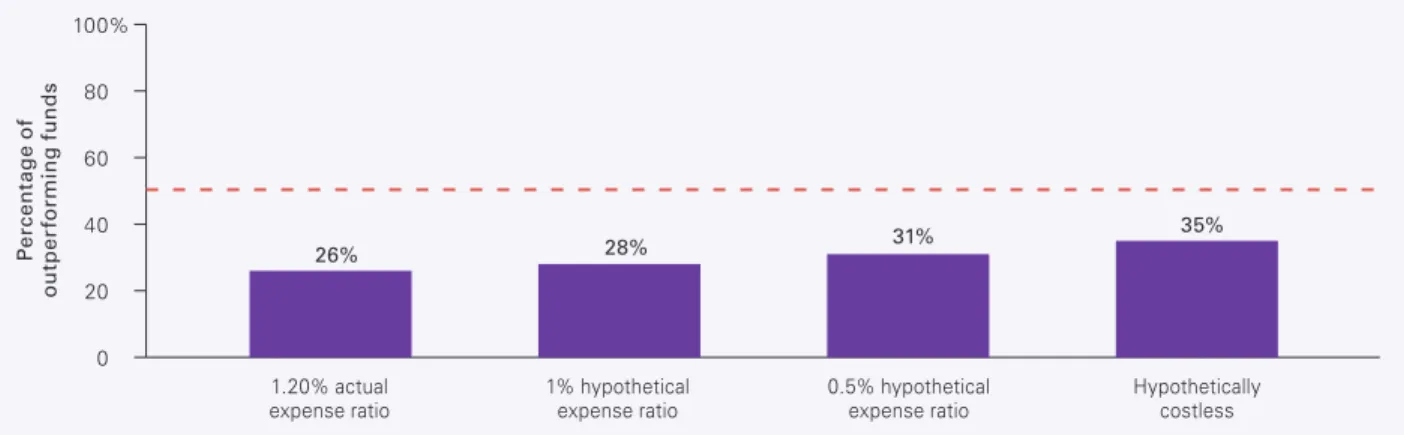
What about institutionally priced funds?
The active equity funds in Figure 1 are based on the nine U.S. style-box categories from the Morningstar database and have an average expense ratio of 1.20%. Some large investors may reasonably question whether the analysis can be applied to their situation given that they have access to lower-cost, institutionally priced funds. To address this valid question, we explored the
outperformance probabilities for all available funds using lower hypothetical expense ratios based on fee levels larger investors might find more relevant.
Figure 2 displays the results. Although the outperformance probabilities, as expected, increase as the hypothetical fund expenses decrease, they are still notably below 50%.
Figure 2. Percentage of funds outperforming their benchmark after applying lower hypothetical expense ratios, 2000–2014
Notes: Data are as of December 31, 2014. The hypothetical expense ratios do not represent the cost of any particular investment; they are examples of price levels that some large institutions might pay to access active strategies. Our study was based on expenses and fund returns for active equity funds available to U.S. investors at the start of the period. The oldest and lowest-cost single share class was used to represent a fund when multiple share classes existed. Each fund’s performance was compared with that of its prospectus benchmark. Funds that were merged or liquidated were considered underperformers for the purposes of this analysis. The following fund categories were included: small-cap value, small-cap growth, small-cap blend, mid-cap value, mid-cap growth, mid-cap blend, large-cap value, large-cap growth, and large-cap blend.
Sources: Vanguard calculations, using data from Morningstar, Inc.
P er ce n ta ge o f o ut p er fo rm in g f u n d s 0 20 40 60 80 100% Hypothetically costless 0.5% hypothetical expense ratio 1% hypothetical expense ratio 1.20% actual expense ratio 26% 28% 31% 35%
7 See John C. Bogle’s The Clash of the Cultures for a fuller look at Mr. Bogle’s discussion of these factors. Vanguard’s Global Investment Committee still uses a similar version of these criteria to select managers for funds with investment styles including fundamental active equity, fundamental active fixed income, quantitative active equity, and quantitative active fixed income.
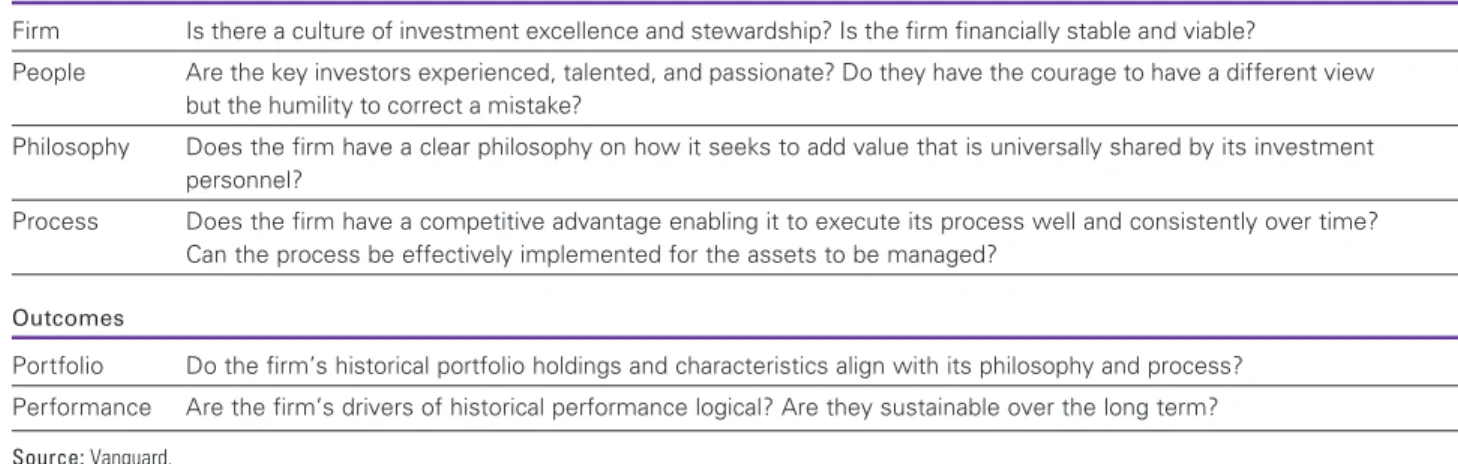
Identifying the best managers
How can investors identify talented managers? Many academic studies have suggested shortcuts for identifying a skilled active manager. But much of the industry has settled on using some variation of the “4 Ps” cited by Vanguard founder Jack Bogle in 1984—people, philosophy, portfolio, and performance.7 As shown in Figure 3, Vanguard still uses a similar version of these criteria. If these indicators are truly effective and so widely used, why has the overall success rate of active managers not been higher? First, the application of the factors is subjective, not formulaic; human judgment and the robustness of the evaluation process can vary widely. Second, the crucial objective is to obtain top talent (those managers who have the skill to outperform) at a low cost. Solving this paradox is not easy, and some organizations face significant structural barriers that impede their ability to do so.
The low-cost/top-talent paradox
Can low cost and superior talent coexist? Presumably, the best managers command higher fees and only more desperate, marginal managers would accept a relatively small fee. Yet Vanguard has been adept at delivering top talent at low cost. The following six specific factors characterize Vanguard’s active management approach. Unique ownership structure helps to provide a decisive cost advantage
The Vanguard Group, Inc., in the United States is the only mutually owned mutual fund company in the asset management business. This distinction is critical. It is owned collectively by the U.S.-domiciled funds it operates. These funds in turn are owned by their shareholders.
Figure 3. Performance drivers and outcomes Performance drivers
Firm Is there a culture of investment excellence and stewardship? Is the firm financially stable and viable?
People Are the key investors experienced, talented, and passionate? Do they have the courage to have a different view but the humility to correct a mistake?
Philosophy Does the firm have a clear philosophy on how it seeks to add value that is universally shared by its investment personnel?
Process Does the firm have a competitive advantage enabling it to execute its process well and consistently over time? Can the process be effectively implemented for the assets to be managed?
Outcomes
Portfolio Do the firm’s historical portfolio holdings and characteristics align with its philosophy and process? Performance Are the firm’s drivers of historical performance logical? Are they sustainable over the long term?
8 See Franger (2012). 9 As of June 30, 2015.
10 Although scale is important in reducing costs, Vanguard’s focus is on adding value. If it is in the best interest of shareholders, we will occasionally close funds rather than concentrating on asset accumulation.
This structure enables the firm to provide its services to the U.S.-domiciled Vanguard funds at cost, devoid of any profit margins built in at other companies. It charges only what it costs to run the funds—never an additional layer of fees to pay someone else’s return on capital. By contrast, a company that has issued public stock or is owned by a small group of private investors is typically obligated to provide a return on the investors’ capital. This additional layer of fees can pose a hurdle to providing low-cost funds.
Flexibility to use internal or external teams
Vanguard’s actively managed funds are overseen by a combination of internal portfolio management teams and a variety of external sub-advisors. In all cases, we select the manager that we believe is best positioned based on a range of considerations. Internal teams are often used when a highly systematic, risk-controlled, disciplined, and typically quantitative approach is needed. On the other hand, it is extremely difficult to build internal teams of portfolio managers, researchers, and analysts to cover a broader, global range of market segments and sectors. These mandates call for specialist knowledge and experience and benefit from the selection of world-class managers. Typically, these experts focus on a particular style of investing, such as in small-caps, emerging markets, or large-cap growth companies. Symmetrical, performance-based fees align manager and client interests
All of Vanguard’s sub-advisors are paid a base fee that equals a percentage of assets managed. The vast majority also have their contracts structured with an incentive fee that rewards them for outperforming the fund’s benchmark. This is rare in the industry; only 3% of all mutual funds offer performance fees.8
The U.S. Securities and Exchange Commission (SEC) mandates that if a manager performance fee is used in a mutual fund, it must be structured symmetrically, with rewards for outperformance and penalties for under-performance. The SEC requires that such fees apply to a minimum of one year of performance; however, Vanguard’s
fees typically cover periods of three to five years. This long-term structure aligns managers’ interests more closely with those of investors.
Large scale that reduces fee levels
Vanguard is the largest user of sub-advisors in the world: 30 of them manage more than $420 billion in active equity mutual fund assets.9 This typically leads to large mandates for each sub-advisor, often starting at $1 billion, with the potential to grow. That offers two major benefits to fund shareholders. First, when sub-advisors manage large sums of money, the absolute dollar value of management fees they receive can be substantial even if percentage-wise they are relatively small.
Second, managers recognize operational benefits. It is much easier to handle a single $1 billion relationship with Vanguard than 20 different $50 million relationships. The potential costs to acquire and service 20 different accounts can be considerable, and managers are acutely aware of this. Overall, our scale reduces costs while also enabling us to attract top talent.10
Long-term perspective attracts talent
Another factor distinctive to Vanguard is the length of time it maintains relationships with talented managers. On average, we engage managers for more than 14 years. This long average tenure, along with large mandates, results in a favorable economic proposition for sub-advisors. Our managers have said they are confident that they will be retained by Vanguard for longer periods than their typical tenure with other firms. The net present value of the cumulative fees they expect to receive from us is greater than what they would expect from relationships that may pay a higher fee but typically do not last as long. As a result, many top-quality managers are eager to advise Vanguard funds even though our annual basis point fees may be lower than what they might otherwise earn.
11 GIC has oversight responsibility, but as is the case with all registered U.S. mutual funds, the board of trustees has the ultimate fiduciary responsibility. CEO-led search and oversight process sustains
long-term perspective
Vanguard has been committed to both active management and indexing ever since we started our manager search process more than 30 years ago. Since then, the Global Investment Committee (GIC), chaired by our CEO and consisting of long-tenured senior executives, has overseen all Vanguard funds as well as the hiring and firing of all managers.11 Only three people have led our search efforts in the past four decades. Today, GIC is supported by more than 20 investment professionals dedicated to the manager oversight and search process. GIC’s long-term stability reduces the potential to overreact to short-term events and promotes manager evaluation continuity. Selection processes that rely on a single decision-maker can increase the likelihood of manager turnover, especially if that decision-maker leaves the firm or changes roles. The continued commitment of long-tenured Vanguard CEOs and senior executives to the process is one of the reasons it has been so consistent through the years.
The “bumpy road” to outperformance
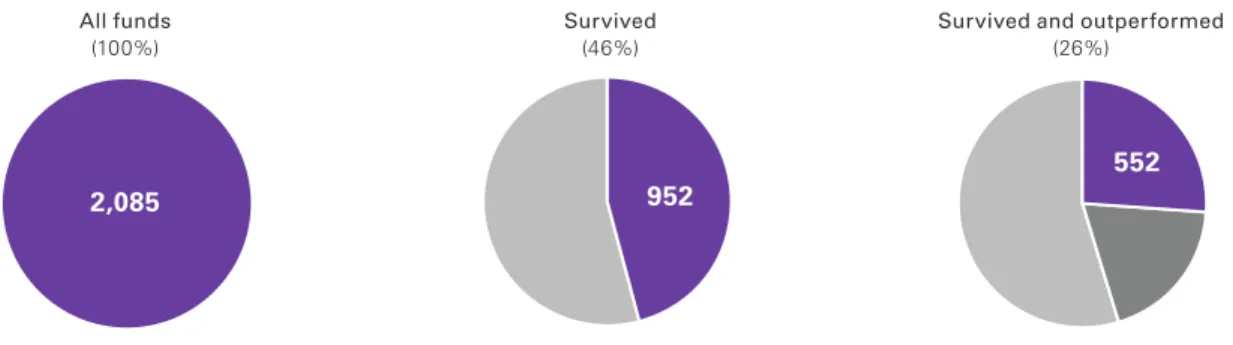
Low costs and a rigorous, thoughtful manager selection process can go a long way to improve results for investors. But those benefits can be eroded significantly if an investor fails to maintain a long-term perspective, because of the inconsistency inherent in returns. Understanding this principle is critical for those who may be tempted to use short-term past performance as a basis for entering and exiting active funds. In addition to confirming the difficulty of selecting a winning manager, our analysis shows that historically, investors have had to be very patient to succeed with active funds.
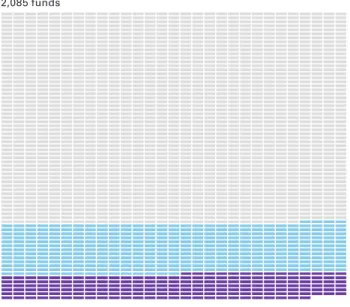
Of the 2,085 active equity funds available to U.S. investors at the start of 2000, only 952 (46%) were still operating 15 years later (as of December 31, 2014). The rest had been either merged or liquidated, often because of poor performance. Of the remainder, just 552 (26% of the original 2,085) managed to outperform their prospectus benchmark during the period (see Figure 4). These findings confirm those of previous research—achieving outperformance is tough.
Figure 4. A small portion of active funds survived and outperformed over 15 years
Notes: Data are as of December 31, 2014. Our analysis was based on expenses and fund returns for active equity funds available to U.S. investors at the start of the period. The oldest and lowest-cost single share class was used to represent a fund when multiple share classes existed. Each fund’s performance was compared with that of its prospectus benchmark. Funds that were merged or liquidated were considered underperformers for the purposes of this analysis. The following fund categories were included: small-cap value, small-cap growth, small-cap blend, mid-cap value, mid-cap growth, mid-cap blend, large-cap value, large-cap growth, and large-cap blend.
Sources: Vanguard calculations, using data from Morningstar, Inc.
2,085 952
552 All funds
Many investors assume that if they are able to select a talented manager, a relatively smooth stream of excess returns awaits. Unfortunately, we find the opposite to be true. Even the most successful funds (the 552 outperformers) experienced frequent and sometimes extended periods of underperformance along the way.
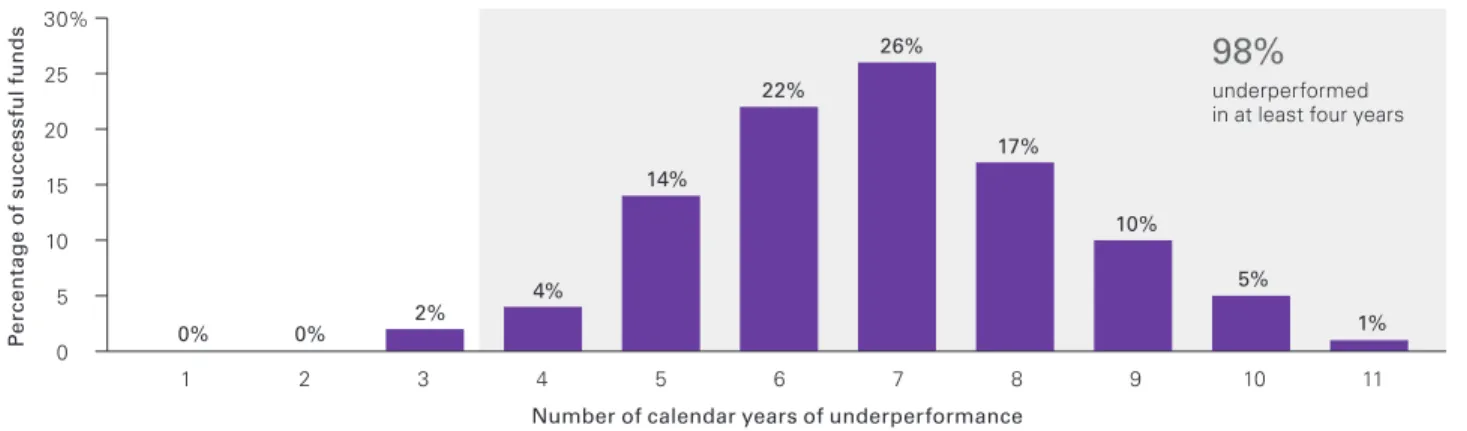
Figure 5 shows the distribution of outperforming funds according to their total number of years of underper-formance. We can see that 543—or 98%—of them lagged their prospectus benchmarks in at least four calendar years. In fact, more than 50% had seven or more years of underperformance.
Figure 5. Even successful funds had multiple periods of underperformance
Distribution of the 552 successful funds by total calendar years of underperformance, 2000–2014
Notes: Data are as of December 31, 2014. Successful funds are those that survived for the 15 years and also outperformed their prospectus benchmarks. Our analysis was based on expenses and fund returns for active equity funds available to U.S. investors at the start of the period. The oldest and lowest-cost single share class was used to represent a fund when multiple share classes existed. Each fund’s performance was compared with that of its prospectus benchmark. Funds that were merged or liquidated were considered underperformers for the purposes of this analysis. The following fund categories were included: small-cap value, small-cap growth, small-cap blend, mid-cap value, mid-cap growth, mid-cap blend, large-cap value, large-cap growth, and large-cap blend. Numbers do not add up to 100% because of rounding.
Sources: Vanguard calculations, using data from Morningstar, Inc. 0 5 10 15 20 25 30% 0% 0% 2% 4% 14% 22% 26% 17% 10% 5% 1% underperformed in at least four years
98%
P er ce n ta ge o f s uc ce ss fu l f u n d s 1 2 3 4 5 6 7 8 9 10 11But what about consecutive years of underperformance? Investors may be able to withstand individual periods of poor results scattered over a 15-year time frame. But for many, three consecutive bad years is the breakpoint after which they will divest the fund. This can occur for an explicit reason (for example, a requirement in an investment policy statement) or because it violates some mental rule of thumb (such as an assumption that the results indicate an unskilled manager). Figure 6 shows the portion of the original 552 funds that survived for 15 years, beat their benchmarks, and avoided three consecutive years of underperformance. The results are pronounced: Only 185—or 9%—of the initial 2,085 funds met these criteria.
Our findings strongly suggest that investors should refrain from using short-term results as a primary criterion for divesting (or investing in) an active equity fund. Short-term underperformance can still accompany long-term outperformance.
Investors interested in pursuing active management should understand that to increase the odds of success, they must be willing and able to endure numerous, potentially extended periods during which their fund will lag its benchmark. As mentioned previously, this long-term focus is an important principle in the selection and monitoring process of Vanguard’s active equity sub-advisors.
Figure 6. Few funds avoided three consecutive years of underperformance
Notes: Data are for the 15-year period ended December 31, 2014. Our analysis was based on expenses and fund returns for active equity funds available to U.S. investors at the start of the period. The oldest and lowest-cost single share class was used to represent a fund when multiple share classes existed. Each fund’s performance was compared with that of its prospectus benchmark. Funds that were merged or liquidated were considered underperformers for the purposes of this analysis. The following fund categories were included: small-cap value, small-cap growth, small-cap blend, mid-cap value, mid-cap growth, mid-cap blend, large-cap value, large-cap growth, and large-cap blend.
Sources: Vanguard calculations, using data from Morningstar, Inc.
2,085 funds
Survived, outperformed, and experienced at least three consecutive years of underperformance 18% 367 funds
Survived, outperformed, and never experienced three consecutive years of underperformance 9% 185 funds
12 This figure represents stand-alone active equity funds available to all U.S. investors. It includes both fundamental and quantitative active management strategies. It does not include funds of funds, which are composed of individual Vanguard active equity mutual funds, or funds that were offered exclusively to institutional investors. The returns for eight funds that were merged or liquidated during the period have been included in the performance calculations for Figures 7 and 8.
Vanguard’s active management results
The prior sections covering Vanguard’s active manage-ment philosophy of low costs, top talent, and patience do not, by themselves, demonstrate that the company has successfully executed this philosophy. Evidence of this success can be found in our track record. A deeper analysis of this performance follows.
The client experience
From 1985 to 2014, Vanguard offered 37 U.S.-domiciled actively managed equity mutual funds.12 We used three different methodologies to weight the impact of each fund’s results. First, we weighted each fund equally to analyze the performance of the complete lineup. This represented the perspective of an investor with an equal opportunity or willingness to invest in any of the funds. Second, we measured performance on an asset-weighted basis (funds with more assets under management were given more weight than those with fewer assets). This portrayed the most common client experience, because an investor is more likely to be invested in a large fund than in a small fund. Third, we weighted the funds according to Vanguard portfolio-construction guidelines of market proportionality. This approach excluded specialty funds and accounted for large-, mid-, and small-cap funds based on their approximate proportion of the overall market. It also incorporated non-U.S. funds to the degree suggested by Vanguard for U.S.-based investors (10% to 30%, depending on the year). The results of these methodologies differed substantially at times because assets under management do not always align with a fund’s weight in an equal- or market-cap-weighted portfolio.
Gauging Vanguard’s performance
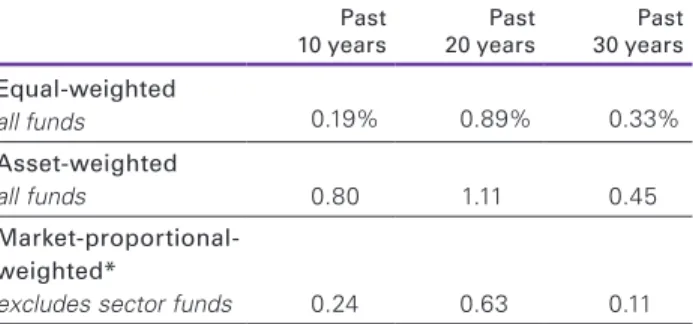
As Figure 7 illustrates, according to all three weighting methodologies, Vanguard provided investors with positive excess returns for the full 30-year term. An equal-weighted portfolio produced 0.33% of annualized excess return relative to the funds’ benchmarks. On an asset-weighted basis, that return was 0.45%. On a market-proportional basis, it was 0.11%. These calculations include all U.S.-domiciled Vanguard active equity funds that existed during the analysis period, whether or not they survived the entire time.
Figure 7. Annualized excess returns of Vanguard active equity funds over their stated benchmarks, net of fees, 1985–2014
Past
10 years 20 yearsPast 30 yearsPast Equal-weighted all funds 0.19% 0.89% 0.33% Asset-weighted all funds 0.80 1.11 0.45 Market-proportional-weighted*
excludes sector funds 0.24 0.63 0.11
The performance data shown represent past performance, which is not a guarantee of future results. Investment returns and principal value will fluctuate, so investors’ shares, when sold, may be worth more or less than their original cost. Current performance may be lower or higher than the performance data cited. For performance data current to the most recent month-end, visit our website at www.vanguard.com/performance. The performance of an index is not an exact representation of any particular investment, as you cannot invest directly in an index.
* The market-proportional-weighted methodology weights the underlying funds according to the approximate Vanguard portfolio-construction guidelines that existed at the time. See Appendix II for additional detail.
Notes: The performance of each Vanguard fund was compared with its stated benchmark using monthly return data from January 1985 through December 2014. Returns for all non-U.S., global, and domestic large-, mid-, and small-cap Vanguard active equity funds, including those that were merged or liquidated during the period, were included. The active equity portions of our balanced funds were excluded. Specialty funds were included in the equal-weighted and asset-weighted portfolios but not in the market-proportional portfolios. In our calculations, the portfolios of Vanguard active equity funds were assumed to be rebalanced monthly to their target weights (as determined by the equal-weighting, asset-weighting, and market-proportional-weighting methodologies). All fund performance data are net of fees.
13 See Goyal and Wahal (2008) for a further discussion of this topic.
14 In discussing our analysis and the research performed by others, we use the term “excess return” to refer to the difference between the geometric returns of active funds and their benchmarks. We use the term “alpha” to refer to the outperformance of active funds calculated using a regression model.
15 Four notable published studies assess Vanguard’s active funds: Reinker and Tower (2004) and Rodriguez and Tower (2007) conducted excess return studies comparing the synthetic portfolios of Vanguard funds with synthetic portfolios of index funds. Kizer (2005) ran an analysis using the Fama-French three-factor model, and Blanchett (2010) performed several analyses using the Carhart four-factor model, a return-based style analysis, and various other methods. Reinker and Tower (2004) found that an asset-weighted portfolio of Vanguard active U.S. equity funds outperformed a portfolio of U.S. index funds by an average annualized amount of 1.02% from 1977 through 2003. The same study calculated the excess returns of Vanguard active non-U.S. equity funds versus a portfolio of non-U.S. index funds to be 0.71% for the period from 1991 through 2003. Kizer (2005) argued that when adjusted for the size and style overweightings inherent in an asset-weighted portfolio of Vanguard active funds, these results are less favorable. Using the Fama-French three-factor model, he calculated the difference in performance between Vanguard active equity funds and index equity funds to be –0.21% per year from 1977 through 2003, but that amount is statistically insignificant. Rodriguez and Tower (2007) found that a portfolio of Vanguard active equity funds outperformed a portfolio of index funds by 0.46% annually from 2003 through 2006. However, this result was not statistically significant at the 95% confidence level. Blanchett (2010) used seven different tests of three groups each to calculate alpha from 1975 through 2008. Averaged together, the results had a statistically significant annualized alpha of 1.08%; each of the groups in all seven tests showed a positive alpha.
16 This methodology is similar to that used in Figure 7, except that we shortened the analysis period to 15 years and excluded specialty funds based on the availability of quality data for non-Vanguard funds.
This analysis compares the Vanguard active funds with their costless benchmarks. If we assume an index fund was available for every costless benchmark at a fee of 20 basis points, the annualized benefits increase to approximately 0.53% on an equal-weighted basis, 0.65% on an asset-weighted basis, and 0.31% on a market-proportional basis.
The pattern of returns
Although calculations for the entire period are positive using each weighting approach, it is worth reiterating that this does not imply that for each quarter, year, or even decade, clients experienced a positive result. There can be extended periods of time when managed funds underperform or are relatively neutral compared with their benchmarks.
We conclude that if a fund or group of funds is able to beat the odds and produce excess returns in the long term, those returns will only be captured by investors who stay committed. Timing markets or managers decreases the chance of success.13 It’s better for investors to identify low-cost providers able to engage top talent and then hold their actively managed funds for a long time.
Other studies have found similar results We conducted our analysis using excess return— comparing a fund to its costless benchmark. Others might suggest that an assessment of alpha would be valuable.14 The former method simulates an actual investor’s experience, whereas the latter could determine whether the source of the excess return was security selection or factor tilts. Both analyses have their benefits, and both have been studied by other researchers.
Reinker and Tower (2004) and Rodriguez and Tower (2007) found that Vanguard funds delivered positive excess returns. Kizer (2005) challenged their findings, but the results of each of these studies lacked statistical significance. Blanchett (2010) conducted seven different alpha tests on three different groups of Vanguard funds between 1975 and 2008 (making it the longest academic study conducted) and found sizable positive alpha that was statistically significant. Averaging the seven assess-ments across all three test groups, he found that, on average, Vanguard funds produced an annual average positive alpha of 1.08%.15
Comparisons with other funds
When we compared U.S.-domiciled Vanguard actively managed funds with other U.S.-domiciled active funds, data availability on non-Vanguard funds restricted us to one approach.16 We used 15 years of data to compare both Vanguard and non-Vanguard active funds categorized in Morningstar’s nine U.S. style boxes or three broad non-U.S. categories with their primary prospectus
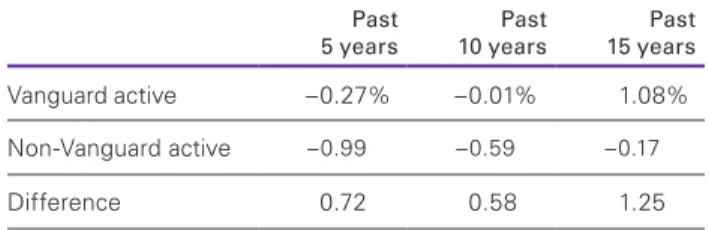
benchmarks. Because we included funds that were merged or liquidated during the period, our results are free of survivorship bias. The summary results of our analysis show the median excess returns for two groups of funds—Vanguard active and non-Vanguard active. This process excluded funds that did not align with the Morningstar style-box categories, such as specialty funds. For the 15 years ended December 31, 2014, the median return of Vanguard active funds compares favorably with that of other actively managed funds. Figure 8 displays the 5-, 10-, and 15-year results. The excess return of the median Vanguard fund outperformed the median excess return of the non-Vanguard fund by 1.25% annually over the past 15 years. For the ten-year period, the Vanguard fund beat the median non-Vanguard active fund by 0.58% annually, and for the five-year period, it outperformed by 0.72%.
17 The average Vanguard fund expense ratio calculation is an weighted average of all share classes. The average index fund and active fund expense ratio calculations are equal-weighted averages of all share classes of non-Vanguard index funds and active funds domiciled in the United States. (Vanguard calculations, using data from Morningstar, Inc.) 18 The relationship among funds was similar for the ten-year period ended December 31, 2014. During this time, the median active Vanguard performance was –0.01%, with a distribution of
0.88% to –0.72% (for the 75th and 25th percentiles). All other active funds had a median performance of –0.59%, with a distribution of 0.47% (75th percentile) to –1.68% (25th percentile). Index funds had a median performance of –0.25%, with a distribution of –0.08% (75th percentile) to –0.51% (25th percentile). The same analysis over five years showed the median Vanguard performance as –0.27%, with a distribution of 0.92% (75th percentile) to –1.05% (25th percentile). All other active funds’ performance was –0.99%, with a distribution of 0.36% (75th percentile) to –2.41% (25th percentile). Index fund performance was –0.28%, with a distribution of –0.15% (75th percentile) to –0.54% (25th percentile). See Appendix III for more information.
Overall, the median Vanguard active equity fund has outperformed the median non-Vanguard active equity fund over the past 5-, 10- and 15-year periods by
substantial amounts. Vanguard active funds also performed well relative to low-cost index funds, which generally trail their benchmarks by 10 to 30 basis points. A focus on keeping costs low, finding skilled managers, and being patient has helped drive superior performance. Low costs are the key to lowering the hurdle talented managers need to clear. As of December 31, 2014, the average Vanguard active equity fund charged 0.37%. According to Morningstar data, this is less expensive than 75% of U.S.-domiciled equity index funds and an astounding 99% of U.S.-domiciled active equity funds.17
The previous analyses have all dealt with median results. It is important to note that the dispersion of returns is typically quite different for Vanguard active funds, non-Vanguard active funds, and indexed funds. A dispersion analysis shows that for the 15-year period, the median excess return for Vanguard active funds was 1.08%, but the 75th- and 25th-percentile outcomes ranged from 2.26% to 0.27%. The range of results for all other active funds was an even wider 1.40% to –1.66% because of greater dispersion of both returns and fees. Index funds had a much tighter range of –0.13% to –0.51%.18 The median excess return for Vanguard active funds has been superior, but that success has come with a wider dispersion of possible results relative to index funds.
Conclusion
We believe that successful active management is driven by the combination of low cost, top talent, and patience. It is intuitive that lower fees should make it easier to outperform a benchmark, but low costs alone cannot guarantee success. On average, most active managers have lagged their benchmarks; those that have surpassed them over long periods are rare. Herein lies an apparent paradox: In order to achieve success, investment companies must engage rare talent at a low cost. Despite this seemingly difficult hurdle, Vanguard has been able to deliver actively managed equity fund results. Over long periods, the median Vanguard active equity fund has outperformed its costless benchmark as well as the median non-Vanguard active equity fund. Whether they are successful or not, active funds come with volatility that can affect investors in two ways. First, they may underperform their benchmarks or comparable index funds for long periods. Second, even when a group of funds does well, individual funds within it can still do poorly. Individual fund selection will influence an investor’s results.
Because of this volatility, only those investors with the patience to withstand what could be extensive periods of underperformance should consider actively managed funds. Timing managers is as counterproductive as timing markets. Instead, investors must be able to obtain top talent at low cost and have the discipline to stick with it over the long term.
In the end, we find that the most crucial factor is low cost. Indexing has, to many, become synonymous with low cost. But the historical data actually show a more nuanced reality—low cost can improve an investor’s odds of success with both active and indexed funds. Figure 8. Median annualized excess returns, net of fees
Past
5 years 10 yearsPast 15 yearsPast
Vanguard active –0.27% –0.01% 1.08% Non-Vanguard active –0.99 –0.59 –0.17
Difference 0.72 0.58 1.25
Notes: Analysis included U.S. and non-U.S. equity funds (excluding sector/ specialty funds) for the 15-year period ended December 31, 2014. Active funds were compared with their prospectus benchmarks.
References
Adams, John C., Sattar Mansi, and Takeshi Nishikawa, 2011.
Public vs Private Ownership, Board Structure and Fund Manager Turnover; available at SSRN: http://ssrn.com/abstract=1492846 or http://dx.doi.org/10.2139/ssrn.1492846.
Blanchett, David M., 2010. Exploring the “Good Guys”: An Empirical Study of Vanguard’s Actively Managed Domestic Equity Mutual Funds. The Journal of Investing 19(2): 39–48. Bogle, John C., 2012. The Clash of the Cultures: Investment vs. Speculation. Hoboken, N.J.: John Wiley & Sons.
Brown, Stephen J., and William N. Goetzmann, 1995. Performance Persistence. The Journal of Finance 50(2): 679–698.
Carhart, Mark M., 1997. On Persistence in Mutual Fund Performance. The Journal of Finance 52(1): 57–82.
Fama, Eugene F., and Kenneth R. French, 2010. Luck Versus Skill in the Cross-Section of Mutual Fund Returns. The Journal of Finance 65(5): 1915–1947.
Financial Research Corporation, 2002. Predicting Mutual Fund Performance II: After the Bear. Boston: Financial Research Corporation.
Franger, Sasha, 2012. Performance Incentive Fee Funds Post Downturn. Denver: Thomson Reuters Co.
Goyal, Amit, and Sunil Wahal, 2008. The Selection and Termination of Investment Management Firms by Plan Sponsors. The Journal of Finance 63(4): 1805–1847.
Jones, Robert C., and Russ Wermers, 2011. Active Management in Mostly Efficient Markets. Financial Analysts Journal 67(6): 29–45.
Kinnel, Russel, 2010. How Expense Ratios and Star Ratings Predict Success. Morningstar Fund Investor Volume 18, Number 12.
Kizer, Jared, 2005. Index Fundamentalism Revisited—Redux.
The Journal of Portfolio Management 31(2): 112–119. Malkiel, Burton G., 2004. Can Predictable Patterns in Market Returns Be Exploited Using Real Money? The Journal of Portfolio Management (30th Anniversary Issue): 131–41.
Molitor, Jeffrey S., 2008. Evaluating Managers: Are We Sending the Right Messages? Valley Forge, Pa.: The Vanguard Group. Philips, Christopher B., Francis M. Kinniry Jr., and David J. Walker, 2014. The Active-Passive Debate: Market Cyclicality and Leadership Volatility. Valley Forge, Pa.: The Vanguard Group.
Philips, Christopher B., and Francis M. Kinniry Jr., 2010. Mutual Fund Ratings and Future Performance. Valley Forge, Pa.: The Vanguard Group.
Philips, Christopher B., Francis M. Kinniry Jr., David J. Walker, Todd Schlanger, Joshua M. Hirt, 2015. The Case for Index- Fund Investing. Valley Forge, Pa.: The Vanguard Group. Reinker, Kenneth S., and Edward Tower, 2004. Index Fundamentalism Revisited. The Journal of Portfolio Management Summer 2004, Vol. 30, No. 4: pp. 37–50. Reinker, Kenneth S., and Edward Tower, 2005. Are Vanguard’s Managers Good Stock-Pickers or Style-Pickers? The Journal of Porfolio Management 31(3): 109–111.
Rodriguez, Abel, and Edward Tower, 2007. Do Vanguard’s Managed Funds Beat Its Index Funds? Looking for Prescient Stock and Style Selection. Duke University; available at http://public.econ.duke.edu/Papers/PDF/Do_Vanguard18.pdf. Schlanger, Todd, Christopher B. Philips, and Karin Peterson LaBarge, 2012. The Search for Outperformance: Evaluating ‘Active Share.’ Valley Forge, Pa.: The Vanguard Group.
Sharpe, William F., 1991. The Arithmetic of Active Management.
Financial Analysts Journal 47(1): 7–9.
Sharpe, William F., 1992. Asset Allocation: Management Style and Performance Measurement. The Journal of Portfolio Management 18(2): 7–19.
Wallick, Daniel W., Brian R. Wimmer, and James J. Balsamo, 2015. Shopping for Alpha: You Get What You Don’t Pay For. Valley Forge, Pa.: The Vanguard Group.
Wallick, Daniel W., Brian R. Wimmer, and James D. Martielli, 2013. The Case for Vanguard Active Management: Solving the Low-Cost/Top-Talent Paradox? Valley Forge, Pa.: The Vanguard Group.
Appendix I. Expense ratio impact, 2014
Notes: Data are for the year ended December 31, 2014, and include U.S. and non-U.S. equity funds (excluding sector/specialty funds). Vanguard active funds included in this data set had a 95th percentile of –0.20%, 75th percentile of –0.29%, 50th percentile of –0.36%, 25th percentile of –0.43%, and 5th percentile of –0.60%. Non-Vanguard active funds had a 95th percentile of –0.72%, 75th percentile of –1.05%, 50th percentile of –1.34%, 25th percentile of –1.75%, and 5th percentile of –2.35%.
Sources: Vanguard calculations, using data from Morningstar. Vanguard
active Non-Vanguardactive
–2.50 –2.00 –1.50 –1.00 –0.50 0% 5th 95th Percentiles key: 75th 25th Median
Appendix II. Weights used for Vanguard funds in the market-proportional analysis
The fund category weights used in the analysis are intended to approximate Vanguard’s portfolio construction guidelines over the last three decades.
Market-proportional weights (with 0% sector funds)
January 1985–December 1993 January 1994–December 2003 January 2004–December 2014
Large-cap value 35.00% 31.25% 27.50%
Large-cap growth 35.00 31.25 27.50
Mid- and small-cap value 10.00 8.75 7.50
Mid- and small-cap growth 10.00 8.75 7.50
International 10.00 20.00 30.00
Sector 0.00 0.00 0.00
Note: These portfolios are hypothetical and do not represent any particular mutual fund.
Appendix III. Annualized excess returns
Notes: Data are for the five-year period ended December 31, 2014. Our analysis used expenses and fund returns for active equity funds available to U.S. investors at the start of each analysis period. The returns for all non-U.S. (developed international markets, diversified emerging markets, and global stock) funds, as categorized by Morningstar (excluding sector/specialty funds), and domestic large-, mid-, and small-cap Vanguard active equity funds, including those that were merged or liquidated during the period, were included in the performance calculations. The oldest and lowest-cost single share class was used to represent a fund when multiple share classes existed. Each fund’s performance was compared with that of its prospectus benchmark. Vanguard active funds included in this data set had a 95th percentile of 2.80%, 75th percentile of 0.92%, 50th percentile of –0.27%, 25th percentile of –1.05%, and 5th percentile of –1.47%. Non-Vanguard active funds had a 95th percentile of 2.56%, 75th percentile of 0.36%, 50th percentile of –0.99%, 25th percentile of –2.41%, and 5th percentile of –4.92%.
Sources: Vanguard calculations, using data from Morningstar, Inc. –6 –4 –2 0 2 4% Vanguard
active Non-Vanguardactive
5th 95th Percentiles key: 75th 25th Median Five-year excess returns net of fees
Notes: Data are for the ten-year period ended December 31, 2014. Our analysis used expenses and fund returns for active equity funds available to U.S. investors at the start of each analysis period. The returns for all non-U.S. (developed international markets, diversified emerging markets, and global stock) funds, as categorized by Morningstar (excluding sector/specialty funds), and domestic large-, mid-, and small-cap Vanguard active equity funds, including those that were merged or liquidated during the period, were included in the performance calculations. The oldest and lowest-cost single share class was used to represent a fund when multiple share classes existed. Each fund’s performance was compared with that of its prospectus benchmark. Vanguard active funds included in this data set had a 95th percentile of 2.42%, 75th percentile of 0.88%, 50th percentile of –0.01%, 25th percentile of –0.72%, and 5th percentile of –1.57%. Non-Vanguard active funds had a 95th percentile of 2.17%, 75th percentile of 0.47%, 50th percentile of –0.59%, 25th percentile of –1.68%, and 5th percentile of –4.23%.
Sources: Vanguard calculations, using data from Morningstar, Inc. –5 –4 –3 –2 –1 0 1 2 3% Vanguard
active Non-Vanguardactive
5th 95th Percentiles key: 75th 25th Median Ten-year excess returns net of fees
Notes: Data are for the 15-year period ended December 31, 2014. Our analysis used expenses and fund returns for active equity funds available to U.S. investors at the start of each analysis period. The returns for all non-U.S. (developed international markets, diversified emerging markets, and global stock) funds, as categorized by Morningstar (excluding sector/specialty funds), and domestic large-, mid-, and small-cap Vanguard active equity funds, including those that were merged or liquidated during the period, were included in the performance calculations. The oldest and lowest-cost single share class was used to represent a fund when multiple share classes existed. Each fund’s performance was compared with that of its prospectus benchmark. Vanguard active funds included in this data set had a 95th percentile of 4.21%, 75th percentile of 2.26%, 50th percentile of 1.08%, 25th percentile of 0.27%, and 5th percentile of –0.68%. Non-Vanguard active funds had a 95th percentile of 3.95%, 75th percentile of 1.40%, 50th percentile of –0.17%, 25th percentile of –1.66%, and 5th percentile of –5.77%.
Sources: Vanguard calculations, using data from Morningstar, Inc. –8 –6 –4 –2 0 2 4 6% Vanguard
active Non-Vanguardactive
5th 95th Percentiles key: 75th 25th Median Fifteen-year excess returns net of fees
Appendix IV. What about taxes?
This paper’s analysis excludes a consideration of taxes. Any investor subject to taxes, however, should be cognizant of not only the costs to manage funds but also their tax consequences. We used Morningstar tax cost ratios to approximate the total annualized impact of taxes on an investor’s long-term returns. As shown in the figure at right, we found two key results. First, the impact of taxes on individual investors can be considerable. Second, the favorable difference between Vanguard funds and other funds is similar to that of their pre-tax returns. Non-Vanguard active equity funds had a median tax cost ratio of –0.92%, and Vanguard active equity funds had a median tax cost ratio of –0.74%— an 0.18% difference (annually) over the 15-year period. It should be noted that these results cover only one specific period and will differ in others. The tax cost ratios are influenced by four factors: the funds’ expense ratios, investor tax rates, a manager’s ability to most efficiently manage changes in the portfolio, and the impact of an active manager’s talent on the performance of its fund versus a benchmark. All of these factors can change over time. Investors subject to taxes might consider applying an asset location strategy of placing actively managed funds in tax-deferred accounts when available.
Notes: Data are for the 15 years ended June 30, 2015, the maximum time period available from Morningstar. This analysis uses data for 18 Vanguard active funds and 1,190 non-Vanguard active funds for which Morningstar data were obtainable. It incorporates nine domestic open-end equity mutual fund categories as well as U.S.-domiciled developed international markets, diversified emerging markets, and global stock funds as categorized by Morningstar (excluding sector/specialty funds). Because tax cost ratios are only available for funds existing during the full period, funds that were merged or liquidated are excluded. Funds are compared relative to their prospectus benchmarks. Morningstar tax cost is calculated using the SEC-maintained method, which requires using the highest individual tax bracket. If a lower tax rate were used, presumably the tax cost would be proportionally less. Vanguard active funds included in this data set had a 95th percentile of –0.58%, 75th percentile of –0.68%, 50th percentile of –0.74%, 25th percentile of –0.98%, and 5th percentile of –1.24%. Non-Vanguard active funds had a 95th percentile of –0.24%, 75th percentile of -0.61%, 50th percentile of –0.92%, 25th percentile of –1.23%, and 5th percentile of –1.74%.
Source: Morningstar, Inc. –2.00 –1.50 –1.00 –0.50 0% Vanguard
active Non-Vanguardactive
5th 95th Percentiles key: 75th 25th Median Fifteen-year annualized tax cost ratios,
© 2015 The Vanguard Group, Inc. All rights reserved.
Connect with Vanguard
™>
global.vanguard.com (non-U.S. investors)
The information contained herein does not constitute an offer or solicitation and may not be treated as such in any jurisdiction where such an offer or solicitation is against the law, or to anyone to whom it is unlawful to make such an offer or solicitation, or if the person making the offer or solicitation is not qualified to do so.
For Institutional or Accredited Investor Use Only. Not For Public Distribution.