Taking Action to Protect
Sensitive Data
Benchmark Research Report
Contents
Executive summary . . . .1
Key findings . . . .1
Implications and analysis . . . .3
Recommendations for action . . . .4
Key findings . . . .5
Unconfirmed reports of sensitive data loss . . . .6
Data loss results: confirmed losses of sensitive data . . . .6
Which data are most sensitive? . . . .7
Leading causes of data loss . . . .11
The primary channels for sensitive data loss . . . .14
Responding to the challenge of protecting sensitive data . . . .15
Strategic actions to protect sensitive data . . . .17
Better results: more frequent monitoring and measurement . . . .18
Time allocated to protecting sensitive data . . . .20
IT controls and sensitive data losses . . . .21
Lost data: lost revenues, lost customers and additional expenses . . . .22
Benefits of protecting sensitive data . . . .23
Recommendations for action . . . .25
Author profile . . . .26
Research methodology . . . .26
Appendix . . . .28
Data losses in the U.S. since ChoicePoint . . . .28
Executive summary
Key findings
Extent of the data loss problem
When it comes to data losses, not all organizations are alike: some are experiencing only a few while others are suffering from many losses of sensitive data. The benchmark shows that: • About one in ten—twelve percent—organizations are experiencing fewer than two losses
of sensitive data each year
• The vast majority of organizations, almost seven in ten—68 percent—are experiencing six losses of sensitive data annually
• A fairly sizable two in ten organizations—twenty percent—are suffering from 22 or more sensitive data losses per year
The type of data being lost, stolen or destroyed
The most sensitive losses are for data that is stolen, leaked or destroyed and includes: • Customer data
• Financial data • Corporate data • Employee data • IT security data
Leading causes of data loss
The leading causes of sensitive data loss are due to three primary problems that include: • User errors
• Violations of policy
• Internet threats, attacks and hacks.
Primary channels through which data are being lost
The primary conduits through which sensitive data are being lost include: • PCs, laptops and mobile devices
• Email, instant messaging and other electronic channels • Applications and databases and the systems these operate on
Financial impacts of data loss
The average financial losses and costs being experienced by organizations from stolen and lost data that are publicly reported include:
• A loss of customers amounting to eight (8) percent
• A commensurate loss of revenue amounting to eight (8) percent
• $100 in expenses per customer record to notify customers and restore data that has been lost, stolen or destroyed
Key findings (continued)
Taking action to reduce financial and sensitive data losses
Actions proven to mitigate and reduce data loss that are being taken by firms with the fewest data losses, include:
• Measuring actual data losses
• Identifying the most critical sensitive data, including IT security and regulatory audit data • Modifying policies and procedures
• Making data protection everyone’s business
• Inventorying IT controls, especially those for PCs, laptops, mobile field devices, Email, Web, Internet channels, applications and databases
• Employing many different IT controls to mitigate data loss, destruction, and theft • Weekly monitoring and reporting on the effectiveness of controls and procedures
Use of multiple IT controls
Instead of being fixated on one IT control, such as cryptography to protect data on laptops, best-in-class organizations are employing multiple technologies, including: audit, measurement and reporting tools, network access controls, application, server and PC access controls, Internet threat controls, data protection and cryptography tools, and data archive and restore systems among others.
Organizations with higher losses of sensitive data are either employing a limited selection of IT controls or are not using IT controls to help reduce sensitive data loss.
The business benefits of protecting sensitive data
The primary business benefits of protecting sensitive data include: • Assurance of integrity for the company brand and image • Lowered concerns about electronic theft
• Improvements in customer loyalty and retention • Fewer customer defections
• Lower revenue losses
Implications and analysis
Only 12 percent of organizations—about one in ten—are experiencing fewer than three losses of sensitive data in the past year. For all other institutions—almost 90 percent— data loss rates are higher.
The leading organizations—those with the fewest losses of sensitive data—are spending more time, employing multiple IT controls, and monitoring compliance with their policies weekly, to significantly reduce the loss of sensitive data. In fact, leading organizations are uniquely:
• Employing multiple IT controls to help protect sensitive data
• Monitoring and measuring controls and procedures to protect data once every four days While best-in-class organizations are monitoring and measuring controls and procedures to protect sensitive data once a week, most firms are conducting such measurements only once in a blue moon: at best, once every 176 days. Furthermore, all other organizations are either ignoring the use of IT controls to protect sensitive data or are selectively employing only a few. In this day of instantaneous electronic information exchange and 24x7x365 Internet-connectivity, infrequent monitoring and under utilized IT controls will likely contribute to more instances of sensitive data loss.
Also unique among the leading firms—those with the lowest data losses—are two types of non-core business data that are considered to be among their most sensitive data: • IT security data
• Regulatory audit and reporting data
Unfortunately, the leading organizations are in a distinct minority when it comes to protecting sensitive data, including IT security and regulatory audit data. Failing to pro-tect IT security and regulatory audit data can be compared to a bank giving away the combination to the vault. And yet, that is exactly what most organizations are doing. Worse still, without sufficient controls in place, most organizations are shining a spotlight on the location of the vault, helping thieves tiptoe their way in and out to complete a burglary without being detected. Instead of securities and cash: organizations with sensitive data losses are putting the business as well as customer data at risk. Based on the experiences of leading organizations, the decision to protect sensitive data represents far less risk—and far less cost—than would be required to remedy a data breach: to find and replace lost customers, lost revenue, not to mention the substantial damage to the image of the organization and its brand.
Recommendations for action
Based on the benchmark results, the key recommendations for improving data protection include:
Sensitive data
• Identify the sensitive core business data of your organization
• Include IT security and regulatory audit data as sensitive data that must be protected
Root causes
Resolve to mitigate the biggest causes of data loss:
• User errors
• Violations of policy
• Internet threats, attacks and hacks
Monitoring of controls and procedures
Focus on monitoring the controls and procedures of the primary channels for lost sensitive data, including:
• Data residing on PCs, laptops and mobile devices
• Data leaking through email, instant messaging and other electronic channels
• Data that is accessible through applications and databases
Frequency of controls and procedure measurements
Increase the frequency of audit, measurements and monitoring of the primary conduits and the critical data protection controls and procedures to weekly.
Whether an organization has only a few losses or more than 20 losses per year, the pipelines for data loss are nearly identical:
• Data residing on PCs, laptops and other mobile devices
• Data leaking through email, instant messaging and other electronic channels
• Data that is accessible through applications and databases
Technologies
Place bets on multiple IT control baskets to protect data, especially the following: • Auditing, measurement and reporting tools
• Network access controls
• Application, server and PC access controls • Internet threat controls
• Data protection and cryptography tools
If these are in place, aim to include additional IT controls, including data archive and restore systems; IT asset tracking and reporting tools; IT configuration management tools; data leakage, audit and reporting tools; IT change management tools; and role-based access controls.
Organizational strategy
The first line of defense to protect data include all the people who are handling data: this includes data outsourced and managed by business partners, not just employees Review and update policies for sensitive data protection, handling, retention and destruction. Conduct training and implement accountability programs that reward good behavior and compliance with policies. While some parts of the organization may be better suited to fulfill the roles of data guardians and data custodians,
do not make data protection the sole responsibility of internal controls, employees handling sensitive customer data, business unit managers, IT, legal or human resources: it is everyone’s job.
Key findings
It’s hard to imagine what businesses would do without technology. With most commercial interactions (and transactions) riding on multiple internal and external electronic environments—and ever-mounting mandates for demonstrating accountability— organizations have more incentive than ever to keep core business data safe and secure. What are companies doing to protect their data, and are these efforts successful? This Benchmark report provides a clearer understanding of the state of data protection
Failing to protect IT security and regulatory audit data is like a bank
giving away the combination to the vault. And this is exactly what
most firms are doing. Instead of securities and cash, these firms
are putting sensitive data, customers, revenues and business
Unconfirmed reports of sensitive data loss Whatever the cause—whether data was reported as missing, leaked, accidentally deleted, destroyed or stolen—on average, organizations experience 26 reported but unconfirmed losses of sensitive data per year. More telling is the distribution of such data losses:
• Industry lagging organizations, 20 percent having the worst data loss reports; are experiencing the highest rates of uncon-firmed sensitive data losses, averaging 64 unconfirmed but reported losses of sensitive data annually
• Industry normative organizations, 68 percent of organizations with loss reports in the middle of the pack;
experience a more moderate level of
19 unconfirmed but reported data losses each year
• Industry leading organizations, 12 percent of organizations with the fewest reports of data loss; experience five (5) unconfirmed but reported data losses each year
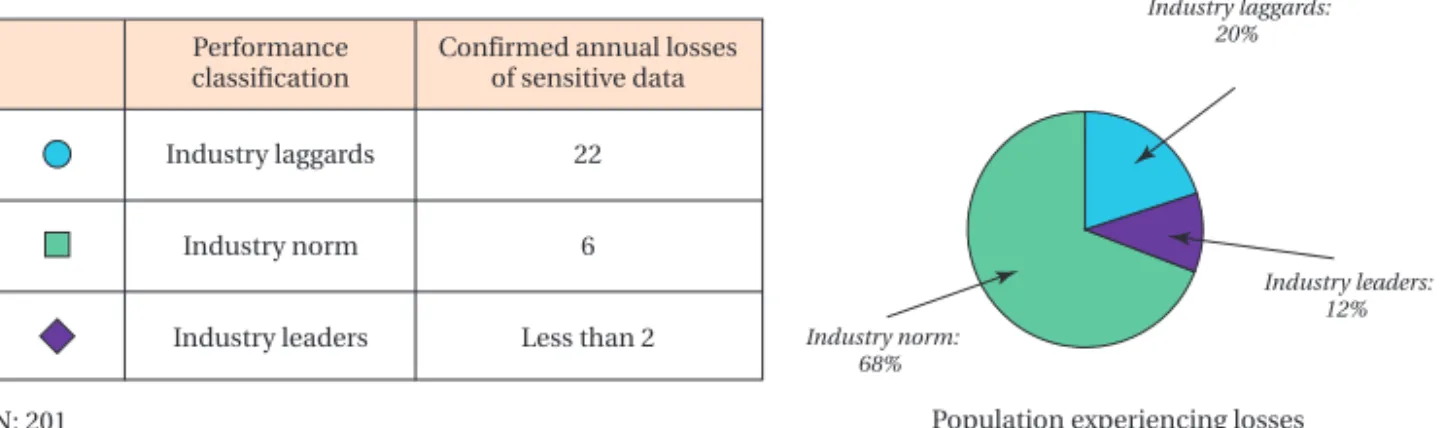
Data loss results: confirmed losses of sensitive data
Fortunately, most organizations are experiencing actual loss rates that are much lower than the suspected and reported losses of sensitive data. However, confirmed data loss experience varies widely, with some organizations experiencing much larger confirmed losses and a minority experiencing very small confirmed data losses (Figure 1).
Much like unconfirmed reports of data loss the distribution of actual loss experience shows: • Industry lagging organizations, 20 percent having the worst data losses; experience
the highest rates of confirmed sensitive data losses, averaging 22 actual losses of sensitive data annually
• Industry normative organizations, 68 percent with middle-of-the-road data losses;
experience a more moderate number of six (6) confirmed data losses per year
• Industry leading organizations, 12 percent with the fewest data losses; experience fewer than two (2) confirmed data losses each year
What was measured by this benchmark Measured:
• Data reported as missing, leaked, accidentally deleted, destroyed or stolen
• Data confirmed as missing, leaked, accidentally deleted, destroyed or stolen
Not measured:
• Data losses distinguished by type of event, including how much data was missing, leaked, deleted, destroyed, or stolen among others.
Figure 1: Sensitive data loss results
Source: IT Policy Compliance Group, 2007
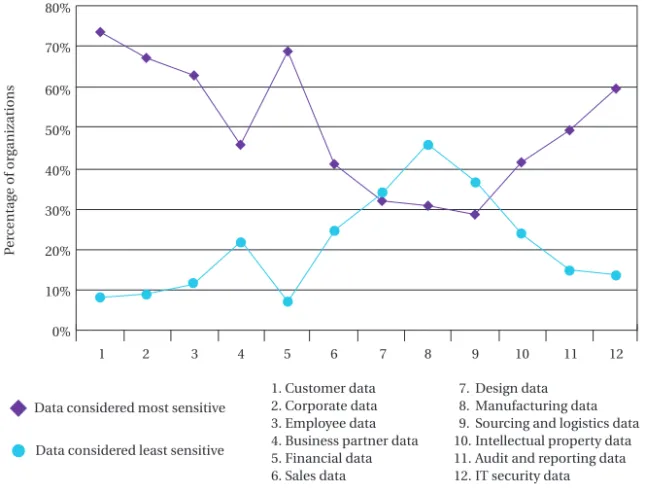
Which data are most sensitive?
Not all data are valued, nor are considered as sensitive equally, due to differences in mission, values of the organization, competitive value, financial value, brand reputation, and regulatory audit risk among other factors. Still, there are certain types of data that are more—and less—sensitive across all industries.
Highly sensitive and valued data
Across all industries, the data considered most sensitive, include: 1. Customer data
2. Financial data 3. Corporate data 4. Employee data 5. IT security data
Moderately sensitive data
Types of data considered moderately sensitive include business partner data, sales data, intellectual property data, and regulatory audit and reporting data.
Less valued data
The type of data ranked as least sensitive include data on manufacturing and related design data, along with sourcing and logistics data (Figure 2).
Although potentially not appropriate for specific industries, this ranking of data sensitivity provides some insight into the value of data across a broad spectrum of organizations. Performance classification Industry laggards Industry norm Industry leaders
Confirmed annual losses of sensitive data 22 6 Less than 2 Industry leaders: 12% Industry norm: 68% Industry laggards: 20%
Population experiencing losses N: 201
Figure 2: Least and most sensitive data
Source: IT Policy Compliance Group, 2007
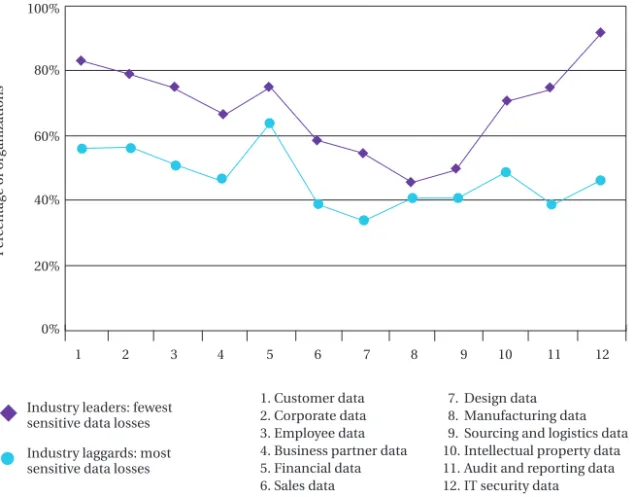
Most sensitive data among organizations with the fewest losses
The type of data that are considered most sensitive by leading organizations—those with the fewest confirmed data losses—include IT security data, customer data, corporate data, employee data, financial data, and regulatory audit and reporting data.
Most sensitive data among organizations with the largest losses
The data considered most sensitive by lagging organizations—those with the highest confirmed data losses—are financial data, customer data, corporate data, employee data, and regulatory audit and reporting data.
Data considered most sensitive Data considered least sensitive
0% 1 2 3 4 5 6 7 8 9 10 11 12 10% 20% 30% 40% 50% 60% 70% 80% P e rcentage of or ganizations 1. Customer data 2. Corporate data 3. Employee data 4. Business partner data 5. Financial data 6. Sales data
7. Design data 8. Manufacturing data 9. Sourcing and logistics data 10. Intellectual property data 11. Audit and reporting data 12. IT security data
Differences by data loss results
IT security data is ranked as the most sensitive data by 92 percent of firms with the lowest rate of actual data losses. By comparison, only 46 percent of the lagging organizations, firms with the highest confirmed cases of sensitive data loss, rank IT security data as the most sensitive data.
A comparable variance occurs with regulatory audit and reporting data. Seventy-five percent of leading organizations rank audit and reporting data as their most sensitive data. This compares with 37 percent of lagging organizations that rank IT security data as their most sensitive data (Figure 3).
Figure 3: What lagging and leading organizations consider sensitive
Source: IT Policy Compliance Group, 2007
Industry leaders: fewest sensitive data losses Industry laggards: most sensitive data losses
1 2 3 4 5 6 7 8 9 10 11 12 100% 80% 60% 40% 20% 0% P e rcentage of or ganizations 1. Customer data 2. Corporate data 3. Employee data 4. Business partner data 5. Financial data 6. Sales data
7. Design data 8. Manufacturing data 9. Sourcing and logistics data 10. Intellectual property data 11. Audit and reporting data 12. IT security data
Leading organizations: leveraging the sentinels guarding valued business data
Companies seeking improved data protection results would do well to take the necessary steps needed to protect IT security data. As sentries guarding and documenting the movement of business data, the experience of leading organizations indicates that protecting IT security data and regulatory audit and reporting data is a necessary first step toward protecting sensitive and valued business data.
In contrast, almost 70 percent of firms, those with middle-of-the-road rates of data losses, are principally focused on protecting financial data, secondarily on protecting other forms of business data and, perhaps thirdly, on protecting IT security data, the mechanisms providing access to valued business data.
Among lagging organizations, the sensitivity of IT security data and IT audit and reporting data, which provides evidence of access to sensitive business data, are below mean for the entire population. This indicates the firms with the highest data losses may be unaware, unwilling, or unable, to protect access to core business data and records of such access.
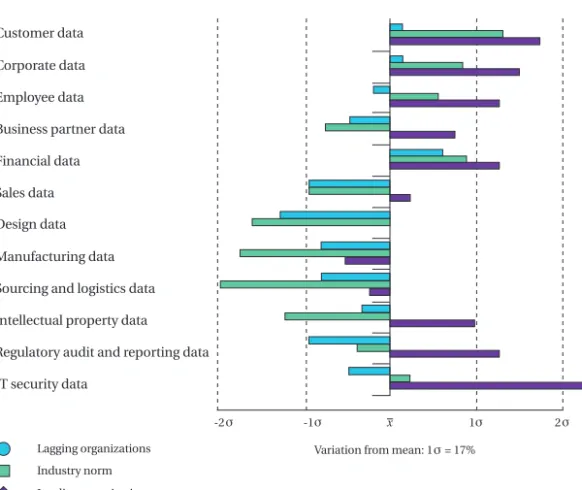
How else do leading organizations differ?
When the ranking of sensitive data types is compared to the mean results of the popu-lation, the picture that emerges reinforces the importance of the value of IT security and regulatory data for protecting core business data among leading organizations (Figure 4).
The type of data that leading organizations consider sensitive include, in order: IT security data, customer data, corporate data, regulatory audit and reporting data, employee data, financial data and intellectual property data as the most sensitive data. Organizations operating at the industry norm are focusing on almost all the same business data as those that are leading, but do not consider IT security data and regulatory audit data as sensitive. Lower valuations also emerge within the normative group for intellectual property and business partner data.
Figure 4: Data sensitivity by type and loss rates
Source: IT Policy Compliance Group, 2007
By comparison, the only data that is as highly valued as sensitive by lagging organizations is financial data. Customer and corporate data are valued slightly above the mean. Otherwise, no other forms of data are considered sensitive by firms with the most data losses.
Leading causes of data loss
The three leading causes of sensitive data loss for all organizations are: • User errors
• Violations of policy
• Internet-based threats, attacks and hacks
Customer data Lagging organizations Leading organizations Industry norm Corporate data Employee data Business partner data Financial data Sales data Design data Manufacturing data Sourcing and logistics data Intellectual property data Regulatory audit and reporting data IT security data
Human error is driving data losses
In one form or another, human error is the overwhelming cause of sensitive data loss, responsible for 75 percent of all occurrences. User error is directly responsible for one in every two cases (50 percent) while violations of policy—intended, accidental and inadvertent—is responsible for one in every four cases (25 percent). Malicious activity in the form of Internet-based threats, attacks and hacks is responsible for one in every five occurrences (Figure 5).
After these top-three causes of data loss, the common causes of data loss include: lost or stolen PC laptops, accidental damage to computing equipment; IT vulnerabilities; inappropriate usage of IT resources; insufficient IT controls; employee manipulation and malfeasance; insufficient controls on business procedures; inappropriate access to IT resources; improperly transferred backup media; and insufficient auditing monitoring and reporting.
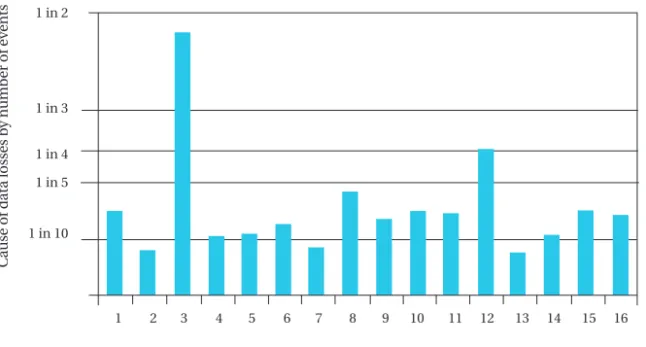
Figure 5: Leading causes of data loss
Source: IT Policy Compliance Group, 2007
1 in 2 1 in 3 1 in 4 1 in 5 1 in 10 1 2 3 4 5 6 7 8 9 10 11 12 13 14 15 16 N: 201
1. Lost or stolen laptops
2. Improperly disposed of computer equipment 3. User errors
4. Improperly transferred backup media 5. Inappropriate access to IT resources 6. Insufficient controls on business procedures 7. Insufficient controls on IT procedures 8. Internet threats, attacks and hacks
9. Employee manipulation and malfeasance 10. Accident and damage to computing equipment 11. Inappropriate usage of IT resources
12. Violation of policies
13. Unauthorized access to IT resourced 14. Insufficient auditing, monitoring and reporting 15. IT vulnerabilities
16. Insufficient IT controls
C
ause of data losses b
y
number of e
v
Although human error accounts for the vast majority of the causes of sensitive data loss, thereafter, the causes of data loss—each of which account for between two in ten to one in ten instances—are more evenly distributed and less focused.
Among the least frequent cause of data loss are improperly disposed-of computing equipment, unauthorized access to IT resources and insufficient controls on IT procedures, each of which account for less than one in every ten instances of sensitive data loss.
Causes of data loss varies by performance results
Although the primary cause of data loss for most organizations is the interaction of people with computing systems, the specific causes of loss vary by performance results. Among organizations with the highest loss rates, employee manipulation and malfeasance, insufficient auditing and monitoring along with insufficient IT controls are among the top five leading causes of data loss. Among firms with the fewest losses, employee manipulation and malfeasance as well as inappropriate use of IT resources creep into the top five causes for data loss. Lastly, lost or stolen laptops, along with insufficient controls in IT and on business procedures are among the top five causes of data loss among the vast majority of firms (Table 1).
Table 1: Cause of data loss, laggards to leaders
Source: IT Policy Compliance Group, 2007
Top five causes of data loss 22 data losses 6 data losses Fewer than 2 data losses Violations of policy (1 in 3 events) User errors (1 in 2 events) User errors (1 in every 1.5 events) User errors (1 in 3 events) Violations of policy (1 in 4 events) Internet threats, attacks and hacks
(1 in 3 events) Employee manipulation and malfeasance (1 in 4 events) Internet threats, attacks and hacks (1 in 6 events) Inappropriate usage of IT resources (1 in 4 events) 1 2 3 Insufficient auditing and monitoring (1 in five events) Lost or stolen laptops (1 in 7 events) Violations of policy (1 in 6 events) 4 Insufficient IT controls (1 in 5 events) Insufficient controls in IT and on business procedures (1 in 8 events) Employee manipulation and malfeasance (1 in 6 events) 5
The primary channels for sensitive data loss
The three largest conduits through which sensitive data are being lost, stolen, destroyed, or misplaced include:
• Data residing on PCs, laptops and other mobile devices
• Data leaking through email, instant messaging and other electronic channels • Data that is accessible through applications and databases
Top three conduits for data loss
Sixty-two (62) percent of organizations cite data residing on PCs, and laptops and mobile field devices as the primary venues through which data are being lost. This is followed by 52 percent of organizations that are experiencing data leaking through email, instant messaging and other electronic channels as the primary conduit for data loss. Rounding out the top three loss venues, 43 percent of organizations are grappling with data losses occurring through applications, databases and the systems on which applications and databases are operating (Figure 6).
After these three primary pipelines through which sensitive data is disappearing, organizations rank data that is transferred to backup and archive sites, data residing in centralized storage facilities and devices, and data that is in the hands of business partners and suppliers as the next three passageways for data loss.
70% 60% 50% 40% 30% 20% 10% 0% 1 2 3 4 5 6 7 8
1. Data residing on PCs, laptops 5. Data that has been off-shored
P
e
rc
entage of or
The only significant difference in the Benchmark is for data that has been outsourced or off-shored. Thirty-one percent of lagging organizations and 29 percent of leading organizations are finding that outsourced or off-shored data is a primary avenue for data loss, while only eight percent of firms operating at the norm experienced losses of sensitive data that had been outsourced or off-shored.
Responding to the challenge of protecting sensitive data
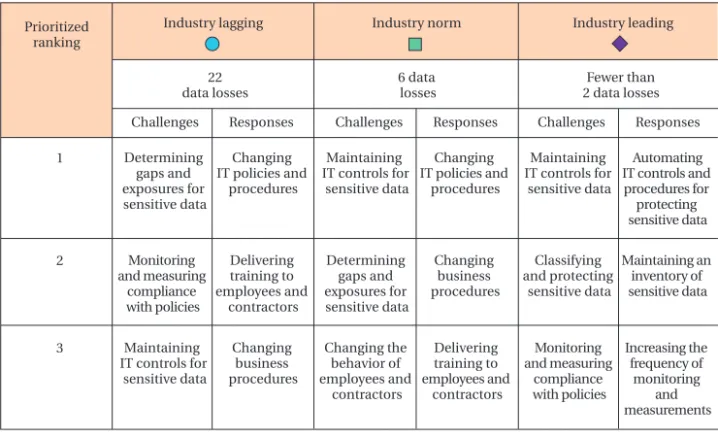
How organizations prioritize and respond to the challenges of protecting sensitive data varies by performance results, with very large differences between the leaders and all other organizations, and smaller differences between laggards and firms operating at the norm (Table 2).
Among firms with the highest data losses, the primary challenges include determining gaps and exposures that are leading to data loss, monitoring and measuring compliance with policy, and maintaining IT controls for sensitive data. Lagging organizations are responding to their challenges to protect sensitive data by changing IT policies and procedures, delivering training to employees and contractors about policies, and changing business procedures. Normative organizations are uniquely challenged to change the behavior of employees and contractors. These organizations are responding to their challenges to protect sensitive data by changing IT policies, changing business procedures and delivering training to employees and contractors.
Despite these differences, the importance of instituting and enforcing sound policies and procedures comes through loud and clear. Put another way, no amount of training will overcome poorly conceived or supported policies, or have a significant effect until sound policies and procedures along with a shared sense of ownership are put in place for all employees and contractors. In addition to other findings and recommendations in this benchmark, responding to the challenges will require organizations to develop and institute cultural imperatives that foster the protection of sensitive data.
Despite some similarities, the leaders have one challenge not faced by other organizations: the need to classify sensitive data. Likewise, the leaders are responding very differently to the challenge of protecting sensitive data, and are especially focused on inventorying sensitive data while automating controls and procedures to protect data.
Table 2: Challenges and responses
Source: IT Policy Compliance Group, 2007
Leading organizations: uniquely responding
A challenge uniquely found among the organizations with the fewest data losses is classifying data. Moreover, the prioritized responses being taken by the leaders are unlike all other organizations, and include:
1. Automating IT controls and procedures for protecting sensitive data 2. Maintaining an inventory of sensitive data
3. Increasing the frequency of monitoring and measurements
Having established policies and procedures along with a shared sense of ownership to solve the problem of data loss, the leaders are taking the next steps to reduce and mitigate data losses.
Prioritized ranking
Industry lagging Industry norm Industry leading 22
data losses
Challenges Responses Challenges Responses Challenges Responses Determining gaps and exposures for sensitive data Changing IT policies and procedures Maintaining IT controls for sensitive data Changing IT policies and procedures Maintaining IT controls for sensitive data Classifying and protecting sensitive data Automating IT controls and procedures for protecting sensitive data 6 data losses Fewer than 2 data losses 1 Monitoring and measuring compliance with policies Delivering training to employees and
contractors Determining gaps and exposures for sensitive data Changing business procedures Maintaining an inventory of sensitive data 2 Monitoring and measuring compliance with policies Maintaining IT controls for sensitive data Changing business procedures Changing the behavior of employees and
contractors
Delivering training to employees and
contractors Increasing the frequency of monitoring and measurements 3
Strategic actions to protect sensitive data
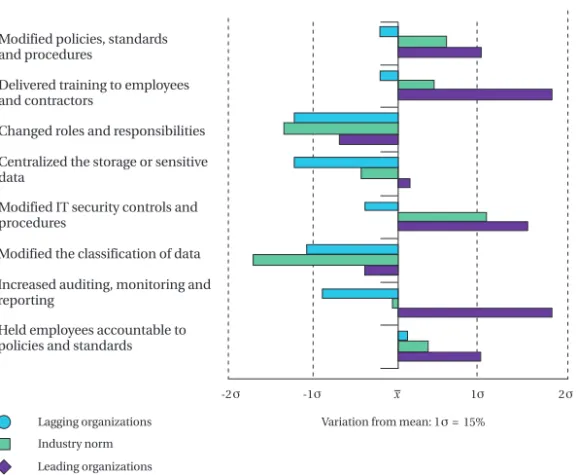
In addition to responding differently, organizations are taking different strategic actions to protect sensitive data and the leading organizations, those with the fewest data losses, are taking very different actions to protect sensitive data (Figure 7).
Figure 7: Strategic actions taken to protect sensitive data
Source: IT Policy Compliance Group, 2007
Industry leading organizations: different strategic actions
Firms with the lowest number of data losses are taking five principle strategic actions to protect sensitive data. These actions include:
• Increasing the frequency of measuring and reporting on the efficacy of controls and procedures
• Delivering training to employees and contractors • Modifying IT security controls and procedures • Modifying policies standards and procedures
• Holding employees accountable to policies and standards
In contrast, lagging organizations are below mean for seven of the eight strategic
Lagging organizations Industry norm
Modified policies, standards and procedures
Delivered training to employees and contractors
Changed roles and responsibilities
Centralized the storage or sensitive data
Modified IT security controls and procedures
Modified the classification of data Increased auditing, monitoring and reporting
Held employees accountable to policies and standards
15%
Example: a major bank in the United States
In addition to taking these top-five strategic actions for leading organizations, at a major bank in the Unites States the responsibility for safeguarding customer data was broadened to include employees who managed customer accounts in the business and consumer divisions. These employees were trained on the new procedures and policies for the handling of sensitive customer data. This organization also implemented quarterly data reviews as part of compensation review for account managers. The IT organization at this bank moved from measuring and monitoring controls and procedures once quarterly to once weekly, scheduled on random days from one week to the next.
Example: a manufacturing firm in Europe
A large manufacturing firm in Europe decided to implement additional controls on the information flowing through its electronic channels in order to first identify, and then reduce losses of sensitive data. After identifying the primary sources of data loss, this firm implemented new policies, procedures and controls. It introduced training for employees and increased the frequency of its controls and procedures monitoring regimen to weekly.
Example: a mid-size insurance company
A medium-size insurance company suspected it was losing some type of data. After monitoring and documenting data losses, it implemented a multi-disciplinary team to overhaul its policies, controls, procedures, and monitoring of sensitive data. Today, the firm identifies the potential impact for most sensitive data losses during—or within a few minutes of—each occurrence.
Example: a larger legal services firm
This organization decided to classify all of its data, implement new policies and procedures, and hold all employees accountable to new standards. The firm now implements around-the-clock monitoring of controls and procedures for sensitive data. Better results: more frequent monitoring and measurement
Organizations with the fewest data losses—industry leading organizations— are monitoring and measuring the effectiveness of controls and procedures to protect sensitive data, on average once every four days. This rate of audit
Organizations with the fewest data losses are monitoring and measuring the effectiveness of controls and procedures to
Blind monitoring of controls on a more frequent basis, by itself, is unlikely to stem data losses. However, the Benchmark findings are clear: 100 percent of the leading firms— those with the fewest losses of sensitive data—are monitoring controls and procedures for sensitive data on at least a weekly basis. This single action, weekly monitoring of controls and procedures, is subscribed to by all leading firms, and is the strategic actions that is making a significant contribution to retarding and eliminating the loss of sensitive data.
By comparison, nearly all other firms (97 percent) are monitoring the effectiveness of controls and procedures on a substantially less frequent basis, ranging from monthly to annually. In fact, the average time between measurements for most organizations are once every 176 days while the minority lagging institutions are even more lax, measuring once every 205 days.
Figure 8: Frequency of monitoring and measurement
Source: IT Policy Compliance Group, 2007
Lagging 22 data losses annually Norm 6 data losses annually Leading Less than 2 data losses annually Once every 205 days Once every 176 days Once every 4 days Performance results Frequency of measurement 60% 50% 40% 30% 20% 10% 0% 1 2 3 4 5 P e rcentage of or ganizations
Effectiveness of controls and procedures for protecting sensitive data are measured:
1. Once annually
2. Once per quarter 3. Once per month 4. Once per week 5. Once per day
Industry leading Industry norm Industry lagging
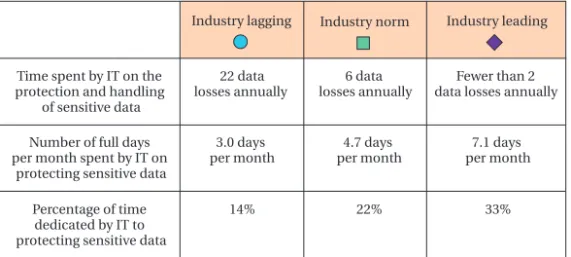
Time allocated to protecting sensitive data
Leading organizations, firms with the lowest number of data losses, are devoting 33 percent of the total time spent by IT to protect sensitive data: more than seven days per month. By comparison, normative and lagging organizations are, respectively, spending 22 percent and 14 percent of the time in IT on protecting sensitive data (Table 3).
Table 3: Time spent by IT on protecting data
Source: IT Policy Compliance Group, 2007
The Benchmark findings show that firms spending more time on the most important strategic actions are rewarded with lower confirmed data losses. In summary, the actions being taken by industry leading organizations that are resulting in the low loss rates include:
• Monitoring and measuring controls and procedures weekly • Delivering training to employees and contractors
• Modifying IT security controls and procedures • Modifying policies standards and procedures
• Holding employees accountable to policies and standards 22 data
losses annually
Time spent by IT on the protection and handling
of sensitive data
6 data losses annually
Fewer than 2 data losses annually
3.0 days per month 4.7 days per month 7.1 days per month 14% 22% 33% Number of full days per month spent by IT on
protecting sensitive data Percentage of time dedicated by IT to protecting sensitive data
IT controls and sensitive data losses
Leading organizations—those with the least number of data losses—are employing many different IT controls to help stem data losses. This is in stark contrast to all other firms where IT controls are either not being employed or only a limited set of controls are being employed (Figure 9).
Use of IT controls among leading organizations
Reliance on IT controls among the leading organizations—the firms with less than two sensitive data losses in the past year—is significantly higher than the mean for five technologies, and higher than the mean for another six technologies.
The five primary IT controls being employed by industry leading organizations to better protect sensitive data include:
• Audit, measurement and reporting tools • Network access controls
• Application, server and PC access controls • Internet threat controls
• Data protection and cryptography tools
After these five, a secondary group of six IT controls is being utilized by firms with the lowest data losses. These controls include: data archive and restore systems; IT asset tracking and reporting tools; IT configuration management tools; data leakage, audit and reporting tools; IT change management tools; and role-based access controls. What is noticeable about organizations with the lowest data losses is the widespread use of many different IT controls to protect sensitive data. What is even more interesting is the almost continuous measurement of controls and procedures. Instead of assuming the IT controls are working to protect data, the leaders are placing many different IT controls in the environment, and are monitoring and measuring weekly.
Use of IT controls among normative firms
In contrast, organizations operating at the norm, those with an average of six annual data losses are primarily using access controls for applications, servers and PCs, along with access controls for networks to protect sensitive data.
Use of IT controls among lagging firms
Lagging firms—those with the most data
Leading organizations are using multiple IT controls to reduce data loss. This is in stark contrast to all other firms where IT controls are either not being
employed or a limited set of controls are being used.
Figure 9: IT controls from laggards to leaders
Source: IT Policy Compliance Group, 2007
Lost data: lost revenues, lost customers and additional expenses
In a related but separate benchmark that was conducted in December of 2006 by the IT Policy Compliance Group with another 254 organizations, one of the principle findings that emerged is that data losses that are publicly reported are resulting in revenue losses, lost customers and additional expenses. For all organizations, the average impact of data thefts and loss include:
• An eight percent loss of customers • An eight percent decline in revenue
• Additional expenses of $100 per record to notify customers and restore data
Clearly, data is money and the business and financial impact of data theft and loss are real.
Data archive and restore systems
Industry laggards Industry leaders Industry norm
Auditing, measurement and reporting tools Data tagging and records management tools Data protection and cryptography
Internet threat controls Network access controls
Application, server and PC access controls Data pattern matching and reporting tools Data content filtering and reporting tools Role based access controls
Data leakage, audit and reporting tools IT asset tracking and reporting tools IT configuration management tools IT change management tools
15% Deviation from mean,
Benefits of protecting sensitive data
The two primary benefits cited by all organizations for protecting sensitive data include assurance of integrity for company brand and image, and less concern about electronic theft. Nearly one-in-two organizations (46 percent) cite assurance of integrity for the firm’s brands and its image as the highest reward for protecting sensitive data. Slightly behind this, about one-in-three organizations (33 percent) say reduced concern about electronic theft is the primary benefit of protecting sensitive data (Figure 10).
Figure 10: Benefits of protecting sensitive data
Source: IT Policy Compliance Group, 2007
Ranked lower and by fewer organizations are a range of benefits, including: less concern about data leakage and public news reports; reductions and/or avoidance of litigation and associated costs; less concern about external audit findings; improvements to customer loyalty and retention; continued business with major customers and trading partners; and less concern about competitive access to sensitive data. Ranked lowest and by the fewest number of organizations are reduced insurance costs and improve-ments to shareholder value.
50% 40% 30% 20% 10% 0% 1 2 3 4 5 6 7 8 9 10
1. Maintenance of shareholder value 2. Improved customer loyalty and retention 3. Less concern about external audit findings 4. Reduction and/or avoidance of litigation and cost
5. Continued business with major customers and trading partners
6. Assurance of integrity for company brand and image
7. Less concern about data leakage and public news reports
8. Reduced insurance cost
9. Less concern about sensitive data being used by competitors
10. Less concern about electronic theft
P
e
rc
entage of or
How different are the leading organizations?
Leading organizations, those with the least number of sensitive data losses, are experi-encing six key benefits for protecting data that are above mean. Of these, the benefits are far above mean include assurance of integrity for the company brand and image along with less concern about data leakage and public news reporting (Figure 11).
Figure 11: Benefits from laggards to leaders
Source: IT Policy Compliance.com, 2007
A correlated benefit being achieved by the leaders is less concern about electronic theft. The findings from the benchmark with 254 other organizations show a direct relationship between data loss rates, revenue losses, customer losses and additional expenses. It is no wonder that leading organizations also demonstrate
Shareholder value maintained
Customer loyalty and retention improved
Reduction or avoidance of litigation and cost
Continued business with major customers and trading partners
Assurance of integrity for company brand and image
Less concern about data leakage and public news reports
Less concern about sensitive data being used by competitors
Reduced insurance cost
Less concern about electronic theft Less concern about external audit findings
11% Deviation from mean, Industry laggards
Industry leaders Industry norm
It costs much less to protect sensitive data than it does to replace lost customers and incur damage to the image of the
Based on the benefits being realized and the results being achieved by leading organi-zations, it simply makes sound business sense to take action to protect sensitive data. It costs much less to protect sensitive data than it does to replace lost customers and repair damage to the image of the organization and its brand equity, in most cases an irreplaceable asset.
Recommendations for action
Based on the benchmark findings, the key recommendations include: • Measure your own data losses
• Identify the most critical sensitive data
• Don’t forget to protect critical IT security and audit data • Reduce human errors
• Inventory your IT controls, especially those for PCs, laptops, mobile field devices, Email, Web, Internet channels, applications and databases
• Monitor and report on the effectiveness of controls and procedures weekly If your organization does not know how much sensitive data is being lost, now is the time to find out, before it becomes public knowledge. After determining how much and what type of data is being lost, focus on what it will take to protect the most sensitive data, not all data. Do not forget to place IT security data and regulatory audit data at the top of the list: one provides the keys to the vault, the other a record of what was removed and who removed it.
IT controls and monitoring
Take an inventory of your IT controls to determine what is deployed and what needs to be deployed to protect sensitive data. Don’t assume that one technical control is enough: the experience of the leaders shows that many controls, monitored weekly, is a key success criteria for protecting sensitive data. Resolve to monitor controls and procedures covering sensitive data weekly. If your organization cannot achieve this immediately, set a date to achieve this and look for audit and measurement tools that will enable this.
Policy and organizational strategy
If policies covering sensitive data do not exist: develop these. Review policies that exist and modify them to cover business and financial risks. Reduce human error where possible. Review and modify your policies regarding sensitive data, identify its custodians and guardians, develop and deliver training to employees and contractors and hold people accountable.
Author profile
Jim Hurley
Managing director, Research, IT Policy Compliance Group Research director, Symantec
Jim Hurley is managing director of the IT Policy Compliance Group and a director of research with Symantec Corporation. In his role, Jim is responsible for working with members to drive, field, and deliver benchmarks and reports that focus on enabling organizations to improve their IT policy compliance results. Jim comes to IT Policy Compliance Group and Symantec after more than 10 years as the vice president of research with Aberdeen Group, an independent research, analysis, and consulting organization. His 25 years in scientific, healthcare, IT and technology-related industries have included multiple roles including management, operations, sales, marketing, customer service, research, design, development, and manufacturing.
Research methodology
This IT Policy Compliance Group Benchmark covering data losses and actions to improve results was conducted with 201 organizations between August and October of 2006. The margin of error is plus or minus six percent. The majority of participating organiza-tions (90 percent) are located in the United States. The other ten percent are located around the globe, in Germany, the United Kingdom, Australia, Brazil, Canada, the United Arab Emirates, and Japan and elsewhere. The companion benchmark covering financial losses from data losses we conducted with another 254 organizations in December of 2006. Demographic details of this companion benchmark will be included in an upcoming report.
Size of organizations
Thirty-five percent of the organizations participating in this Benchmark have annual revenues, assets under management or budgets of less than $50 million. Another 35 percent have annual revenues, assets under management or budgets that are between $50 million and $499 million. The remaining 30 percent have annual revenues, assets under management or budgets that are $500 million or more.
Industries represented
A wide range of industries participated in the benchmark including aerospace; automotive; banking; chemicals; computer equipment and peripherals; computer software and services; construction, architecture and engineering services; consumer electronics; consumer packaged goods; distribution; education; financial and accounting services; general business and repair services; government—public administration; government—defense and intelligence; health, medical and dental services; insurance; law enforcement; legal services; management, scientific and consulting services; manufacturing; medical devices; metals and metal products; mining, oil and gas; publishing, media and entertainment; real estate, rental and leasing services; retail trade; transportation and warehousing; travel, accommodation and hospitality services; utilities; and wholesale trade. Manufacturing, along with health, medical and dental services each account for 12 percent of participating organizations. All other industries represent less than ten percent of participating organizations.
Number of operating locations
Forty eight percent of participating organizations operate from five or fewer locations. Thirty-five percent operate from between six and 49 locations. The remaining 17 percent operate from 50 or more locations.
Number of employees
Thirty-six percent of participating organizations employ fewer than 250 persons. Thirty-six percent employ between 250 and 2,499 persons. The remaining 28 percent employ 2,500 or more.
Participants
Twenty-six percent of participants in this Benchmark are senior managers (CEO, CFO, CIO, etc), 11 percent Vice Presidents, 36 percent managers or directors, 23 percent staff, and four percent internal consultants. Thirty-three percent of the participants work in finance and internal controls, another 28 percent work in IT, 10 percent are employed in customer service, and the remaining 29 percent are distributed across a wide range of job functions, including legal, compliance, sales, marketing, design, development, manufacturing, procurement, and logistics.
Appendix
Data losses in the U.S. since ChoicePoint
Since the public announcement of sensitive data losses at ChoicePoint, February 15, 2005 to January 19, 2007, the Privacy Rights Clearinghouse (PRC) has recorded 453 separate incidents of data loss involving sensitive, personally identifiable information— about one publicly reported data loss event every two days. According to the PRC, more than 100 million records of personally identifiable data were exposed, stolen or lost during this period.
The information collected by the PRC has been categorized by the date that a data loss was made public, the name of the organization involved, and the type and number of records involved. The IT Policy Compliance Group has not verified whether the data compiled by the PRC is accurate and complete.
What is clear from the PRC information is that almost every industry has experienced sensitive data loss, with some industries more affected than others. Moreover, most of the institutions listed are widely known. The cause for the data breaches in these 453 incidents, according to the PRC, ranges widely, from computer hacking to stolen laptops and misplaced archive tapes, among other causes. The data from the PRC does not include unreported data breaches. It appears that much of the sensitive data losses cataloged by the PRC involve employee, customer, and financial data.
What is not clear is whether the data losses also involve corporate, business partner, sales, sourcing, logistics, manufacturing, design, audit, and IT security data.
The PRC information covering data breaches since ChoicePoint can be reviewed at its website: http://www.privacyrights.org/ar/ChronDataBreaches.htm.
About IT Policy Compliance Group sponsors
The IT Policy Compliance Group is dedicated to promoting the development of research and information that will help IT security professionals meet the policy and regulatory compliance goals of their organizations. The IT Policy Compliance Group focuses on assisting member organizations to improve compliance results based on fact-based benchmarks.
The IT Policy Compliance Group Web site at www.itpolicycompliance.com features content by leading experts in the world of compliance and published reports containing primary research. Research and benchmarks sponsored by the Group produce fact-based insight and recommendations about what is working and why.
The results of Group-sponsored research are designed to help security and compliance professionals to:
• Benchmark IT policy compliance efforts against peers and best-in-class performers • Identify key drivers, challenges, and responses to implement successful IT policy and
security compliance initiatives
• Determine the applicability and use of automation tools to assist, streamline, and improve results
• Identify best practices for IT policy and compliance programs
IT Policy Compliance Group sponsors
Symantec Corporation The Institute of Computer Security Protiviti
20330 Stevens Creek Blvd. Internal Auditors Institute 1290 Avenue of the Americas, Cupertino, CA 95014 247 Maitland Ave. 600 Harrison St. 5th Floor
+1 (408) 517 8000 Altamonte Springs, San Francisco, CA 94107 New York, NY 10104 www.symantec.com FL, 3270-4201, USA +1 (415) 947 6320 +1 (212) 603 8300 [email protected] +1 (407) 937 1100 [email protected] [email protected]
[email protected] www.gocsi.com www.protiviti.com www.theiia.org
IT Policy Compliance Group
Managing Director, Jim Hurley Telephone: +1 (216) 321 7864 [email protected]