massage profession
research report
Table of Contents
Introduction ... 2-3 Executive Summary ... 4-6 Section 1. Consumers of Massage Therapy ... 7 1A. What changes are taking place in the U.S. Population? ... 8-9 1B. What drives consumer use of massage therapy? ... .9-10 1C. Who gets massage? ... 11-13 1D. Why do consumers get massage? ... 14-16 1E. Where are consumers getting massage? ... 16-18 1F. What did AMTA hear from consumers on its outreach in 2012? ... 19 Section 2. The Massage Therapy Profession ... 20 2A. Who is practicing massage therapy? ... 21-24 2B. How much are massage therapists compensated for their work? ... 25-29 2C. What are some of the biggest challenges facing massage therapists? ... 30 2D. Where are massage therapists practicing? ... 31-34 2E. What’s the latest on the spa industry and massage therapy? ... 35-37 2F. What impact are massage chains having on the profession? ... 37-38 Section 3. A Special Look at Health Care and the Massage Profession ... 39 3A. Continued growth in the health care industry ... 40 3B. Growth in the integration of Complementary and Alternative Medicine (CAM) treatments into
hospitals ... 40-42 3C. Consumer use of massage as part of an integrated approach to health care ... 42-45 3D. Massage and insurance ... 45-47 Section 4. Training and Education of Massage Therapists ... 48 4A. Hours and types of training ... 49-52 4B. School trends and demographics. ... 53-55 4C. School challenges ... 56-58 4D. School accreditation ... 59 4E. Teachers. ... 60-63 4F. Graduates ... 64 4G. Students ... 65-66 Section 5. Massage Therapists’ Use of Technology ... 67 5A. Massage therapists’ performance on basic online tasks ... 68 5B. Massage therapists’ overall use of technology ... 69 5C. Social media and massage therapists ... 70-71 5D. Massage therapists’ use of websites for their practices ... 71 5E. Massage therapists’ smart phone use ... 72 Appendix—List of Sources ... 73-75 Copyright Disclaimer
This document contains proprietary information of the American Massage Therapy Association® as well as other
organizations. If you wish to reproduce these materials or use them in any other way you must request permission from AMTA or other owners of the original materials. For permission to reproduce any AMTA data contained in this report, please call (877) 905-2700. If consent is granted, attribution to AMTA and other sources specified in the document
Introduction
Dynamics of the massage therapy profession The 2013 Massage Profession Research ReportWelcome to the 6th annual Massage Profession Research Report, AMTA's collection and analysis of current market data and trends that impact the massage therapy profession. AMTA develops this report to provide massage therapy schools with up-to-date
information and research to help them determine their curricula and make knowledgeable business decisions. This report is a key AMTA School Member benefit that helps you scan the current market (including consumers, therapists and schools) without a large investment of resources and/or manpower.
Four Annual Research Studies
In the pages that follow, you’ll find results of four benchmark surveys that track the state of the profession through 2012:
· The AMTA Consumer Survey (16th annual) was commissioned by AMTA to poll American adults on their use of massage therapy. (Confidence level of plus or minus three percent.)
· The AMTA Industry Survey (8th annual) provided feedback from massage therapists on everything from compensation, to hours, to longevity in the industry. (Confidence level of plus or minus two percent.)
· The AMTA Massage School Survey (6th annual) acquired feedback from schools with 500-plus hour programs. (Confidence level of plus or minus eight percent.)
· The AMTA Technology Survey (4th annual) obtained input from massage therapists about their use of digital technology for individual and professional purposes. (Confidence level of plus or minus five percent.)
This report provides timely and relevant data on the state of the massage profession, compiled from the results of these surveys and supplemented by U.S. government statistics and information found in industry and/or business publications. (For methodology, see the Appendix.)
Periodic Updates
As new data becomes available, you’ll receive periodic updates to this report as well as targeted fact sheets. You can use these resources to:
Support business class instructors – Therapists frequently tell AMTA they would like to receive more business training in massage school. The information in this report can help students build and market successful practices.
Direct and grow your schoolwisely – Employ this information to market your school to those seeking to become massage therapists.
Executive Summary
The massage therapy marketplace continues to be affected by the challenging economic environment. Although consumers continue to strongly believe in the efficacy of massage therapy, fewer of them received massage in the last year. Practicing massage therapists reported working, on average, more hours this past year, however. This indicates that fewer therapists were providing massage this past year.
Here is a summary of key findings for each section of this report.
Consumers of Massage Therapy
The percentage of adult American consumers who received a massage declined to 16 percent in 2012 from 18 percent in 2011 and the average number of massages obtained went from 4.5 in 2011 to 4.2 in 2012. Approximately 34.5 million people had a total of 145 million massages in 2012, a 15 percent decline from the 170.5 million massages consumed in the U.S. by 37.9 million people in 2011. Smaller percentages of all age groups received massage in 2012 except for Gen-Xers, those 35 to 44 years old. Twenty-three percent of this group received massage in 2012, more than any other age category, versus 18 percent in 2011.
Consumers continue to believe in the efficacy of massage as 89 percent consider massage to be effective in reducing pain and 87 percent believe massage can be beneficial to health and wellness. The primary reason consumers obtained massage continues to be for medical purposes – pain relief, soreness/stiffness and recovery from injury - with 43 percent of massage consumers getting massage for these reasons.
As part of a major multi-year commitment to public education on the benefits of massage therapy, AMTA launched it Consumer Awareness Program by visiting five major
metropolitan areas in the summer of 2012, providing free chair massages and information about the benefits of massage at each stop. Data collected from consumers after
receiving massage at these tour stops showed 89 percent were more likely to recommend massage to their family or friends and 78 percent reported they would be more likely to look for an AMTA massage therapist.
The Massage Therapy Profession
On average, massage therapists worked 21.6 hours per week in 2012, up significantly from 19.6 hours per week in 2011. Massage therapists saw an average of 41 clients each month in 2012, up from 38.9 clients per month in 2011. Including tips, the average therapist earned $30.76 per hour in 2012, about the same as in 2011, $31.11 per hour.* Between 2011 and 2012, the estimated number of massage therapists grew less than one percent to 307,104. The number of massage therapists has increased 41 percent over the
and are sole practitioners (69 percent). Massage therapists practice an average of seven modalities with 89 percent providing Swedish massage.
The biggest professional challenges reported by massage therapists continue to be industry perception (being recognized / respected as health care professionals and public awareness of massage therapy profession), and business / economy issues (poor economy and maintaining steady business / finding new clients).
*2011 hourly income data is not consistent with that previously reported due to corrections made to calculations of this data.
Health Care and the Massage Industry
The health care industry continues to offer employment opportunities for massage
therapists in a variety of settings. Health care industry employment grew 2 percent higher in 2012 over that for 2011 to 17 million. The category of “Outpatient care centers,” which includes massage therapists, as defined by the Bureau of Labor Statistics, experienced a 5.8 percent growth in the past year.
Twenty-seven percent of massage therapists reported working in a health care setting in 2012 (19 percent in a chiropractic office / integrated health care clinic and 8 percent in a hospital / medical office or clinic) slightly less than the 29 percent of therapists working in health care settings in 2011. In addition, health care is second only to other forms of bodywork as a source of additional income for massage therapists that have other, non-massage related, employment.
More massage therapists received referrals from health care professionals in 2012 than 2011 with particular increases from hospitals and medical offices (51 percent in 2012 versus 46 percent in 2011) and chiropractors and integrated health clinics (67 percent in 2012 versus 63 percent in 2011).
The growing number of referrals from health care professionals indicates increased integration of massage therapy in health care environments.
Training and Education of Massage Therapists
Massage therapy schools reported their top challenges as difficulty in attracting students and in marketing their programs. Seventy-five percent of schools reported in 2012 being accredited by nationally-recognized accrediting organizations.
The average number of graduates per school dropped from 48.5 in 2011 to 37 in 2012. Individually owned schools experienced the largest decrease from 53.6 graduates on average in 2011 to 41.7 graduates in 2012.
Seventy-five percent of schools offered financial aid to their students in 2012, up from 71 percent a year ago. To address the difficulty that some graduates may have in obtaining employment after graduation, 91 percent of schools offered some form of job placement services to students in 2012.
Seventy-six percent of massage therapists rated the quality of their initial massage training as excellent or very good. Ninety percent of massage therapists reported taking continuing education classes in 2012. On average, massage therapists took 24 hours of continuing education in 2012, more than the 19 hours reported in 2011.
Massage Therapists’ Use of Technology
Massage therapists are increasingly using digital technology in their professional and personal lives. On a daily basis, 82 percent of massage therapists used the Internet in 2012, the same percent as in 2011, and 48 percent used social media, an increase from 41 percent last year. Thirty-six percent of therapists used social media to stay in touch with clients in 2012, a 3 percentage point increase over 2011.
Close to half of all massage therapists (47 percent) reported having their own business websites in 2012 compared to 40 percent in 2011. Practically two-thirds (65 percent) now own a smart phone such as iPhone or Android compared to 51 percent in 2011. In the report to follow, these issues are explored in more detail, along with other issues important to the massage profession.
Note: Data for 2012 referenced in this report are based on research that occurred at various times during that year and thus may not represent information for that entire calendar year, e.g. some data was compiled in July and August of 2012.
We’d love to hear from you.
Let’s work together to educate the next generation of massage therapists. If you have suggestions, or identify additional information you need, please contact us anytime at [email protected].
Section 1 — Consumers of Massage Therapy
1Consumer use of massage therapy affects the speed and dynamics of growth
of the entire massage industry. How frequently, for what purpose, and at
what type of locations consumers get massage affects the number of
massage therapists needed as well as the types and settings for massage.
This section provides information on the latest data and trends in the U.S. population and massage consumer use.
Key Concerns:
How will shifting population demographics impact massage therapists and massage therapy schools?
How can we help our students connect with the populations most likely to seek massage therapy?
How can we gear our massage programs towards the markets most likely to grow?
How do massage franchise chains fit in?
How can this information help us make our massage therapy program more attractive to students?
Key Findings:
· Sixteen percent of adult American consumers received a massage in 2012, compared to 18 percent in 2011.
· U.S. population growth is slowing and becoming more diverse. · Consumers continue to believe in the efficacy of massage.
· People living in metropolitan areas and women are the greatest consumers of massage.
· Consumers continue to use massage for pain relief, pain management and to control headaches.
· Gen Xers, those between 35 and 44 years old, are becoming more frequent consumers of massage.
These questions will be answered:
1A. What changes are taking place in the overall U.S. population? 1B. What drives consumer use of massage therapy?
1C. Who gets massage?
1D. Why do consumers get massage? 1E. Where are consumers getting massage?
1A. What changes are taking place in the overall U.S. population?
2Consumers are the engine of growth in the profession. The greatest growth
of the U.S. population is taking place in the oldest segment. In addition, the
population is becoming more diverse, driven by the significant growth of
Hispanics in the country.
According to the U.S. Census Bureau, the U.S. population is growing, but at a relatively slow rate
The U.S. population has grown to 314.9 million from approximately 312.6 million a year ago. That’s a population growth of 0.74 percent, the lowest since the mid 1940’s. The population is projected to grow even more slowly over the next several decades as the number of births and international migrations are expected to be lower.
The U.S. population continues to age
The median age of the U.S. population increased to a new high of 36.8 years in 2011, up from 35.3 years in 2000. The increase in median age is driven by the aging baby boomer population, those born between 1946 and 1964. As shown in the table below, the median age is expected to steadily increase over the next several decades.
Year Median age of U.S. population 2000 35.3 2010 36.7 2020 39.6 2040 40.8 2060 42.2
Figure 1. Average current and projected age of U.S. population
The oldest part of the population is growing the fastest
According to the U.S. Census Bureau, the population 65 years of age and older is expected to more than double from 43.1 million in 2012 to 92.0 million by 2060. The number of those 85 and older is expected to more than triple from 5.9 million in 2012 to 18.2 million in 2060. It is estimated that 20 percent of the U.S. population will be 65 or older by 2060.
The U.S. population continues to become more diverse
In 2012, the U.S. Census Bureau reported that the racial minority population in the United States reached an estimated 116.2 million, or 37 percent of the nation’s total population, as compared to 31 percent of the total population reported in 2000. By 2060, minorities are projected to comprise 57 percent of the U.S. population at 241.3 million
· The Hispanic population grew by 43 percent between 2000 and 2010, from 35.3 million to 50.5 million.
· As of 2012, there are 53.3 million Hispanics comprising 16.6 percent of the total U.S. population.
· By 2020, the Hispanic population is projected to be 63.8 million, making up 19 percent of the U.S. population.
· By 2060, the Hispanic population is expected to more than double to 128.8 million, comprising 33 percent of the U.S. population.
For more information on U.S. population trends, refer to the U.S. Census Bureau data at http://www.census.gov.
Applying the Research:
1. Census projections and estimates have remained steady since last year. Talk with your students about the increasing age of the population, and the increasing diversity of the population. Discuss why this is occurring with baby boomers growing older, and the growth in the Hispanic population.
2. Have your students consider what the marketplace will look like in 5, 10, or 20 years from now based on population estimates. Then ask them to think about how they might respond to these changes in their practices.
1B. What drives consumer use of massage therapy?
As the economy continues to struggle, the percentage of Americans getting
massage declined in the past year as did the total number of massages.
The 2012 AMTA Consumer Survey results show that:· Sixteen percent of all adult Americans had at least one massage in 2012 compared to eighteen percent in 2011.
· Of those consumers that received massage in the past year, the mean number of massages decreased to 4.2 in 2012, down from 4.5 in 2011.
· In 2012, 25 percent of all adult Americans reported receiving a massage in the last five years down from 31 percent who reported receiving a massage in the past five years in 2011.
· Roughly 34.5 million people had a total of 145 million massages in 2012, compared to 37.9 million people having a total of 170.5 million massages in the U.S. in 2011.3
· The decline in the total number of massages in the past year, from 170.5 million to 145 million, represents a 15 percent decline.
· While the economy continues to slowly recover from the recession, we expect the use of massage to remain steady.
During the past ten years, consumer usage has moved from 21 percent in 2003 to a high of 24 percent in 2007 and then to 16 percent in 2012 (See figure 2 below).
Figure 2. Total use of massage among adult U.S. population
Consumers continue to believe in the efficacy of massage:
· Eighty-nine percent of consumers agree that “Massage can be effective in reducing pain.”
· Eighty-seven percent of consumers agree that “Massage can be beneficial to your health and wellness.”
· Sixty-eight percent of all consumers said they have or would recommend massage to a relative or to someone they knew in 2012.
· Twenty-eight percent of the adult population expects to get a massage in the next 12 months, an increase of 5 percentage points from 2011.
1C. Who gets massage?
Gender, generation, education and income all affect the likelihood of
consumers using massage. The greatest consumers of massage are women
and those living in metropolitan areas.
Of those consumers that received massage in 2012: · Seventy-nine percent live in a metropolitan area. · Sixty-nine percent are women.
· Sixty-six percent are white.
· Sixty percent reside in the West (30 percent) or South (30 percent). · Fifty-seven percent don’t have a child under 18 living in their household. · Fifty-seven percent earn more than $50,000 per year.
· Fifty percent are 44 years of age or younger. · Thirty-eight percent are college graduates.
Metropolitan residents - Seventy-nine percent of massage consumers resided in a metropolitan area.
· Of all adult residents of a metropolitan area, 16 percent got a massage in 2012, compared to 20 percent in 2011. Additionally, metropolitan dwellers received 4.3 massages on average in a year, down from 4.8 massages in 2011.
Women – Sixty-nine percent of all massages in 2012 were received by women, up from 66 percent in 2011.
· Twenty-two percent of adult women got at least one massage in 2012, slightly less than 2011, when 24 percent of women got at least one massage.
· The mean number of massages women received in 2012 increased to an average of 4.3 massages. This is still considerably less than the 7.6 massages women received in 2009, but higher than the 2011 average of 3.9 massages.
· Men received fewer massages on average than women, 4.1 massages compared to 4.3 massages for women.
Race – Sixty-six percent of massage consumers were white.
· Sixteen percent of whites received a massage in 2012, compared to 17 percent in 2011.
Households without children - Fifty-seven percent of all massage consumers did not have a child under 18 years old in their home in 2012.
· Usage among households with no children was 14 percent in 2012 down from 18 percent in 2011.
Household Income – Twenty-three percent of all massage consumers had a household income of $100,000 or more.
· Thirty percent of those that have household income between $75,000 and $100,000 received a massage in 2012, down from 37 percent of those with household income between $75,000 and $100,000 in 2011.
· Eighteen percent of those that have household income between $35,000 and $50,000 got a massage in 2012. Twelve percent of this household income group received a massage in 2011.
College graduates – Thirty-eight percent of massage consumers were college graduates. · Twenty-two percent of college graduates received a massage in 2012 compared to
30 percent in 2011. College graduates on average received 4.9 massages in 2012 compared to 5.4 massages in 2011. Level of consumer education Massage use in 2009 Massage use in 2010 Massage use 2011 Massage use 2012 Completed college 35% 29% 30% 22%
Figure 4. Total use of massage among college graduates
Those 18 to 34 years old – Twenty-six percent of massage consumers were between 18 and 34 years old.
· Fourteen percent* of this group received a massage in 2012 compared to 16 percent in 2011.
· On average, this group received the fewest number of massages in 2012, 2.3 massages. That’s down from the 4.8 massages they received on average in 2011.
Gen-Xers – Twenty-four percent* of massage consumers were between 35 and 44 years old.
· Twenty-three percent of those between 35 and 44 years old received a massage in 2012, a higher percentage than any other age group. Last year 18 percent of this age group received a massage.
Baby boomers - Thirty-six percent* of massage consumers were baby boomers, between 45 and 64 years old.
· Fewer baby boomers received massage in 2012, 17 percent compared to 22 percent in 2011, at the same frequency as last year, 4.7 massages on average. · Nineteen percent of those 45 to 54 years old received massage in 2012 compared
to 23 percent in 2011. However, those 45 to 54 years old received more massages in 2012, 4.2 on average, than in 2011 when they received 3.9 massages on
average.
· Fifteen percent of those 55 to 64 years old received massage in 2012,
considerably less than in 2011 when 20 percent said they received massage in the past year. This group also received fewer massages on average in 2012, 5.2 massages compared to 5.8 massages in 2011.
Seniors – Eleven percent* of massage consumers were 65 years or older.
· Ten percent of seniors received a massage in 2012 compared to 12 percent last year.
· On average, senior consumers received more massage in 2012 than in 2011. Seniors received 5.1 massages in 2012 compared to 3.7 massages in 2011. *The difference between the total of all above age groups and 100 percent is due to three percent of respondents not providing their age.
West and South – Thirty percent of massage consumers reside in the West and 30 percent reside in the South.
· In both the West and the South, the number of consumers receiving a massage declined from 34 percent in 2011 to 30 percent in 2012.
· Furthermore, consumers in the West received fewer massages on average in 2012, 4.4 massages compared to 5.9 massages in 2011.
Applying the Research:
1. Discuss the changing usage of massage across demographic groups and how this might affect the selection of their practice location and their marketing.
2. Remind your students that women receive 69 percent of all massages but that almost all consumers believe in the efficacy of massage
3. Fewer men received massage in 2012 and the mean number of massages they received decreased. Let students know they may need to educate male clients in particular about the benefits of massage.
1D. Why do consumers get massage?
The primary reason consumers get massage continues to be for medical
reasons – pain relief, soreness/stiffness and recovery from injury.
Figure 5. Primary reasons for receiving last massage in 2012
Medical Reasons – About the same percentage of massage consumers got a massage for medical reasons in 2012 as in 2011 – 43 percent in 2012 and 44 percent in 2011.*
· Fifty-five percent of men who received a massage in 2012 did so for medical reasons compared to 48 percent in 2011.
· Fifty-seven percent of massage consumers who had a high school degree or less got a massage for a medical reason in 2012.
· Fifty-six percent of massage consumers who earn $100,000 per year or more got a massage for a medical reason in 2012.
· Fifty-one percent of massage consumers 45 or older got a massage for a medical reason in 2012.
· Thirty-eight percent of women who got a massage in 2012 did so for medical reasons, down from 42 percent in 2011.
The top medical reasons for getting a massage in 2012 were:
· Pain relief/pain management - Nineteen percent of massage consumers received a massage in 2012 for pain relief/pain management, the same as in 2011.
· The number of Americans that ever used massage therapy for pain relief
was 29 percent in 2012 down slightly from 31 percent in 2011.
· For soreness/stiffness/spasms - Thirteen percent of massage consumers got a massage for soreness/stiffness/spasms in 2012, compared to 12 percent in 2011.
o Eighteen percent of male massage consumers received a massage for soreness/stiffness/spasms in 2012, up from 14 percent in 2011.
o Only thirteen percent of seniors (65+) who received a massage in 2012 got a massage for soreness/stiffness/spasms, down from 24 percent in 2011.
· Injury recovery/rehabilitation - 9 percent of massage consumers got a massage for injury recovery/rehabilitation in 2012, the same percentage as in 2011 and 2010.
Americans’ beliefs about medical applications of massage 2010 2011 2012
Massage can be effective in reducing pain. 86% 90% 89%
Massage can be beneficial to health and wellness. 84% 86% 87%
Figure 6. American’s belief about massage in 2012
Relaxation/stress reduction – Thirty-two percent of massage consumers got a massage for relaxation/stress reduction in 2012, up from 30 percent in 2011.*
· Forty-three percent of massage consumers who are college graduates got a massage for relaxation/stress in 2012, up from 40 percent a year ago.
· Forty-two percent of massage consumers that earn between $75,000 and $100,000 per year got a massage for relaxation/stress reduction in 2012, up from 36 percent in 2011.
· Thirty-five percent of women massage consumers got a massage for relaxation/stress in 2012, up from 30 percent in 2011.
*For purposes of this report, relaxation and stress relief were not included under medical reasons for massage.
Pampering/just to feel good/special indulgence - Twelve percent of massage consumers received a massage for pampering/just to feel good/special indulgence in 2012, the same percent as reported in 2011.
· Fifteen percent of women who received a massage did so for pampering reasons in 2012, up from 11 percent in 2011.
· Seven percent of men who received a massage did so for pampering reasons in 2012, down from 16 percent in 2011.
· Twenty percent of Gen Xers, those between 35 and 44 years old who received a massage, did so for pampering related reasons in 2012, up from 8 percent in 2011.
Applying the Research:
1. Consumers continue to use massage therapy for medical reasons. Have your students identify the skills they’ve obtained to meet this consumer demand.
2. More women got a massage for relaxation/stress reduction reasons in 2012 than in 2011. Discuss year to year consumer preferences and how students can best manage changing consumer demands.
3. Gen-Xers, those between 35 and 44 years old, are increasingly getting massage. Brainstorm with your students on how they might market to this demographic.
1E. Where are consumers getting massage?
The most popular place to receive a massage continues to be at a Spa.
Nineteen percent of consumers reported in 2012 receiving their last massage at a spa. The next most popular locations to receive massage were massage therapist’s office/location, client’s home or home of someone they know, massage chain and beauty salon. (See Figure 7.)
Spas – Nineteen percent of all massage consumers received massage at a spa in 2012, down from 23 percent in 2011.
· Twenty-seven percent of female massage consumers got a massage at a spa in 2012 compared to 28 percent in 2011.
· Only two percent of male massage consumers got a massage at a spa in 2012, down from 12 percent in 2011.
Massage Therapist’s office/location - Fourteen percent of massage consumers received a massage at a massage therapist’s office/location in 2011 versus 16 percent of
consumers in 2011.
· Twenty-seven percent of those 45 to 54 years old who received a massage in 2012 received a massage at a massage therapist’s office location, up from 7 percent in 2011.
· Twenty-six percent of massage therapy consumers that earn $100,000 or more received a massage at massage therapist’s office/location in 2012, up from 21 percent in 2011.
· Twenty-five percent of men who got a massage in 2012 did so at a massage therapist’s office/location, the same as last year. Only 9 percent of women massage recipients in 2012 received a massage at a massage therapist’s office, down from 12 percent last year.
Your home or at the home of someone you know - Eleven percent of massage consumers received a massage at their home or at the home of someone they knew in 2012, compared to 13 percent in 2011.
· Twenty-three percent of senior massage consumers (age 65 years old or older) got a massage in 2012 at their home or the home of someone they knew, up from 13 percent in 2011.
· Eighteen percent of massage therapy consumers that earn less than $35,000 got a massage at their home or the home of someone they knew in 2012, down from 29 percent in 2011.
Massage Chains - The percentage of massage consumers that received a massage at a massage franchise chain was 10 percent in 2012, up from 3 percent in 2011. Note that some consumers may not distinguish between a massage chain and a spa.
· Fifteen percent of white massage consumers got a massage at a franchise chain in 2012, up from 3 percent in 2011.
· Fifteen percent of those between 35 and 44 years old got a massage at a massage chain in 2012, up from 5 percent in 2011.
Beauty Salons – Ten percent of consumers got a massage at a beauty salon in 2012, up from 6 percent in 2011.
· Thirty percent of massage consumers with a household income between $75,000 and $100,000 got a massage at a beauty salon in 2012, up from 6 percent in 2011. · Twelve percent of female massage consumers received a massage at a beauty
Hotel/Resorts/Cruises - The percentage of massage consumers that received a massage at a Hotel/Resort/Cruise in 2012 was 6 percent, the same as in 2011.
Chiropractor’s office - The number of massage consumers getting massage at a chiropractor’s office decreased to 5 percent in 2012, down from 7 percent in 2011.
Applying the Research:
1. Help your students identifywhere consumers are most likely to get a massage and what are the demographics of customers most likely to get massage in various settings.
2. Spas continue to be a top venue for receiving massage. Encourage your students to think about how they can incorporate spa elements into their chosen work setting and/or marketing to attract clients.
3. Massage consumers are increasingly getting massage at massage chains such as Massage Envy, Elements and Massage Heights. Have your students discuss the pros and cons of working at a massage franchise.
1F. What did AMTA hear from consumers in its outreach in 2012?
4As part of a major multi-year commitment to public education on the
benefits of massage therapy, AMTA launched its Consumer Awareness
Program by visiting five major metropolitan areas in July and August of
2012. The tour included stops in Chicago, Columbus, Boston, Philadelphia
and New York City.
At each stop, AMTA’s branded van transformed into a massage therapy pop-up zone where consumers received free chair massages and information about the benefits of massage from AMTA member volunteers.
The following data highlights were collected from consumers on computer tablets during the tour*:
· Sixty-three percent of consumers that received a massage at a tour location were female.
· Forty-two percent were between 18 and 34 years old.
· Seventy percent of consumers that received a massage at a tour stop said they receive at least one massage per year.
· Thirty-two percent chose their last therapist based on referral recommendation while fourteen percent said they found their therapist by walking or driving by their
location.
· Forty-five percent cited a medical condition as the primary reason for their last massage.
· Forty-four percent said the primary reason for their last massage was for relaxation, while 11 percent said pampering.
· When asked to name what contributed to their getting their last massage, 36 percent of respondents said location and 27 percent said referral.
· Eighty-nine percent of those receiving massage at a tour stop said they were more likely to recommend massage to their family or friends.
· Seventy-eight percent of consumers that received a massage at a tour stop said they would be more likely to look for an AMTA massage therapist.
* Data collected during the tour may differ from the data found on the 2012 AMTA Consumer Survey due to differences in questions and sample groups and is not to be used for comparison purposes or in place of the data on the 2012 AMTA consumer survey.
Let’s work together on educating the next generation of massage therapists. If you have questions regarding information included in this report or can think of additional data that you would like to have available in the future, please contact us anytime at
[email protected]. We are here to serve your needs.
Section 2 — The Massage Therapy Profession
5Staying current about the latest trends in the massage profession helps
schools give students the best information on which to make decisions
regarding their massage therapy careers.
This section covers information regarding the massage therapy industry including employment, income and work settings.
Key Concerns:
How do you help your students be prepared to respond to changes occurring in the massage profession due to economic and demographic shifts affecting those who receive massage?
Are your students informed about compensation, hours and requirements of various work settings, etc.?
In what ways are the demographics of your school consistent with those of the profession?
Do your students understand the various aspects of managing a massage therapy practice?
Key Findings:
· Most massage therapists are women, previously worked in another profession and they practice a wide array of modalities.
· On average, massage therapists earned $30.76 per hour in 2012. Therapists working in their clients’ homes earned the most at $65 per hour.
· Massage therapists view industry perceptions and the economy as their top challenges.
· More clients are finding massage therapists through social media. · Most massage therapists describe themselves as sole practitioners.
· Massage Envy is the largest employer of massage therapists with over 800 locations in 45 states.
These questions will be answered:
1A. Who is practicing massage therapy?
1B. How much are massage therapists compensated for their work? 1C. What are some of the biggest challenges facing massage therapists? 1D. Where are massage therapists practicing?
1E. What’s the latest on the spa industry and massage therapy? 1F. What impact are massage chains having on the profession?
2A. Who is practicing massage therapy?
Over the last decade, the number of practicing massage therapists increased
by 41 percent.
3According to the 2012 AMTA Industry Survey, massage therapists in the U.S. are:
· Mostly female — Eighty-five percent of massage therapists are women, a fact that hasn’t changed substantially over the last few years.
· Trending younger than previous years— More massage therapists were under the age of 35 this year (41 percent) than last year (25 percent), and fewer were between the ages of 35 and 44 (20 percent in 2012 versus 26 percent in 2011), as well as between 45 and 54 (24 percent in 2012 versus 29 percent in 2011). · Educated — Thirty-six percent of massage therapists have a Bachelor’s Degree
or higher and 90 percent have achieved formal education levels above a high school diploma or GED. This is consistent with previous data. (See Figure 8 below.)
2006 2007 2008 2009 2010 2011 2012
Education (Non-Massage)
High school grad or less 11% 14% 13% 12% 15% 12% 10%
Some college 27 28 27 28 23 27 22 Associate’s Degree 15 14 14 12 13 16 19 Technical/vocational certificate 10 9 11 10 8 8 14 Bachelor’s degree 27 25 26 25 29 27 29 Master’s degree 9 8 8 11 10 9 6 Doctorate 1 2 2 2 1 2 1 Gender Male 15% 15% 12% 15% 13% 12% 15% Female 85 85 88 85 87 88 85
Figure 8. Massage therapist’s profile
Most massage therapists are coming from another profession
· Sole practitioners are most likely to have had a different occupation prior to becoming a massage therapist. (See Figure 9 for more information). This has not changed from 2011 data.
· Therapists working as employees or contractors arecomparatively more likely to enter massage therapy as their first profession. (These types of work settings may attract younger candidates with less prior work experience.)
Figure 9. Was massage therapy your first career choice?
Massage therapists practice a wide array of modalities
The average number of modalities practiced remained constant at seven from 2011 to 2012.
· Top modalities practiced include Swedish massage, deep tissue, chair, trigger point, and hot stone. (Similar to 2011 data.)
2006 2007 2008 2009 2010 2011 2012 Swedish 76% 82% 89% 84% 88% 87% 89% Deep Tissue 66 70 82 77 84 85 85 Trigger Point 35 43 52 49 55 54 56 Sports Massage 32 40 49 45 53 52 53 Neuromuscular 29 28 31 33 38 32 32 Myofascial 28 29 41 46 52 46 47 Reflexology 28 31 46 45 47 47 46 Chair 32 37 58 52 62 62 63 Hot Stone 39 40 55 47 53 57 54 Prenatal/ Pregnancy 28 30 49 44 53 51 52
Figure 10. Top modality specialties of massage therapists
Highlights from Figure 10:
Among massage modalities, Swedish (89 percent) and deep tissue (85 percent) still rank as those most frequently practiced.
The number of massage therapists in the U.S. remained constant from last year but has grown over the last decade 3
Over the past ten years, the estimated number of massage therapists has increased 41 percent.
Between 2011 and 2012, the number of massage therapists grew less than one percent to 307,104. Pennsylvania passed state licensing requirements and began enacting them in 2011, accounting for an increase in massage therapists in licensed states. Over the last five years, there has been a 9 percent increase in the number of massage therapists. This is lower than in previous years, indicating slower growth in the industry.
The following chart illustrates the growth of the total estimated number of massage therapists over time.
Total MTs By Year (LMT and EMT Combined)
120,458 99,105 169,099 144,009 163,002 205,919 217,090 237,189 186,916 203,380 118,281 94,053 85,811 100,929 109,948 97,928 100,244 85,166 88,868 69,915 6% 1% 9% 11% 4% 13% 20% 2% 5% 9% 0% 5% 1% 3% 4% 3% 3% 15% 2% 4% 0 50,000 100,000 150,000 200,000 250,000 300,000 350,000 2003 (217,386) 2004 (221,387) 2005 (253,957) 2006 (260,930) 2007 (269,343) 2008 (280,969) 2009 (288,546) 2010 (291,730) 2011 (305,958) 2012 (307,104) % Change in Total MTs % Change in LMTs Estimated MTs Licensed MTs
Highlights from Figure 11:
In 2012 there were approximately 307,104 massage therapists in the United States, which is slightly up from 305,958 therapists in 2011.
*LMT: licensed massage therapists, MT: massage therapists from non-licensing states
Applying the Research:
1. Discuss the various work options available to your students and the similarities and differences between them so they can make informed decisions about where to work after graduation.
2. Consider the implications of slowed growth in the number of massage therapists with your students as they enter the job market and workplace. How can they use this information to their advantage?
2B. How much are massage therapists compensated for their work?
Massage therapists’ compensation per hour changed minimally from last
year.
How much are clients paying for massage?
· In 2012, clients paid an average of $61.60 for one hour of massage, an increase of $2.60 from 2011.
· Hotels, resorts and cruises charged clients the most, an average of $96.49 per hour. · Hospitals and medical offices charged the least, an average of $49.69 per hour.
Average hourly earnings of massage therapists stayed about the same as last year
Massage therapists were paid an average of $30.76 per hour (including tips) across all work settings in 2012. That’s about the same as in 2011, $31.11 per hour*.
Therapists working in their client’s homes made the most, an average of $65.47 per hour. Those working in massage only franchises and chains made the least, an average of $18.12 per hour.
Massage therapists earned tips more frequently in 2012 than in 2011. Thirty-six percent of therapists reported receiving tips 80-100% of the time in 2012 versus 30 percent in 2011.
Massage therapists are working more hours than last year
On average, massage therapists worked 21.6 hours per week in 2012, a significant increase from 19.6 hours per week reported in 2011. Fifty-two percent of massage therapists would like to work more hours in massage therapy. This is down markedly from sixty percent wanting to work more hours in 2011. On average, therapists who want to work more hours would like to add an average of 12 hours to their work week.
Massage therapists were paid for 17.1 of the 21.6 average hoursthey worked per week in 2012, or 79 percent of the time they spent at work.
Health benefits stayed the same in 2012
Massage therapists were about as likely to receive health benefits from their employers in 2012 (34 percent) as they were in 2011 (36 percent).
Massage therapists continued to depend heavily on repeat clients
In 2012 massage therapists saw an average of 41 clients each month, returning to 2010 levels after a decrease to 38.9 clients per month in 2011.
Repeat clients made up 71 percent of massage therapists’ appointments in 2012 with new clients comprising the remaining 29 percent, essentially the same as last year.
Total Clients (#) % New Clients % Repeat Clients
Total 41 29% 71%
Sole Practitioner 41 24% 76%
Contractor 44 36% 64%
Full time employee 63 39% 61%
Part time employee 38 36% 64%
Highlights from Figure 13:
The majority of clients that massage therapists see in a month are repeat clients (71 percent).
Full time employees see the most clients of all work settings over the course of a month (63 clients per month).
Massage therapists continued to barter or trade their services, but less than in previous years
Seventy-three percent of massage therapists bartered or traded their services. That’s down from 83 percent in 2011. The number of therapists who said they never barter their
services increased from 2011, and the number of therapists who said they barter every couple of weeks or more often decreased from 2011.
Figure 14. Percentage of massage therapists bartering services
Highlights from Figure 14: Seventy three percent of massage therapists reported bartering massage services in 2012, fewer than in 2011.
Where consumers find massage therapists and therapists find clients.
Massage therapists obtain clients from many sources. In 2012, both massage therapists and their clients cite referrals as the primary method they used to locate each other. See Figure 15 below.
% of consumers find therapists via this medium
% of therapists who promote via this medium
Referrals by clients 74% 72%
Internet/websites 37 49
Community/local events 26 43
Social media 20 40
Locator service 8 15
Figure 15: Where consumers found therapists and where therapists promoted their services.
As shown in Figure 16, referrals from other massage therapists decreased slightly from 2011 to 2012, down 1 percent.
Figure 16. Frequency of receiving referrals from other massage therapists
Massage therapists employed various advertising methods but reduced their use of advertising overall
Massage therapists advertised their services in a variety of ways in 2012, as shown in Figure 17 below. This year, therapists reported advertising their services less frequently than last year with more indicating they did not advertise their services at all.
Medium 2007 2008 2009 2010 2011 2012 Advertise Services 72% 72% 68% 77% 94% 90% Internet/website --- 24 28 50 58 49 Social media --- --- 52 55 45 40 Referrals 37 40 30 30 89 72 Community/Local Events 38 38 33 35 56 43 Radio 5 5 4 1 4 3
Figure 17. Media massage therapists use to advertise their services
More massage therapists used social media in their practices for purposes beyond advertising6
Massage therapists continued to increase their use of social media to stay in touch with clients. In 2012, 36 percent of massage therapists used a social network to stay in touch with clients, a significant increase over the 23 percent of massage therapists reporting
decline in use of social media for advertising implies that massage therapists could be using social media for personal reasons as well as professional purposes.
More massage therapists have their own websites6
The last year, 2012, saw major growth in the number of massage therapists with their own website, with 46.5 percent indicating they have a website for their practice, up from 39.8 percent in 2011 and 38 percent in 2010.
Massage business continued to improve for sole practitioners and independent contractors
Fifty-three percent of sole practitioners and independent contractors indicated that their business improved in 2012, continuing an upward trend since 2010. Only 14 percent reported their business had declined over the past year.
Applying the Research:
1. The latest information about compensation, tips, and hours for each setting can help students negotiate their starting pay in the industry.
2. Make sure that your students understand that average hourly pay and annual salary information for massage therapists cannot be compared to a standard forty-hour work week.
3. Massage therapists practice an average of 7 modalities. Discuss the importance of knowing different massage techniques with your students, and how to find training in new modalities that may interest them.
4. Seventy-one percent of appointments in 2012 came from repeat clients, and this is a figure which has not changed much since 2008. Discuss the importance of
maintaining current clients while recruiting new clients to a massage practice with your students.
5. Consumers are finding massage therapists online more and more. Make sure your students create a robust online presence to give consumers the best opportunity to locate them.
2C. What are some of the biggest challenges facing massage therapists?
In 2012, massage therapists cited industry perception and business/economy
issues equally as their biggest professional challenges.
Massage therapists are affected by the perception of their industry
· Massage therapists continued to want to be recognized and respected as health care professionals and to seek more public awareness of the massage therapy profession to improve the industry’s reputation.
· The struggling economy continued to affect massage therapists as well.
· Figure 18 below lists the top challenges reported by massage therapists overall and by work setting.
Total Sole
Practitioner
Contractor Full Time Employee Part Time Employee Industry Perceptions - Being recognized / respected as health care professionals, public awareness 71% 70% 70% 69% 68% Business/Economy Issues - Poor economy, maintaining steady business / finding new clients, licensing
70% 69% 72% 67% 68%
Job Factors - Avoiding personal injury, low income, finding/maintaining employment 34% 27% 30% 29% 37% Education Issues - Workshop costs/finding CE classes, standards of education/training inequalities 31% 31% 35% 37% 38%
Figure 18. Largest challenges facing massage therapists
Applying the Research:
1. How do business and economy issues affect practicing massage therapists in your area? Invite a local massage therapist to discuss the reality of these issues with your students.
2D. Where are massage therapists practicing?
Massage therapists tend to work in multiple settings and most describe
themselves as sole practitioners.
AMTA’s research on the massage industry in 2012 shows that massage therapists: · Continued to travel to their clients’ homes to provide massage. Massage provided in
the client’s home increased to 48 percent in 2012, the second year this setting topped the list.
· Provided massage in their offices as well. This number increased to 39 percent in 2012, as compared with 36 percent in 2011.
· Did not provide massage out of their homes as frequently. Massages provided in therapists’ homes decreased to 36 percent in 2012, down from 41 percent in 2011. · Results of the 2012 AMTA Industry Survey and information from other sources
indicated 5 percent (+ or – a few percent) of massage therapists work in massage-therapy only franchises or chains.
See Figure 19 for the visual representation of this data.
Figure 19. Massage therapists’ work settings in 2012
Highlights of Figure 20: Nearly 70 percent of massage therapists describe
themselves as sole practitioners. Full-time employees comprise the smallest group of massage therapists.
Massage therapists worked more hours in 2012
The average work week of massage therapists increased significantly to 21.6 hours in 2012 from 19.6 hours in 2011. Fifteen of those hours, or 70 percent, were spent
performing massage. The other 6.5 hours were spent on marketing, performing general business tasks and other tasks. Massage therapists said their ideal work week would be 34 hours, an increase of 12 hours from their current work week. See Figure 21 for more detail on this.
Figure 21. An average work week of a massage therapist
Massage Therapists’ Annual Income
Massage therapists made an average of $20,879 per year from the profession. Sole practitioners, contractors and full-time employees all earned a higher than average income from massage therapy. Part-time employees were the only group who made less than the average.
Massage therapy comprised 73 percent of the typical therapist’s household income for 2012.
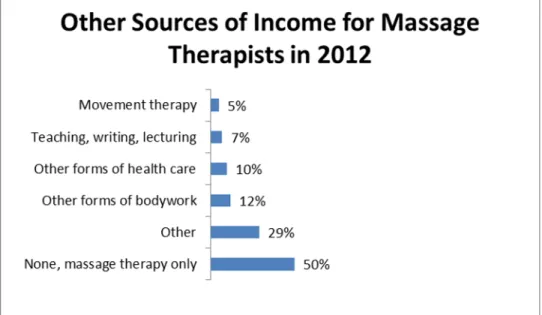
Fifty percent of therapists earned all of their income for the year from massage therapy. See Figure 22 for the breakdown of other sources of income for massage therapists.
Figure 22. Sources of secondary income for massage therapists
Applying the Research:
1. Help your students develop a plan on how they will support themselves until their massage practice brings in enough revenue to live on.
2. More massage sessions are occurring at consumers’ homes or work places than in the massage therapist’s home. What are some strategies you can give your students to manage several different work environments over which they limited control?
2E. What’s the latest on the spa industry and massage therapy?
7According to the ISPA 2012 U.S. Industry Study covering 2011activity, spa visits
and revenue increased over 2010, showing a continued rebound in the spa industry
that started in 2009.
Spa visits increased in 2011
· Spa visits increased 4 percent from 2010 to 2011.
· Spa industry revenue surpassed 2008 levels in 2011, increasing to $13.4 billion, the highest revenue in the last five years.
· Revenue per spa establishment increased 4.8 percent from 2010 to 2011 but is still 34 percent below 2001 numbers, when the revenue was $1.024 million per
establishment.
Year Estimated spa visits Estimated spa
industry revenue Spa revenue per establishment
2007 138 million 10.9 billion $ 607,000
2008 160 million 12.8 billion $ 601,000
2009 143 million 12.3 billion $ 594,000
2010 150 million 12.8 billion $ 642,000
2011 156 million 13.4 billion $ 673,000
Figure 23. Information on spa revenue and visits
The number of spa locations declined for the third straight year in 2011
The number of spa locations continued to decline, from 19,900 locations in 2010 to 19,850 locations in 2011 (See Figure 24).
Figure 24. Growth in Spa Locations (US)
Other findings regarding the spa industry:
· Average visits per spa establishment continued to increase, to 7,859 in 2011 from 7,522 in 2010. This is a 4.5 percent increase.
· The average number of employees per spa increased from 16 to 17 from 2010 to 2011, a rise of 5.6 percent. Jobs in the spa industry as a whole increased 2 percent to 338600 in May 2011, from 332,000 in May 2010. There was an increase in hiring of full-time employees and a decrease in hiring of part-time employees and contractors. · The average price of spa services rose only 0.6 percent between 2010 and 2011, even
as revenue and spa visits increased substantially more.
· Ninety-two percent of spas offered massage services in 2011. · Spa clientele was 77 percent female and 23 percent male in 2011.
Massage therapists’ employment in spas dipped slightly in 20125
· Twenty-five percent of massage therapists worked in spas or salons in 2012, down from 29 percent in 2011.
Note that the 2012 AMTA Industry Survey references 2012 data while the ISPA 2012 U.S. Spa Industry Study references 2011 data.
Applying the Research:
1. The spa industry is returning slowly to its earlier size, but consumers are not returning in high numbers. How can massage therapists employed in spas help increase the number of massage customers?
2. Provide information to your students about working in spas including work
requirements and environments. AMTA’s Career Success Series and online Career Assessment Quiz help your students determine the best work setting for them.
2F. What impact are national massage chains having on the profession?
Results of the 2012 AMTA Industry Survey indicate national chains
continued to expand and provide steady employment and work experience
for many massage therapists.
National massage chains continued to expand and diversify their services
National massage chains have been growing for the past several years. In 2012, this growth continued, with most major massage chains opening new locations.
Consumer use of massage chains increased in 2012, with 10 percent of consumers indicating a chain as the location of their last massage. In contrast, only 3 percent of consumers got their last massage at a chain in 2011. Note that some consumers may not realize the difference between a spa and a national massage chain.1
Five percent of massage therapists worked at a national massage chain in 2012, down from 7 percent in 2011. Here again, some therapists may report that they work in a spa as opposed to a franchise or chain.
The main players in the massage chain market include:
Massage Envy was established in Arizona in 2002, and has grown to over 800 locations in 45 states, opening its 800th location in September of 2012. The company reports it will open an additional 250 locations by the end of 2015. In 2011, Massage Envy had 742 locations in 44 states and was the largest employer of massage therapists, with a staff of roughly 21,000 across all franchises. These therapists provide over 324,000 massages every week. Massage Envy offers an annual membership for $59 per month which includes a 50-minute massage. Massage Envy Spa locations also offer therapeutic facials for just $10 more than a massage session.
Elements Therapeutic Massage has over 130 locations in 32 states, with an additional 53 locations scheduled to open soon. Elements’ Wellness program carries a monthly fee of $59, which includes one hour-long massage, and members receive discounts of at least $20 on each additional massage. Other Wellness program benefits include the ability to
member or significant other, and online members-only specials. Non-member pricing for a one-hour massage is approximately $89. Elements announced a partnership with
Everest College in November 2011, where Elements will recruit Everest graduates in exchange for input into the massage therapy training program at Everest.
Massage Heights originated in San Antonio, Texas in 2004. The company’s goal is to open over 1,600 US locations by 2015. Massage Heights had 87 locations in 18 states, and 4 locations in Canada, an increase of 13 locations over 2011. The company has a similar membership model to Massage Envy as members pay a rate of $49.99 per month for one 50-minute massage. Additional massages can be purchased for $39.99, which is half off the non-member rate. Massage Heights offers half-hour, one and a half-hour and two-hour massages as well. The company recently announced a partnership with the American Cancer Society’s DetermiNation training program, and has also partnered with the Rock ‘N Roll Marathon series.
XPresSpa and Massage Bar continues to operate in many domestic airports. XPresSpa was in 28 terminals in 14 U.S. airports in 2012, and has 3 locations in an international airport. Thirteen additional locations are listed as coming soon. XpresSpa has a membership card which is free and gives a $5 reward for every $100 spent on services and products. Massage Bar, which has been in business since 1994, has 14 locations in 9 U.S. airports, a slight increase over 2011.
Zen Massage Centers is based out of North Carolina, and currently has 14 locations in 7 states. The chain has no membership fees and markets itself as having affordable
massage therapy available on the client’s terms. Massages are offered in hour, one-and-a-half and two hour increments, and Reiki, Reflexology and Aromatherapy can be added on to any massage for an additional charge. The company offers 11 different massage modalities for clients to utilize. Pricing is specific to each location, but most list a 50-minute Swedish massage for $39.95 or $49.95.
Other companies still in the market include LaVida Massage, MassageLuxe, The Great American Backrub and several other regional chains.
Applying the Research:
1. Massage chains are being used more commonly by consumers, and offer a consistent experience and increased access to massage with affordable rates. How does this change the landscape of the profession?
2. New services are being offered at many of the major chains, including facials and various modalities of massage. Consider offering at least introductory training in many of these services and modalities to give your students the best possible
Section 3 — Health Care and the Massage Profession
5Consumers continue to increase their use of massage for medical reasons.
As the health care industry continues to grow, health care providers are
more commonly viewing massage therapy as a legitimate option to address
health concerns.
This section discusses dynamics of the health care industry and the participation of massage therapists in the industry.
Key Concerns:
How is massage therapy being affected by the growth of the health care industry? How much are insurance companies reimbursing massage therapists?
In what ways is massage therapy being integrated into various health care environments?
In the section, you’ll…
· Obtain an update regarding employment in the health care industry and how this affects massage therapists.
· Learn about examples of major health institutions incorporating alternative medicine treatments, including massage therapy.
· See how consumers are using massage for their health.
· Read about various insurance reimbursement opportunities for massage therapists.
As you examine these timely topics:
3A. Continued growth in the health care industry
3B.Growth in the integration of Complementary and Alternative Medicine (CAM) treatments into hospitals
3C. Consumer use of massage as part of an integrated approach to health care 3D. Massage and insurance
3A. Continued growth in the health care industry
Between October 2011 and October 2012, health care employment
increased 5.8 percent in the industry category that includes massage
therapists.
8· Overall, employment in the health care industry increased 2 percent from November 2011 to November 2012 to 17 million. The health care category of “Outpatient care centers,” which includes massage therapists, as defined by the Bureau of Labor Statistics, experienced an employment increase of 5.8 percent over this period.
· The Bureau of Labor Statistics projects that the health care and social assistance sectors of the economy will add the most jobs of any economic sectors by 2020. · Continued increases in both the overall size of the healthcare industry and in
consumer spending on health care demonstrate increased demand for health care related products and services. These trends are expected to continue as the US population ages.
3B. Growth in the integration of Complementary and Alternative
Medicine (CAM) treatments in hospitals.
Major health systems throughout the United States are incorporating CAM
therapies, including massage therapy, into treatment plans for patients.
· Duke Integrative Medicine in Durham, North Carolina offers acupuncture, behavioral health, movement/fitness, nutrition counseling, as well as massage and bodywork. This provider also allows the public to utilize its services without a doctor’s referral, increasing accessibility and knowledge of CAM therapies. Duke will also be conducting clinical research on massage therapy.
· Mayo Clinic’s Complementary and Integrative Medicine Program offers patients access to massage therapy, meditation and other CAM therapies by recommendation of the physicians at Mayo Clinic. This program has been in place since 2001 and treats more than 5,000 patients each year.
· Northwestern Memorial Hospital in Chicago, Illinois offers integrative care as part of treatment plans, and employs massage therapists, acupuncturists, naturopaths, and other CAM practitioners. Their physicians are trained in both traditional and
patients’ insurance plans. As insurance is regulated by the state, coverage also varies from state to state. AMTA expects such integrations of massage therapy into hospital and major medical facilities to continue to grow in the future.
Massage therapists support the integration of massage in health care. As such integration continues to grow, more scientific research is being conducted on the efficacy of massage.
Massage therapists continue to support integration of massage therapy into health care
The number of massage therapists who think that massage therapy should be considered part of the health care field has remained constant at 97 percent since 2010. Therapists indicated the following as the most important ways to accomplish this integration (percentages are of respondents listing item as their top choice):
· Massage prescribed/referred by health care provider (44 percent)
· Massage therapists working as part of a health care team alongside other complementary practitioners (23 percent)
· Massage therapists working as part of a health care team within a hospital or clinic (14 percent)
· Making massage available in hospitals and clinics (11 percent) · Making massage available in integrated clinics (5 percent) · Massage supervised by a health care provider (4 percent)
Clinical studies on the efficacy of massage are ongoing
AMTA continues to leverage its existing relationships within the healthcare industry to forge new partnerships with major organizations to conduct research studies on the efficacy of massage. The results of these studies will provide more evidence based research about massage therapy. Increasing the base of clinical knowledge and research about massage therapy will further enhance the integration of massage therapy into healthcare and will increase its use by patients. In recent years, there has been a shift towards comparative effective research, a methodology designed to yield evidence on effectiveness, benefits and harms of different treatment options. This type of research compares massage therapy to other interventions.
The Massage Therapy Foundation promotes research literacy and capacity in the profession by granting funds for research and educational initiatives related to massage therapy, by providing direct consultation to the medical and research communities, and by educating massage therapists about the world of research.
There are many resources you can use to access current and past studies on the efficacy of massage:
www.spaevidence.com www.pubmed.gov
www.massagetherapyfoundation.org www.nccam.nih.gov