INTERNET APPENDIX
TO
“TIME FOR A CHANGE”:
LOAN CONDITIONS AND BANK BEHAVIOR
WHEN FIRMS SWITCH BANKS
∗This appendix contains additional material: I. Assumptions
II. Simulations III. Static Results IV. Dynamic Results V. Adverse Selection. The tables are sequentially numbered.
*
Citation format: Ioannidou, Vasso., and Steven Ongena, 2010, Internet Appendix to “Time for a Change: Loan Conditions and Bank Behavior when Firms Switch Banks,” Journal of Finance 65, 1847-1877, http://www.afajof.org/supplements.asp. Please note: Wiley-Blackwell is not responsible for the content or functionality of any supporting information supplied by the authors. Any queries (other than missing material) should be directed to the authors of the article.
I. ASSUMPTIONS
Banking models that incorporate hold-up rest on two key assumptions:
(A1) Relationships mitigate informational asymmetries between firms and banks.
(A2) Relationships create informational asymmetries between inside and outside banks that
are alleviated by observable firm information.
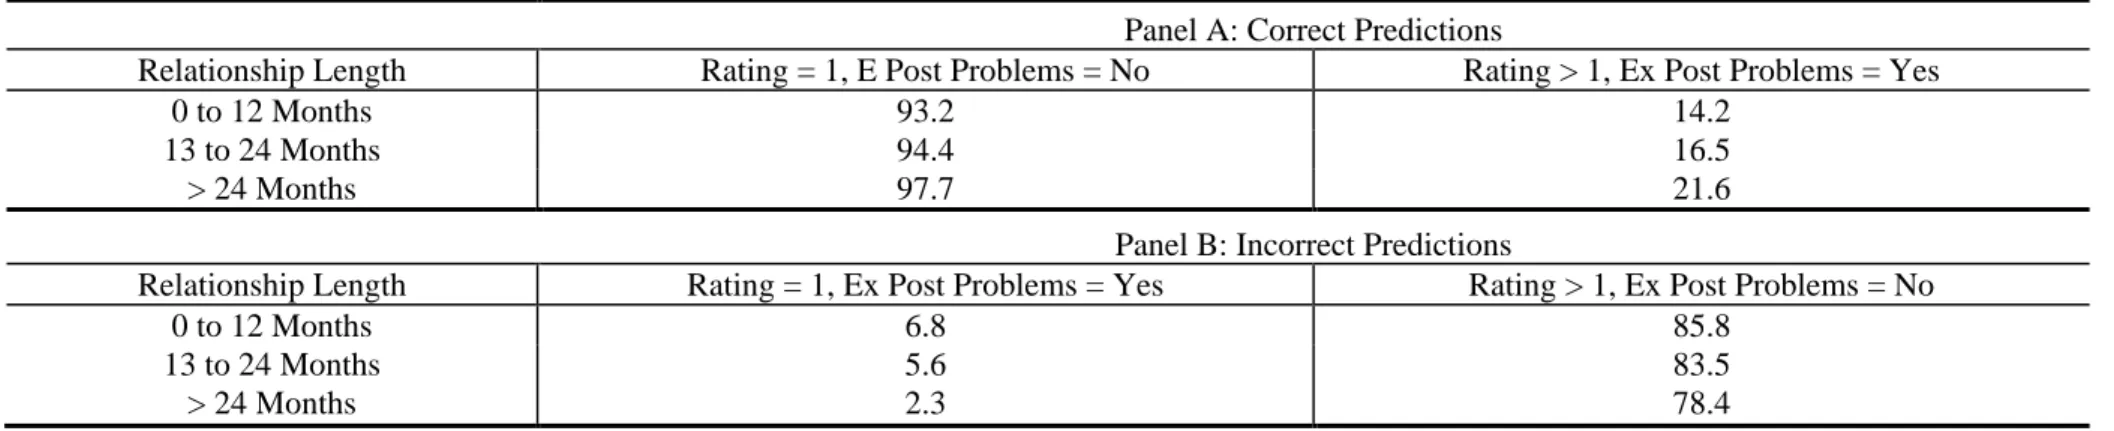
We analyze A1 by studying the relationship between credit ratings at origination and ex post
loan performance over the course of a lending relationship. According to A1, ratings should
become better predictors of ex post loan performance as the length of a relationship increases.
Results in Table IA.I show this to be the case. In particular, the percentage of loans that are
marked as risky at origination (i.e., receive a rating greater than one) and turned out to have
repayment problems (i.e., overdue payments or default) increases with relationship length.
Similarly, the percentage of loans that receive the best rating and do not turn out to have any
repayment problems also increases with relationship length, consistent with A1.
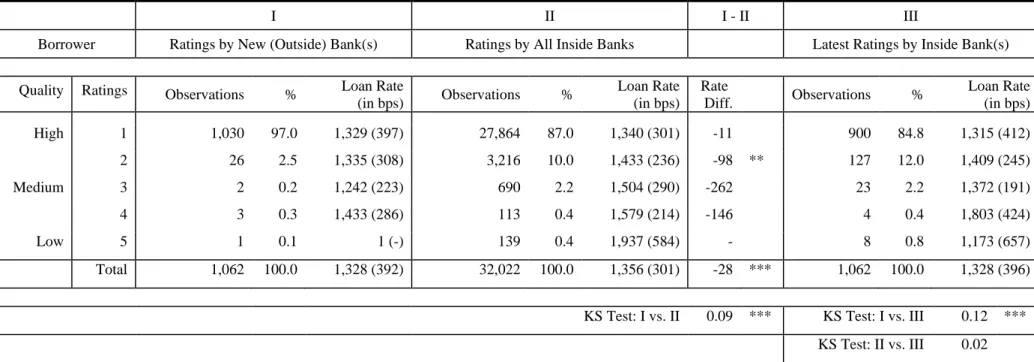
Next we turn to A2 by studying the ratings and loan rates that the inside and outside banks
gave to their switching and nonswitching firms. Columns I and II of Table IA.II report the
credit ratings of switching and nonswitching loans, respectively. The outside banks assess a
remarkable 97% of all switching loans to be of the highest credit quality, while inside banks
think that only 87% of their loans are of the highest quality. Although this percentage is still
quite high, the Kolmogorov-Smirnov (KS) test for the equality of the two populations,
reported in the last row of the table, rejects the null hypothesis of equality between the two
distributions, suggesting that switchers are better firms.
However, when in Column III we tabulate the switching loans using the switchers’ most
recent ratings from their inside banks (instead of the outside banks’ ratings), an interesting
pattern emerges. According to the inside banks only 84.5% of the switching loans would
warrant the best rating. The KS test indicates that this distribution is not equal to the outside
banks’ rating distribution, but it is equal to the distribution of nonswitching loans. Hence,
according to the inside banks, switchers are not different from, or are even slightly worse than
the average nonswitcher, suggesting that the inside banks rate switching firms more
conservatively than the outside banks.
Table IA.II also provides information about the relationship between ratings and loan rates.
Comparing the average loan rates for each rating category in Columns I and II, we see that
inside loans with worse ratings carry higher loan rates, but that most outside loans are given
the best rating and that even those with worse ratings do not carry higher rates. When in
Column III the outside loans are grouped according to the borrowers’ most recent inside
ratings, risk premia emerge again. Hence, it appears that the outside banks give almost all of
their new customers the best rating, but rely on the inside banks’ observable ratings to price
these loans, consistent with A2.
1, 2But why would the outside banks do this? Outside banks may find it optimal to initially
assign the top rating to all switching firms and adjust their ratings only afterwards as they
become more informed. Evaluating new customers might be very expensive for banks as very
little information is known outside a bank-firm relationship or the credit registry. If outside
banks recognize their informational disadvantage, assigning the top rating instead of any other
rating should be optimal as it reduces loan loss provisioning and makes it easier to justify the
lower loan rate.
1
In unreported regressions (including a constant and the rating) both contemporaneous and past inside ratings explain the loan rate in a statistically significant and economically relevant way. This is not the case for the ratings given by the outside banks.
2
Evidence presented in Table IA.XIV also provides evidence consistent with A2. Information shared through the registry helps banks predict future loan performance. Nevertheless, some information asymmetries remain as information that is unobservable to the outside banks is still useful in predicting future loan performance.
Table IA.I
Ratings and Their Predictive Power During a Bank – Firm Relationship
The table reports the percentage of new loans with a rating equal to or larger than one that either does not have or has ex post repayment problems (overdue payments or default). Relationship length is divided into three groups: 0 to 12 months, 13 to 24 months, and longer than 24 months. Correct predictions are Panel A and incorrect predictions in Panel B. We use only loans that are not right-censored (30,196 loans instead of the 33,084 new loans in our sample).
Panel A: Correct Predictions
Relationship Length Rating = 1, E Post Problems = No Rating > 1, Ex Post Problems = Yes
0 to 12 Months 93.2 14.2
13 to 24 Months 94.4 16.5
> 24 Months 97.7 21.6
Panel B: Incorrect Predictions
Relationship Length Rating = 1, Ex Post Problems = Yes Rating > 1, Ex Post Problems = No
0 to 12 Months 6.8 85.8
13 to 24 Months 5.6 83.5
Table IA.II
Ratings and Loan Rates by Inside and Outside Banks
The table lists (I) the ratings of the switcher by the new (outside) banks at the time of the switch, (II) the ratings by all inside banks of all staying loan initiations during the sample period at the time of the loan origination, and (III) the latest ratings of the switcher by the inside bank(s). The first column of the table lists the ratings (1=best, 5=worse). The columns in each panel report the number of observations, the percentage (%) observations, and the mean (and standard deviation) of loan rate in each rating class, in basis points (bps). The panel I-II lists the difference in loan rates, in basis points, and the significance level of an F-statistic for a test for the equality of means. The Kolmogorov-Smirnov (KS) test for the equality of the two populations is reported in the last row (Arsham (2006)). *, **, and *** indicate significance at the 10%, 5%, and 1% levels, two-tailed.
I II I - II III
Borrower Ratings by New (Outside) Bank(s) Ratings by All Inside Banks Latest Ratings by Inside Bank(s)
Quality Ratings Observations % Loan Rate
(in bps) Observations % Loan Rate (in bps) Rate Diff. Observations % Loan Rate (in bps) High 1 1,030 97.0 1,329 (397) 27,864 87.0 1,340 (301) -11 900 84.8 1,315 (412) 2 26 2.5 1,335 (308) 3,216 10.0 1,433 (236) -98 ** 127 12.0 1,409 (245) Medium 3 2 0.2 1,242 (223) 690 2.2 1,504 (290) -262 23 2.2 1,372 (191) 4 3 0.3 1,433 (286) 113 0.4 1,579 (214) -146 4 0.4 1,803 (424) Low 5 1 0.1 1 (-) 139 0.4 1,937 (584) - 8 0.8 1,173 (657) Total 1,062 100.0 1,328 (392) 32,022 100.0 1,356 (301) -28 *** 1,062 100.0 1,328 (396)
KS Test: I vs. II 0.09 *** KS Test: I vs. III 0.12 *** KS Test: II vs. III 0.02
II. SIMULATIONS
A.
Main Building Blocks of the von Thadden (2004) Model
In Sharpe (1990) and Rajan (1992) corporate borrowing under asymmetric information may
result in long-term bank-firm relationships. von Thadden (2004), following Fischer (1990),
derives the unique mixed-strategy equilibrium to the dynamic Bayesian competition game
between the inside and outside bank. We provide an abridged version here.
A randomly drawn firm without funds in the most stylized setup in von Thadden (2004)
chooses to invest a fixed amount
I
tin the beginning of two periods
t
=
1
,
2
to receive a
random return at the end of each period. The return
X
tdepends on the firm’s quality
H
L
q
=
,
(low or high) and is given by
g
(
I
t)
I
twith probability
p
qand zero otherwise, with
H
L
p
p
<
, where
g
is strictly decreasing and concave,
g
(
I
)
≥
1
+
r
for some
I
, and
r
is the
net interest rate for banks. The proportion of high quality firms equals
θ
∈
( )
0
,
1
and is
common knowledge. The banks do not know the individual firm’s quality.
Banks are risk neutral, compete à la Bertrand, and have unlimited access to funds at
r
. The
bank financing the first-period project observes its outcome
γ
, which equals
S
if the
first-period result is
X
1and equals
F
if it equals zero. The outside banks do not observe the
first-period project outcome.
Without binding long-term contracting possibilities, intertemporal profit transfers, or other
intertemporal contractual links, the specific dynamic game structure detailed in von Thadden
(2004) has a unique mixed-strategy equilibrium.
Let
p
=
θ
p
H+
(
1
−
θ
)
p
L,
(
)
1
[
p
2H(
1
)
p
L2]
p
S
p
=
θ
+
−
θ
,
and
[
p
Hp
Hp
Lp
L]
p
F
p
(
1
)
(
1
)(
1
)
1
1
)
(
−
+
−
−
−
=
θ
θ
. The zero-profit loan rates for pooling,
success, and failure are then equal to
p
r
r
p=
+
+
1
1
,
)
(
1
1
S
p
r
r
S=
+
+
, and
)
(
1
1
F
p
r
r
F=
+
+
,
respectively.
The inside bank’s equilibrium strategy in
t
=
2
is to offer
r
(
F
)
=
r
Fwith certainty and is an
atomless distribution on
[
r
P,
r
F]
for
γ
=
S
with density
[
]
2)
1
(
)
1
)(
(
)
1
(
)
1
)(
(
)
(
r
r
S
p
r
r
S
p
r
h
iS p+
−
+
+
−
+
=
.
The outside bank’s equilibrium strategy has a point mass of
1
−
p
(
S
)
at
r
=
r
Fand an
atomless distribution on
[
r
P,
r
F)
with density
)
(
)
(
)
(
r
p
S
h
r
h
o=
iS.
B.
Simulation
We simulate the inside and outside banks’ equilibrium strategies in the von Thadden (2004)
model (as in Black (2008)). We set
r
=
4
.
5
%
(around 50 basis points above the mean federal
funds rate over the sample period),
θ
=
0
.
85
,
p
H=
0
.
95
, and
p
L=
0
.
75
, such that the
pooling rate
r
pequals 13.59% (which is around the mean loan rate observed over the sample
period). We draw 10,000 times. For each draw we record the loan rates offered by the inside
and outside bank in the second period. If the outside offer is lower than the inside offer the
firm switches to the outside bank, otherwise the firm stays with the inside bank.
Figure IA.1 summarizes the simulation outcomes. In the first period firms pay the pooling
loan rate that equals 13.59%. In the second period, 14 out of 15 low quality or “bad” firms
switch and on average pay a loan rate that equals 14.76%. Bad firms that do not switch pay
22.04% (=
r
F, the loan rate offered by the inside bank with certainty to bad firms), that is, 845
bps (= 2,204 – 1,359) higher than the pooling rate in the first period, and 38 out of 75 high
quality or “good” firms also switch to an average loan rate that equals 14.03%. The 47 good
firms that stay pay on average 14.21%, which is 62 bps higher than the pooling rate.
Figure IA.2. Simulation results.
The figure
displays the loan rates paid by good and bad
firms that stay and switch.
Next we compare the offered with the accepted loan rates in a Table. All bad firms receive
an inside offer that equals 22.04% and only bad firms that receive a similar outside offer stay.
In contrast, good firms that stay received outside offers that were on average 210 bps higher
than the inside offer they accepted (1,421 – 1,631). Bad firms that switch on average cut their
loan rates by 728 bps (1,476 – 2,204) while good switchers on average obtain a cut of 162 bps
(1,403 – 1,565).
Loan Rate
Proportion Accepted Offered
in % in bps in bps Period 1 Pooled Firms 100 1,359 1,359 Period 2 Non-Switchers Bad Non-Switchers 1 2,204 2,204 Good Non-Switchers 47 1,421 1,631 Switchers Bad Switchers 14 1,476 2,204 Good Switchers 38 1,403 1,565
Accepted - Offered Loan Rates
Switchers 100 -299
Bad Switchers 27 -728
Good Switchers 63 -162
With Matching on Firm Quality
Switchers - Non-Switchers 100 -202
Bad Switchers - Bad Non-Switchers 26 -728
Good Switchers - Good Non-Switchers 74 -16
Random Matching
Switchers - Non-Switchers 100 -20
Non-Switchers - Pooled Firms 100 83
Bad Non-Switchers - Pooled Firms 3 846
C.
Matching
Unaccepted offers are not observable in the Bolivian credit register and are approximated by
matching switchers to nonswitchers that accepted offers, which are observable. However, in
the von Thadden (2004) model the offers accepted by good firms are on average lower than
the unobserved offers the good switchers choose not to accept (there is no difference between
the unaccepted and accepted inside offers to bad firms as the inside bank offers all bad firms
F
r
). To gauge the magnitude of this “downward bias” in the estimate of the rate cut the good
switchers obtain, we replicate our actual matching procedure.
We first assume
firm quality is fully observable
and match each switcher with a nonswitcher
of equal quality that is drawn with replacement from the set of nonswitchers of equal quality.
Our simulation suggests that switchers pay on average 202 bps less than nonswitchers. This
estimate is 97 bps lower than the 299 bps average difference between accepted and offered
loan rates. The reason is simply that the outside loan rates that are accepted by the good
switchers are on average higher than the inside rates accepted by good nonswitchers (to break
even the outside bank cannot bid more aggressively for all firms than the inside bank can bid
for the good firms).
Next we assume
firm quality is unobservable
and match each switcher with a nonswitcher
that is drawn with replacement from the set of all nonswitchers. Now our simulation indicates
a rate differential of on average only 20 bps. The intuition for this finding is straightforward
and independent from any underlying parameter settings: As bad firms are more likely to
switch and good firms are more likely to stay, without quality matching the loan rates for bad
switchers are more likely to be compared with the loan rates obtained by good nonswitchers.
Hence, random matching within von Thadden (2004) results in a lower average observed rate
cut. On the other hand, as in the first period, all firms pay the pooling rate and the increase in
loan rate from period one to two (which on average equals 83 bps in our simulation) is always
correctly assessed independent of the observability of firm quality, at least within the confines
of this model.
Next, we assess the magnitude of the difference in sensitivity analyses over reasonable
ranges of all underlying parameters. For example, the difference is largest in absolute terms if
the proportion of good firms equals one-half, in which case the probability of a random
mismatch is highest (and the percentage point difference between the proportion of bad
switchers and the proportion of bad firms is the highest). Qualitatively the results are further
unaffected, however.
To conclude, within the von Thadden (2004) model any observer can get a correct estimate
of the loan rate increase that occurs over time when firms stay with their inside banks and a
conservative estimate of the loan rate cuts that occur when firms switch. The better the match
on firm quality, the less conservative the rate cut estimate.
III. STATIC RESULTS
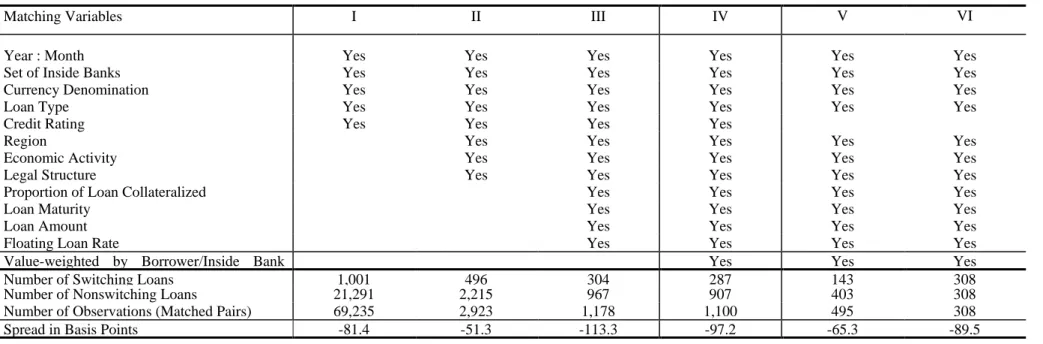
Table IA.III
Spreads between Interest Rates on Switching Loans and Rates on Matched Loans Given by Inside Banks Using Fewer Matching
Variables, No Value-Weighting, Subsamples, and One Observation per Switching Loan in Comparison to Column I in Table III
We assess the spread between the interest rate on a switching loan and the interest rates on new loans obtained (by other firms) from the switchers’ set of inside banks. We match on the indicated variables. We regress the spreads on a constant and report the coefficient on the constant. We cluster at the switching firm level and report robust standard errors between parentheses. We also report the difference between the mean interest rate on the switching loans and the mean interest rate on the nonswitching loans in each column. We report standard errors between parentheses. *, **, and *** indicate significance at the 10%, 5%, and 1% levels, two-tailed.Matching Variables I II III IV V VI
Year : Month Yes Yes Yes Yes Yes Yes
Set of Inside Banks Yes Yes Yes Yes Yes Yes
Currency Denomination Yes Yes Yes Yes Yes Yes
Loan Type Yes Yes Yes Yes Yes Yes
Credit Rating Yes Yes Yes Yes
Region Yes Yes Yes Yes Yes
Economic Activity Yes Yes Yes Yes Yes
Legal Structure Yes Yes Yes Yes Yes
Proportion of Loan Collateralized Yes Yes Yes Yes
Loan Maturity Yes Yes Yes Yes
Loan Amount Yes Yes Yes Yes
Floating Loan Rate Yes Yes Yes Yes
Value-weighted by Borrower/Inside Bank Yes Yes Yes
Number of Switching Loans 1,001 496 304 287 143 308
Number of Nonswitching Loans 21,291 2,215 967 907 403 308
Number of Observations (Matched Pairs) 69,235 2,923 1,178 1,100 495 308
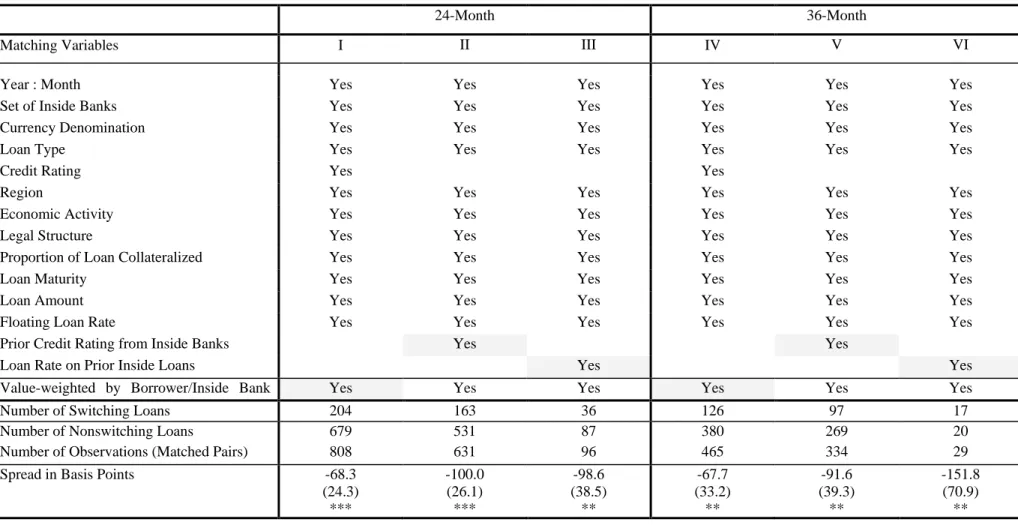
Table IA.IV
Spreads between Interest Rates on Switching Loans and Rates on Matched Loans Given by Inside Banks for 24-/ 36- Month Definition
We assess the spread between the interest rate on a switching loan and the interest rates on new loans obtained (by other firms) from the switchers’ set of inside banks. We match on the indicated variables. We regress the spreads on a constant and report the coefficient on the constant. We cluster at the switching firm level and report robust standard errors between parentheses. *, **, and *** indicate significance at the 10%, 5%, and 1% levels, two-tailed.24-Month 36-Month
Matching Variables I II III IV V VI
Year : Month Yes Yes Yes Yes Yes Yes
Set of Inside Banks Yes Yes Yes Yes Yes Yes
Currency Denomination Yes Yes Yes Yes Yes Yes
Loan Type Yes Yes Yes Yes Yes Yes
Credit Rating Yes Yes
Region Yes Yes Yes Yes Yes Yes
Economic Activity Yes Yes Yes Yes Yes Yes
Legal Structure Yes Yes Yes Yes Yes Yes
Proportion of Loan Collateralized Yes Yes Yes Yes Yes Yes
Loan Maturity Yes Yes Yes Yes Yes Yes
Loan Amount Yes Yes Yes Yes Yes Yes
Floating Loan Rate Yes Yes Yes Yes Yes Yes
Prior Credit Rating from Inside Banks Yes Yes
Loan Rate on Prior Inside Loans Yes Yes
Value-weighted by Borrower/Inside Bank Yes Yes Yes Yes Yes Yes
Number of Switching Loans 204 163 36 126 97 17
Number of Nonswitching Loans 679 531 87 380 269 20
Number of Observations (Matched Pairs) 808 631 96 465 334 29
Spread in Basis Points -68.3
(24.3) *** -100.0 (26.1) *** -98.6 (38.5) ** -67.7 (33.2) ** -91.6 (39.3) ** -151.8 (70.9) **
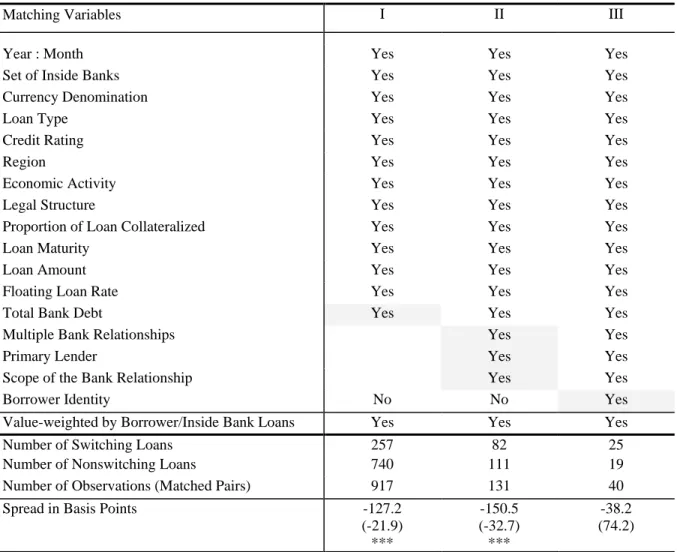
Table IA.V
Spreads between Interest Rates on Switching Loans and Rates on Matched Loans
Given by Inside Banks When Matching on Bank Debt, Relationship Characteristics,
and Borrower Identity
We assess the spread between the interest rate on a switching loan and the interest rates on new loans obtained (by other firms) from the switchers’ set of inside banks. We match on the indicated variables. We regress the spreads on a constant and report the coefficient on the constant. We cluster at the switching firm level and report robust standard errors between parentheses. *, **, and *** indicate significance at the 10%, 5%, and 1% levels, two-tailed.
Matching Variables I II III
Year : Month Yes Yes Yes
Set of Inside Banks Yes Yes Yes
Currency Denomination Yes Yes Yes
Loan Type Yes Yes Yes
Credit Rating Yes Yes Yes
Region Yes Yes Yes
Economic Activity Yes Yes Yes
Legal Structure Yes Yes Yes
Proportion of Loan Collateralized Yes Yes Yes
Loan Maturity Yes Yes Yes
Loan Amount Yes Yes Yes
Floating Loan Rate Yes Yes Yes
Total Bank Debt Yes Yes Yes
Multiple Bank Relationships Yes Yes
Primary Lender Yes Yes
Scope of the Bank Relationship Yes Yes
Borrower Identity No No Yes
Value-weighted by Borrower/Inside Bank Loans Yes Yes Yes
Number of Switching Loans 257 82 25
Number of Nonswitching Loans 740 111 19
Number of Observations (Matched Pairs) 917 131 40
Spread in Basis Points -127.2
(-21.9) *** -150.5 (-32.7) *** -38.2 (74.2)
Table IA.VI
Spreads between Interest Rates on Switching Loans and Rates on Matched Loans Given by Outside Banks Using Less Matching
Variables, No Value-Weighting, Subsamples, and One Observation per Switching Loan in Comparison to Column II in Table III
We assess the spread between the interest rate on a switching loan and the interest rates on new loans obtained (by other firms) from the individual outside bank. We match on the indicated variables. We regress the spreads on a constant and report the coefficient on the constant. We cluster at the switching firm level and report robust standard errors between parentheses. We also report the difference between the mean interest rate on the switching loans and the mean interest rate on the nonswitching loans in each column. We report standard errors between parentheses. *, **, and *** indicated significance at the 10%, 5%, and 1% levels, two-tailed.Matching Variables I II III IV V VI
Year : Month Yes Yes Yes Yes Yes Yes
Bank Yes Yes Yes Yes Yes Yes
Currency Denomination Yes Yes Yes Yes Yes Yes
Loan Type Yes Yes Yes Yes Yes Yes
Credit Rating Yes Yes Yes Yes
Region Yes Yes Yes Yes Yes
Economic Activity Yes Yes Yes Yes Yes
Legal Structure Yes Yes Yes Yes Yes
Proportion of Loan Collateralized Yes Yes Yes Yes
Loan Maturity Yes Yes Yes Yes
Loan Amount Yes Yes Yes Yes
Floating Loan Rate Yes Yes Yes Yes
Value-weighted by Borrower/Inside Bank Yes Yes Yes
Number of Switching Loans 1,032 493 276 166 170 276
Number of Nonswitching Loans 14,749 1,399 609 380 353 276
Number of Observations (Matched Pairs) 28,983 2,015 820 484 509 276
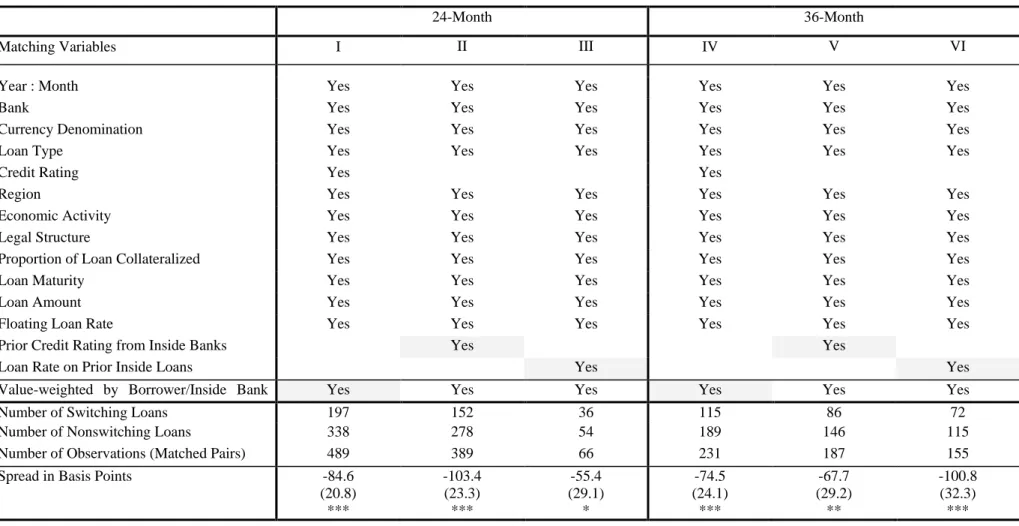
Table IA.VII
Spreads between Interest Rates on Switching Loans and Rates on Matched Loans by Outside Banks for 24-/36- Month Definition
We assess the spread between the interest rate on a switching loan and the interest rates on new loans obtained (by other firms) from the individual outside bank. We match on the indicated variables. We regress the spreads on a constant and report the coefficient on the constant. We cluster at the switching firm level and report robust standard errors between parentheses. *, **, and *** indicated significance at the 10%, 5%, and 1% levels, two-tailed.24-Month 36-Month
Matching Variables I II III IV V VI
Year : Month Yes Yes Yes Yes Yes Yes
Bank Yes Yes Yes Yes Yes Yes
Currency Denomination Yes Yes Yes Yes Yes Yes
Loan Type Yes Yes Yes Yes Yes Yes
Credit Rating Yes Yes
Region Yes Yes Yes Yes Yes Yes
Economic Activity Yes Yes Yes Yes Yes Yes
Legal Structure Yes Yes Yes Yes Yes Yes
Proportion of Loan Collateralized Yes Yes Yes Yes Yes Yes
Loan Maturity Yes Yes Yes Yes Yes Yes
Loan Amount Yes Yes Yes Yes Yes Yes
Floating Loan Rate Yes Yes Yes Yes Yes Yes
Prior Credit Rating from Inside Banks Yes Yes
Loan Rate on Prior Inside Loans Yes Yes
Value-weighted by Borrower/Inside Bank Yes Yes Yes Yes Yes Yes
Number of Switching Loans 197 152 36 115 86 72
Number of Nonswitching Loans 338 278 54 189 146 115
Number of Observations (Matched Pairs) 489 389 66 231 187 155
Spread in Basis Points -84.6
(20.8) *** -103.4 (23.3) *** -55.4 (29.1) * -74.5 (24.1) *** -67.7 (29.2) ** -100.8 (32.3) ***
Table IA.VIII
Spreads between Interest Rates on Switching Loans and Rates on Matched Loans Given
by Outside Banks When Matching on Bank Debt and Relationship Characteristics
We assess the spread between the interest rate on a switching loan and the interest rates on new loans obtained (by other firms) from the individual outside bank. We match on the indicated variables. We regress the spreads on a constant and report the coefficient on the constant. We cluster at the switching firm level and report robust standard errors between parentheses. *, **, and *** indicated significance at the 10%, 5%, and 1% levels, two-tailed.Matching Variables I II
Year : Month Yes Yes
Bank Yes Yes
Currency Denomination Yes Yes
Loan Type Yes Yes
Credit Rating Yes Yes
Region Yes Yes
Economic Activity Yes Yes
Legal Structure Yes Yes
Proportion of Loan Collateralized Yes Yes
Loan Maturity Yes Yes
Loan Amount Yes Yes
Floating Loan Rate Yes Yes
Total Bank Debt Yes Yes
Multiple Bank Relationships Yes
Primary Lender Yes
Scope of the Bank Relationship Yes
Value-weighted by Borrower/Inside Bank Loans Yes Yes
Number of Switching Loans 196 63
Number of Nonswitching Loans 358 79
Number of Observations (Matched Pairs) 491 93
Spread in Basis Points -139.5
(22.3) ***
-130.8 (-32.6) ***
T
ABLEIA.IX
Spreads between Interest Rates on Switching Loans and Rates on Matched Loans Given
by Inside Banks When Matching on Average and Best Most Recent Inside Ratings
We assess the spread between the interest rate on a switching loan and the interest rates on new loans obtained (by other firms) from the switchers’ set of inside banks. We match on the indicated variables. We regress the spreads on a constant and report the coefficient on the constant. We cluster at the switching firm level and report robust standard errors between parentheses. *, **, and *** indicate significance at the 10%, 5%, and 1% levels, two-tailed.Matching Variables I II III IV
Year : Month Yes Yes Yes Yes
Set of Inside Banks Yes Yes Yes Yes
Currency Denomination Yes Yes Yes Yes
Loan Type Yes Yes Yes Yes
Region Yes Yes Yes Yes
Economic Activity Yes Yes Yes Yes
Legal Structure Yes Yes Yes Yes
Proportion of Loan Collateralized Yes Yes Yes Yes
Loan Maturity Yes Yes Yes Yes
Loan Amount Yes Yes Yes Yes
Floating Loan Rate Yes Yes Yes Yes
Average Prior Credit Rating from Inside Banks Yes
Best Prior Credit Rating from Inside Banks Yes
Average Loan Rate on Prior Inside Loans Yes
Best Loan Rate on Prior Inside Loans Yes
Value-weighted by Borrower/Inside Bank Loans Yes Yes Yes Yes
Number of Switching Loans 279 295 113 88
Number of Nonswitching Loans 885 950 181 126
Number of Observations (Matched Pairs) 1,067 1,151 212 157
Spread in Basis Points -100.9
(20.2) *** -99.0 (19.4) *** -74.8 (21.5) *** -70.1 (29.2) **
Table IA.X
Spreads between Interest Rates on Switching Loans and Rates on Matched Loans Given
by Outside Banks When Matching on Average and Best Most Recent Inside Ratings
We assess the spread between the interest rate on a switching loan and the interest rates on new loans obtained (by other firms) from the individual outside bank. We match on the indicated variables. We regress the spreads on a constant and report the coefficient on the constant. We cluster at the switching firm level and report robust standard errors between parentheses. *, **, and *** indicated significance at the 10%, 5% and 1% levels, two-tailed.Matching Variables I II III IV
Year : Month Yes Yes Yes Yes
Bank Yes Yes Yes Yes
Currency Denomination Yes Yes Yes Yes
Loan Type Yes Yes Yes Yes
Region Yes Yes Yes Yes
Economic Activity Yes Yes Yes Yes
Legal Structure Yes Yes Yes Yes
Proportion of Loan Collateralized Yes Yes Yes Yes
Loan Maturity Yes Yes Yes Yes
Loan Amount Yes Yes Yes Yes
Floating Loan Rate Yes Yes Yes Yes
Average Prior Credit Rating from Inside Banks Yes
Best Prior Credit Rating from Inside Banks Yes
Average Loan Rate on Prior Inside Loans Yes
Best Loan Rate on Prior Inside Loans Yes
Value-weighted by Borrower/Inside Bank Loans Yes Yes Yes Yes
Number of Switching Loans 254 266 82 64
Number of Nonswitching Loans 536 788 131 103
Number of Observations (Matched Pairs) 728 788 159 125
Spread in Basis Points -92.8
(18.6) *** -88.5 (17.8) *** -82.2 (25.0) *** -41.1 (19.5) **
Loan Rate Stickiness, Sale Campaigns, and Failed Banks
A general downward drift in interest rates combined with loan rate stickiness could motivate
firms to switch, which could explain our results. Figure IA.2 displays the interest rates on the
three-month, U.S. dollar-denominated Bolivian Treasury Bills, and the average rate on the
switching and nonswitching loans denominated in U.S. dollars.
Figure IA.2. Interest rates.
The figure
displays the interest rates on the three-month, U.S.
dollar-denominated Bolivian Treasury Bills, and the average rate on the switching and
nonswitching loans denominated in U.S. dollars.
Figure IA.3 records the number of loan initiations for each month in our sample and the
corresponding number of switching loans.
Interest Rates (on US$ denominated loans and T-bills)
0 2 4 6 8 10 12 14 16 18 1999 2000 2001 2002 2003 In ter es t R at es
Figure IA.3. Number of loan initiations.
The figure records the number of loan initiations
for each month in our sample and the corresponding number of switching loans.
While interest rates drop significantly between 2000:12 and 2002:03, there is no increase in
the level or proportion of switching loans during that period. Nevertheless, we further
investigate the loan rate spreads using the line-up of matching exercises in Table III for the
three periods delineated by 2000:11 and 2002:04 (the vertical lines in Figure IA.2).
As can be observed in Table IA.XI, Columns I to III, we fail to find systematic differences
between the three periods. Given that the results are very similar, regardless of whether
interest rates are falling or are varying around a constant trend, price stickiness on
nonswitching loans does not appear to be a driving force behind a firm’s decision to switch.
Individual banks trying to gain market share may also drive our results. To evaluate this
possibility, we start by studying banks’ market shares over time. As we cannot identify any
bank that significantly gains market share or consistently offers abnormally low loan rates,
we study whether banks temporary run “sales campaigns” to spur switching (banks may aim
to price discriminate heterogeneous firms in this way). We define a sales campaign as a
0 10 20 30 40 50 60 0 100 200 300 400 500 600 700 800 900 1000 1999 2000 2001 2002 2003 Switch in g L o an I n ititatio n s T o tal L o an I n ititiatio n s
Number of Loan Initiations
month during which a bank attracts a number of switchers that exceeds two times the
standard deviation of the number of switchers it receives in all of the preceding months
during the sample period. We identify 37 campaign months.
3As can be observed in Column
IV, removing campaign months from the sample does not alter the results.
Finally, during the sample period there were three bank failures. There was one failure in
1999:03 (the starting point of our sample) and two in the second half of 1998. Some of the
assets of the failed banks were transferred to two other banks in the sample. However,
removing the involved banks from the sample (Column V) or the firms that had lending
relationships with the failed banks (Column VI) does not alter the results.
3
If we use the entire sample period to determine the standard deviation for each bank, we are still left with 32 campaign months. Note that both definitions of campaign months are specific to the bank (i.e., a given month is classified as a campaign month for one bank but not for another).
Table IA.XI
Spreads between Interest Rates on Switching Loans and Rates on Matched Loans Given by Inside Banks For Various Subsets
We assess the spread between the interest rate on a switching loan and the interest rates on new loans obtained (by other firms) from the switchers’ set of inside banks. We match on the indicated variables. We regress the spreads on a constant and report the coefficient on the constant. We cluster at the switching firm level and report robust standard errors between parentheses. *, **, and *** indicate significance at the 10%, 5%, and 1% levels, two-tailed.1999:02-2000:11 2000:11-2002:04 2002:04- 2003:12
Without Campaigns
Removing Banks Removing Firms
Matching Variables I II III IV V VI
Year : Month Yes Yes Yes Yes Yes Yes
Set of Inside Banks Yes Yes Yes Yes Yes Yes
Currency Denomination Yes Yes Yes Yes Yes Yes
Loan Type Yes Yes Yes Yes Yes Yes
Credit Rating Yes Yes Yes Yes Yes Yes
Region Yes Yes Yes Yes Yes Yes
Economic Activity Yes Yes Yes Yes Yes Yes
Legal Structure Yes Yes Yes Yes Yes Yes
Proportion of Loan Collateralized Yes Yes Yes Yes Yes Yes
Loan Maturity Yes Yes Yes Yes Yes Yes
Loan Amount Yes Yes Yes Yes Yes Yes
Floating Loan Rate Yes Yes Yes Yes Yes Yes
Value-weighted by Borrower/Inside Bank Yes Yes Yes Yes Yes Yes
Number of Switching Loans 140 85 79 240 257 259
Number of Nonswitching Loans 465 260 242 783 872 769
Number of Observations (Matched Pairs) 575 327 276 940 1,052 950
Spread in Basis Points -99.1
(24.2) *** -87.2 (37.2) ** -114.6 (37.8) *** -87.8 (21.9) *** -51.7 (20.1) *** -85.7 (21.0) ***
Table IA.XII
Spreads between Interest Rates on Switching Loans and Rates on Matched Loans Given by Outside Banks For Various Subsets
We assess the spread between the interest rate on a switching loan and the interest rates on new loans obtained (by other firms) from the individual outside bank. We match on the indicated variables. We regress the spreads on a constant and report the coefficient on the constant. We cluster at the switching firm level and report robust standard errors between parentheses. *, **, and *** indicate significance at the 10%, 5%, and 1% levels, two-tailed.1999:02-2000:11 2000:11-2002:04 2002:04- 2003:12
Without Campaigns
Removing Banks Removing Firms
Matching Variables I II III IV V VI
Year : Month Yes Yes Yes Yes Yes Yes
Bank Yes Yes Yes Yes Yes Yes
Currency Denomination Yes Yes Yes Yes Yes Yes
Loan Type Yes Yes Yes Yes Yes Yes
Credit Rating Yes Yes Yes Yes Yes Yes
Region Yes Yes Yes Yes Yes Yes
Economic Activity Yes Yes Yes Yes Yes Yes
Legal Structure Yes Yes Yes Yes Yes Yes
Proportion of Loan Collateralized Yes Yes Yes Yes Yes Yes
Loan Maturity Yes Yes Yes Yes Yes Yes
Loan Amount Yes Yes Yes Yes Yes Yes
Floating Loan Rate Yes Yes Yes Yes Yes Yes
Value-weighted by Borrower/Inside Bank Yes Yes Yes Yes Yes Yes
Number of Switching Loans 147 65 64 218 238 225
Number of Nonswitching Loans 378 107 124 511 546 501
Number of Observations (Matched Pairs) 543 139 138 622 729 668
Spread in Basis Points -68.3
(20.2) *** -123.2 (47.0) ** -92.9 (31.2) *** -89.7 (19.7) *** -65.4 (15.5) *** -92.9 (19.7) ***
IV. DYNAMIC RESULTS
Table IA.XIII
Spreads After Switching for Firms that Borrow Again Within 12 or 6 Months After the Switch
We calculate the spread between the interest rates on new loans obtained by the switcher from the outside bank and the interest rate on the switching loan for a subsample of switchers that borrow again within 12 (6) months. Apart from matching on bank and borrower identity we also match on the relevant variables from our benchmark Model IV in Table IV, that is, currency denomination, loan type, credit rating, region, economic activity, legal structure, collateralization, maturity, amount, and loan rate proviso. We group the corresponding matches in seven half-year periods (“1 to 6 ” to “At least 37” months) since the switching loan and regress the spreads adjusted by the interbank market rate on a constant, the seven half-year period dummies, and calendar-time dummies. We report the coefficients of the half-year period dummies. We cluster at the firm level and report robust standard errors between parentheses. *, **, and *** indicate significance at the 10%, 5%, and 1% levels, two-tailed.
P
ANELA:
O
NLYF
IRMST
HATB
ORROWA
GAINW
ITHIN12
M
ONTHSA
FTER THES
WITCHPeriods (in months)
Since the Switching Loan 1 to 6 7 to 12 13 to 18 19 to 24 25 to 30 31 to 36 At least 37
Number of Switching Loans 260 165 98 61 36 23 24
Number of Future Loans 455 324 205 148 79 52 73
Number of Observations 587 378 252 179 98 69 100
Spread in Basis Points -2.0
(0.0) -21.7 (12.5) * -38.2 (16.4) ** 43.5 (22.6) ** 43.9 (22.6) ** 33.6 (40.6) 172.8 (63.4) ***
P
ANELB:
O
NLYF
IRMST
HATB
ORROWA
GAINW
ITHIN6
M
ONTHSA
FTER THES
WITCHPeriods (in months)
Since the Switching Loan 1 to 6 7 to 12 13 to 18 19 to 24 25 to 30 31 to 36 At least 37
Number of Switching Loans 260 129 82 47 28 17 18
Number of Future Loans 455 278 176 122 69 42 44
Number of Observations 587 324 219 149 84 56 63
Spread in Basis Points -2.0
(0.0) -20.6 (13.7) -30.9 (16.9) * 44.4 (24.7) * 37.2 (23.1) * 22.6 (45.9) 162.5 (46.5) ***
V. ADVERSE SELECTION
Table IA.XIV
Ratings and Loan Rates by Inside and Outside Banks
We report Probit regressions for Ex Post Nonperformance, a dummy variable that equals one if a loan, originated at t, has overdue payments or defaults any time after origination, and equals zero otherwise. Observable
Relationship equals one if the firm had overdue payments with the originating bank between t-2 and t-4 (only the
originating bank can observe these overdue payments) and equals zero otherwise. Observable Registry equals one if the firm had overdue payments with any bank between t-2 and t-1 or a prior default (any bank can observe these repayment problems through the registry) and equals zero otherwise. Unobservable equals one if the firm had overdue payments with another bank between t-2 and t-4 (the originating bank cannot observe these overdue payments) and equals zero otherwise. The other variables are defined in Table II. We report the change in the probability of Ex Post Nonperformance for a change in each of the independent variables. For continuous (dummy) variables we report the effect of an infinitesimal change (a change from zero to one). P0 is the predicted
probability of Ex Post Nonperformance. We cluster at the firm level and report robust standard errors between parentheses. *, **, and *** indicated significance at the 10%, 5%, and 1% levels, two-tailed.
I
II
III
IV
Past Repayment Problems
Observable Relationship 0.114 *** 0.076 *** 0.076 *** 0.052 *** (0.012) (0.010) (0.010) (0.008) Observable Registry 0.048 *** 0.035 *** 0.034 *** 0.025 *** (0.007) (0.007) (0.006) (0.006) Unobservable 0.035 *** 0.028 *** 0.026 *** 0.021 *** (0.007) (0.006) (0.006) (0.005)
Observable Borrower Characteristics
Total Bank Debt in [-1,-2] -0.003 *** -0.003 *** -0.001 *** -0.001 *** (0.000) (0.000) (0.000) (0.000) Collateral in [-1,-2] 0.010 *** 0.006 ** 0.003 ** 0.001 (0.002) (0.002) (0.002) (0.002) Worst Rating in [-1,-2] = 2 0.002 *** 0.009 ** 0.01 *** 0.009 *** (0.006) (0.004) (0.005) (0.003) Worst Rating in [-1,-2] = 3 0.0227 *** 0.066 *** 0.158 *** 0.045 *** (0.031) (0.019) (0.026) (0.0016) Worst Rating in [-1,-2] = 4 0.061 *** 0.122 ** 0.242 *** 0.097 * (0.066) (0.060) (0.064) (0.056) Worst Rating in [-1,-2] = 5 0.788 *** 0.308 *** 0.589 *** 0.214 ** (0.063) (0.113) (0.093) (0.101) Legal Structure, Industry & Region
Dummies
Included Included Included Included
Loan Characteristics Rating = 2 0.044 *** 0.033 *** (0.006) (0.005) Rating = 3 0.12 *** 0.09 *** (0.017) (0.015) Rating = 4 0.061 *** 0.032 *** (0.031) (0.022) Loan Amount -0.01 ** -0.011 *** (0.004) (0.004) Collateral 0.031 *** 0.030 *** (0.004) (0.004) Loan Rate 0.011 *** 0.01 *** (0.001) (0.000) Loan Maturity 0.001 *** 0.001 *** (0.000) (0.000)
Bank and Time Fixed Effects Included Included Included Included P0 (at the mean of explanatory variables) 0.041 0.037 0.033 0.030
Pseudo R-square 0.20 0.18 0.25 0.22
28