UNDERGRADUATE LEARNING & TEACHING
Forward Thinking projectThis Report forms part of a series of summary reports on philosophy in Australian Universities produced as part of the Forward Thinking: Learning and Teaching Philosophy in Australian Universities Project. This series consists of reports on:
• The Significance of the Discipline of Philosophy; • Philosophy in Australian Universities;
• Undergraduate Learning and Teaching; • Honours Learning and Teaching;
• Postgraduate Learning and Teaching; and • Staff Learning and Teaching.
These reports are available on the Forward Thinking Project website: http://aap.org.au/forwardthinking/reports/index.html.
The Forward Thinking project commenced in July 2008 and was funded by the
Australian Learning and Teaching Council Ltd (ALTC) via a Discipline-Based Initiative Grant. The Australasian Association of Philosophy (AAP) also supported the project. Further information about the project, including the Project Final Report, can be found at: www.aap.org.au/forwardthinking.
About this Report
This Report is divided into 6 sections: Undergraduate Profile, including: student load and enrolments in philosophy; degree profile and completions; Student Profile, including: enrolment status, gender, age and domestic/overseas characteristics; Student
Experience, including evaluation of course and destinations; Program and Curriculum, including: curriculum structure, teaching hours, areas covered by a program, curriculum trends, curriculum mapping and graduate attributes; Teaching issues, including
developments and trends, online learning, assessment and evaluation and Distance learning.
Data in these reports is drawn from a number of sources, including: DEEWR, GCA and the AAP. Data was also drawn from a survey of Heads of Philosophy Programs. Those wishing to do further research may refer to the datasets. Access to some data is restricted to project participants and Heads of philosophy programs. Access may be obtained from the Executive Officer of the Australasian Association of Philosophy. Sections of these reports refer to Case Studies developed from issues raised in the surveys and later discussed at round tables on issues and innovations in teaching and learning philosophy. These cover: assessment, evaluation, graduate attributes and teaching philosophy to non-philosophy majors/BA students. Those wishing to pursue these issues further may refer to the case studies.
Project Team
Professor Susan Dodds (University of Tasmania); Professor Ros Diprose (University of New South Wales); Dr Jennifer Duke-Yonge (Macquarie University); Eliza Goddard (Australasian Association of Philosophy/Flinders University); Dr Simon Lumsden (University of New South Wales); Professor Catriona Mackenzie (Macquarie University); Professor Peter Menzies (Macquarie University); Dr Mitch Parsell (Macquarie University); Associate Professor Ian Ravenscroft (Flinders University)
Project contacts
Eliza Goddard, Project Manager, [email protected]
Support for this project has been provided by the Australian Learning and Teaching Council Ltd, an initiative of the Australian Government Department of Education, Employment and Workplace Relations. The views expressed in this report do not necessarily reflect the views of the Australian Learning and Teaching Council Ltd. This work is published under the terms of the Creative Commons
Attribution-Noncommercial-ShareAlike 2.5 Australia Licence. Under this Licence you are free to copy, distribute, display and perform the work and to make derivative works.
Attribution: You must attribute the work to the original authors and include the following statement: Support for the original work was provided by the Australian Learning and Teaching Council Ltd, an initiative of the Australian Government Department of Education, Employment and Workplace Relations.
Noncommercial: You may not use this work for commercial purposes.
Share Alike: If you alter, transform, or build on this work, you may distribute the resulting work only under a licence identical to this one.
For any reuse or distribution, you must make clear to others the licence terms of this work.
Any of these conditions can be waived if you get permission from the copyright holder. To view a copy of this licence, visit
http://creativecommons.org/licenses/by-nc-sa/2.5/au/ or send a letter to Creative Commons, 171 Second Street, Suite 3000, San Francisco, California, 94105, USA. Requests and inquiries concerning these rights should be addressed to the Australian Learning and Teaching Council, PO Box 2375, Strawberry Hills NSW 2012 or through the website: www.altc.edu.au
Table of Contents
UNDERGRADUATE PROFILE ...5
STUDENT LOAD AND ENROLMENTS IN PHILOSOPHY...5
Total Undergraduate load ... 5
Trends in Undergraduate load... 6
Philosophy load at Bachelor level by institution 2008 ... 6
Undergraduate enrolments by year level... 8
Number of units and year level ... 8
Enrolment trends by year level 2001 to 2008 ... 9
DEGREE PROFILE OF PHILOSOPHY STUDENTS...10
COMPLETIONS IN PHILOSOPHY...11
STUDENT PROFILE... 12
ENROLMENT STATUS...12
GENDER...13
Gender and trends...13
Enrolments in philosophy units in the Bachelor Course in 2008 by gender and year level13
Enrolments in philosophy units in the Bachelor Course in 2008 by gender, level of and number of units in a year...14
Gender and completions...15
AGE...16
CITIZENSHIP...17
Domestic/Overseas load ...17
Load by domestic/overseas students 2001-2008...17
Student load in 2008 by country of birth...18
STUDENT EXPERIENCE... 18
STUDENT SATISFACTION...19
CAREER CHOICES AFTER GRADUATION...20
Philosophy Graduates and Employability ...20
What sector do philosophy students end up in and who are they employed by?...21
PROGRAM & CURRICULUM ... 21
THE MAJOR IN PHILOSOPHY...21
CURRICULUM STRUCTURE...22
Numbers of units ...22
Core units...22
Service units to other disciplines...23
TEACHING MODES AND TEACHING HOURS PER UNIT...23
1st year...23
2nd year ...23
3rd year...24
AREAS COVERED BY PROGRAM...24
1st Year...24
2nd and 3rd Year ...24
CURRICULUM TRENDS...25
Graduate attributes & Curriculum mapping ...26
CHANGES TO THE BA DEGREE AND/OR PROGRAM...26
TEACHING ISSUES... 26
DEVELOPMENTS AND TRENDS IN TEACHING...26
ON-‐LINE LEARNING...27
ASSESSMENT...28
Assessment modes...28
Developments and Trends...29
Assessment and plagiarism ...30
EVALUATION OF TEACHING...30
CHANGES IN CLASS SIZES...31
TEACHING TO PRIMARY AND SECONDARY SCHOOLS...31
DISTANCE LEARNING ... 31
TRADITIONAL EXTERNAL...32
PROGRAMS AND UNITS OFFERINGS...32
STUDENT COHORTS...33
FAILURE, ATTRITION AND PLAGIARISM RATES...33
TRAINING AND WORKLOAD...33
STUDENT LOAD...34
OPEN UNIVERSITIES AUSTRALIA...35
Macquarie University ...35
Griffith University...35
REFERENCES ... 36
APPENDIX 1: LIST OF INSTITUTIONS THAT REPORT PHILOSOPHY UNITS TO DEEWR ... 37
APPENDIX 2: LIST OF PHILOSOPHY PROGRAMS THAT PARTICIPATED IN THE SURVEY ... 38
APPENDIX 3: LIST OF PHILOSOPHY PROGRAMS INCLUDED IN HANDBOOK SEARCH.. 39
APPENDIX 4: DISTANCE SURVEY... 40
TRADITIONAL EXTERNAL...40
Offerings...40
Cohort...40
Staffing ...40
Honours, graduate and postgraduate study...40
Undergraduate Profile
Student load and enrolments in philosophy
This section on student load and enrolments uses data from the DEEWR higher education statistics student collection; the data was prepared by DEEWR for the AAP. DEEWR reports data from all Higher Education Providers that code units to Higher Education Discipline Groups philosophy (091701). Units of study are coded to the classification without regard to the type of Academic Organisational Unit (AOU)
responsible for the unit of study being coded1, and as such, do not reflect the load of a
philosophy department or school. (For further information see the section on limitations on the data in the Final Project Report). For a list of institutions that report load in philosophy units see Appendix 1.
In summary, this section shows that there has been growth of about 10 per cent in philosophy enrolments in the period since 2000, but relatively little growth in the number of students completing a philosophy major. The majority of students who enrol in a philosophy unit at Undergraduate level only take one or two philosophy units as an undergraduate. Most of these students are enrolled in BA areas of studies (Society and Culture or Creative Arts), but a large proportion come from Management and
Commerce, Natural and Physical Sciences, and Education and Health. Therefore, one important role of philosophy teaching is to ensure that students who enrol in introductory philosophy gain the benefits of philosophical study from that brief encounter. Those students who take a unit at second or third year in philosophy appear to take philosophy to complement another major sequence of study (history, sociology, politics, law, etc). Again, this suggests that there could be benefit in designing philosophy curricula in light of the curricula of related disciplines to make the links between the areas more visible and attractive.
Total Undergraduate load
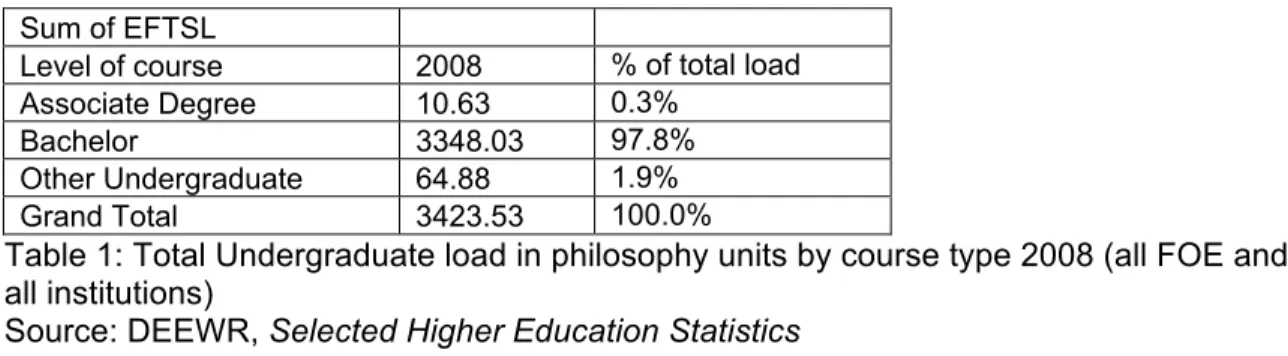
The following table shows total Undergraduate load in philosophy units by course type in 2008 for all Fields Of Education (FOE) and all institutions.
1DEEWR gives the following example: ‘For example, in the one institution, a "mathematics for
engineers" unit might be taught by an Engineering AOU and a "pure mathematics" unit by a Science AOU. Both units could be coded to the detailed fields of education 010101
(Mathematics). Were the "mathematics for engineers" unit to be taught by the Science AOU, or the "pure mathematics" unit by the Engineering AOU, both units would still be coded to the detailed fields of education 010101.’ See, ‘Student help file’,
http://www.deewr.gov.au/HigherEducation/Publications/HEStatistics/Pages/HEStatisticsCollection .aspx, accessed 15th January 2010.
Sum of EFTSL
Level of course 2008 % of total load Associate Degree 10.63 0.3%
Bachelor 3348.03 97.8%
Other Undergraduate 64.88 1.9% Grand Total 3423.53 100.0%
Table 1: Total Undergraduate load in philosophy units by course type 2008 (all FOE and all institutions)
Source: DEEWR, Selected Higher Education Statistics Summary
Undergraduate enrolments in philosophy units are recorded at Associate Degree, Bachelor and Other Undergraduate award courses. The majority of undergraduate load in philosophy – 98 per cent, is at Bachelor Course level. The following tables provide a more detailed breakdown of load and enrolments in philosophy units at Bachelor course level.
Trends in Undergraduate load
The following table shows total load in philosophy units at Bachelor course level for 2001-8.
Table 2: Total Undergraduate load in philosophy units by course type 2001-8 (all FOE and all institutions).
Source: DEEWR, Selected Higher Education Statistics Summary
Enrolments in philosophy units at Bachelor course level have varied within ~300 EFTSL between the years 2001-2008 (by roughly 10 per cent). EFTSL in 2001 was 3045 EFTSL; there has been a 10 per cent increase in overall load, at 3348 EFTSL in 2008.2
Philosophy load at Bachelor level by institution 2008
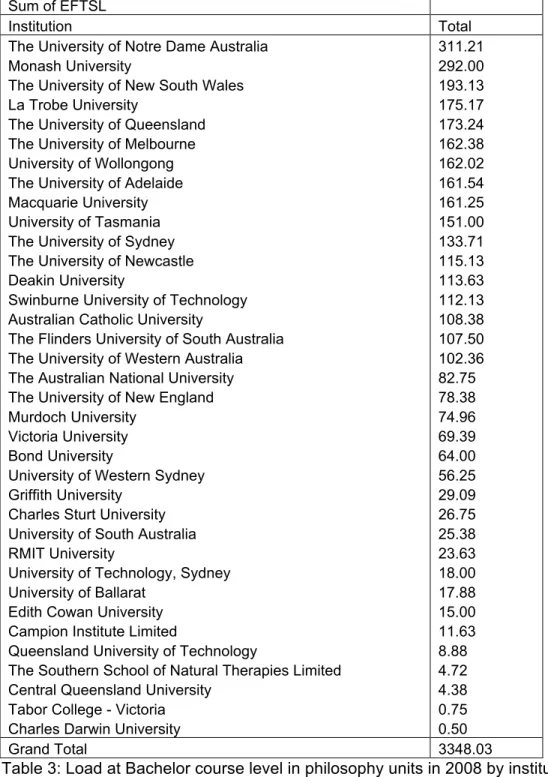
The following table shows philosophy load at Bachelor course level in 2008 by recording institution in descending order.
2 The ALTC/DASSH Scoping the BA project notes ‘there has been a steady increase in the
number of students across the broader Arts programs, there has been a steady decline in the number of students engaged in Bachelor of Arts programs’ (Gannaway and Trent 2008, p. 24).
Sum total of EFTSL Year Level of course 2001 2002 2003 2004 2005 2006 2007 2008 Bachelor 3045 3373 3068 3319 3238 3338 3247 3348
Sum of EFTSL
Institution Total
The University of Notre Dame Australia 311.21
Monash University 292.00
The University of New South Wales 193.13
La Trobe University 175.17
The University of Queensland 173.24
The University of Melbourne 162.38
University of Wollongong 162.02
The University of Adelaide 161.54
Macquarie University 161.25
University of Tasmania 151.00
The University of Sydney 133.71
The University of Newcastle 115.13
Deakin University 113.63
Swinburne University of Technology 112.13 Australian Catholic University 108.38 The Flinders University of South Australia 107.50 The University of Western Australia 102.36 The Australian National University 82.75
The University of New England 78.38
Murdoch University 74.96
Victoria University 69.39
Bond University 64.00
University of Western Sydney 56.25
Griffith University 29.09
Charles Sturt University 26.75
University of South Australia 25.38
RMIT University 23.63
University of Technology, Sydney 18.00
University of Ballarat 17.88
Edith Cowan University 15.00
Campion Institute Limited 11.63
Queensland University of Technology 8.88 The Southern School of Natural Therapies Limited 4.72
Central Queensland University 4.38
Tabor College - Victoria 0.75
Charles Darwin University 0.50
Grand Total 3348.03
Table 3: Load at Bachelor course level in philosophy units in 2008 by institution (all FOE) Source: DEEWR, Selected Higher Education Statistics
Summary
The table shows a large variation in the size of philosophy load by institution. The mean load is 93.00 EFTSL; the median load is 78.07 EFTSL. Data reported by DEEWR3
3 Units of study are coded to the classification without regard to the type of Academic
Organisational Unit (AOU) responsible for the unit of study being coded and as such, do not reflect the load of a philosophy department or school.
shows the University of Notre Dame has the highest load of all institutions at Bachelor level – at 311.21 EFTSL, and Charles Darwin University, the lowest – at 0.5 EFTSL.
Undergraduate enrolments by year level
The following tables show Undergraduate enrolments in philosophy units in 2008 by level of year for all Fields of Education and all institutions and the percentage of enrolments by year level in enrolments in units at the Bachelor Course level in 2008.
Sum of Number of students Level of course
Level of year Associate Degree Bachelor Other Undergraduate Grand Total
1st year 51 8615 275 8941
2nd year 9 4775 160 4944
3rd year 3 3149 23 3175
4+ year 3015 9 3024
Grand Total 63 19554 467 20084
Table 4: Enrolments in philosophy units 2008 by year level (all FOE and all institutions) Source: DEEWR, Selected Higher Education Statistics
Table 5: Percentage of enrolments by year level in enrolments in units at the Bachelor Course level in 2008
Source: DEEWR, Selected Higher Education Statistics Summary
Table 4 shows that enrolments decrease by year level for all courses at undergraduate level. At Bachelor course level, 44 per cent of total philosophy enrolments are in 1st year, 24 per cent in 2nd year, 16 per cent in 3rd year and 15 per cent in 4+years.4
Number of units and year level
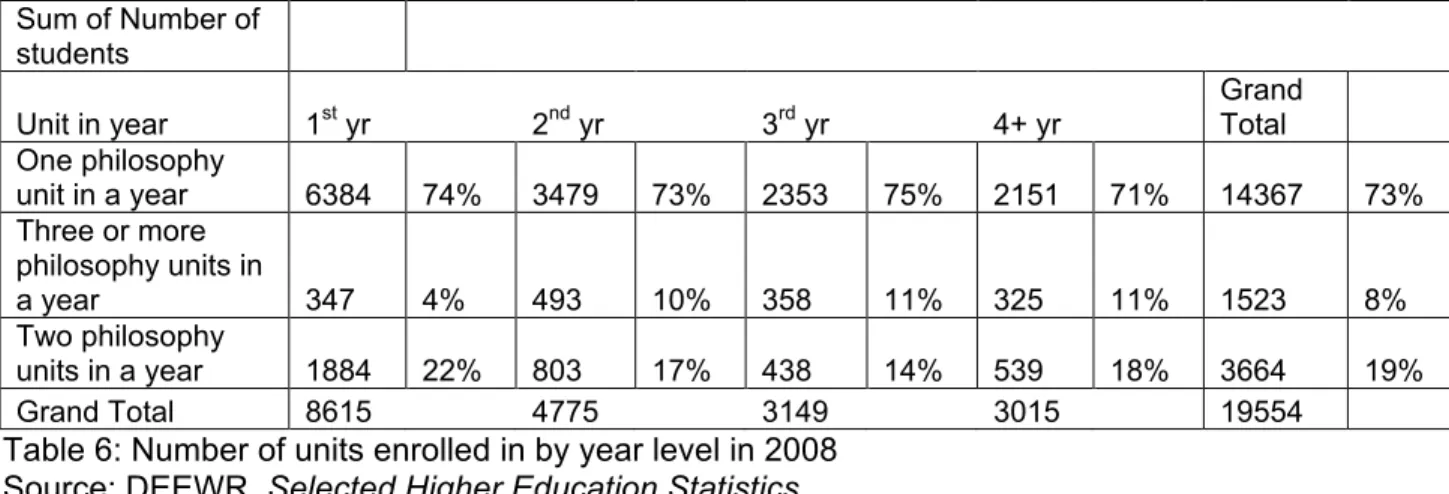
The following table shows the number of units enrolled in by year level in 2008.
4 Note, the year level indicates the year in the students’ enrolment history in which they enrolled
in that unit. For example, if I take a 1st year unit in my second year of enrolment, that unit will show up as a 2nd year unit. For this reason also, 4+ years is not an indication of honours years enrolments.
Sum of Number of students Level of year Total
1st year 8615 44%
2nd year 4775 24%
3rd year 3149 16%
4+ year 3015 15%
Sum of Number of students Unit in year 1st yr 2nd yr 3rd yr 4+ yr Grand Total One philosophy unit in a year 6384 74% 3479 73% 2353 75% 2151 71% 14367 73% Three or more philosophy units in a year 347 4% 493 10% 358 11% 325 11% 1523 8% Two philosophy units in a year 1884 22% 803 17% 438 14% 539 18% 3664 19% Grand Total 8615 4775 3149 3015 19554 Table 6: Number of units enrolled in by year level in 2008
Source: DEEWR, Selected Higher Education Statistics Summary
Study of one philosophy unit a year makes up 73 per cent of enrolments in 2008; study of two units makes up 19 per cent and 3 or more units in a year – 8 per cent.
Study of one philosophy unit makes up 74 per cent of enrolments in 1st year, study of 2
units, 22 per cent and study of three or more units, 4 per cent.
Study of one philosophy unit makes up 73 per cent of enrolments in 2nd year, study of 2
units, 17 per cent and study of three or more units, 10 per cent.
Study of one philosophy unit makes up 75 per cent of enrolments in 2nd year, study of 2
units, 14 per cent and study of three or more units, 11 per cent.
Study of one philosophy unit makes up 71 per cent of enrolments in 2nd year, study of 2
units, 18 per cent and study of three or more units, 11 per cent.
The majority of students who enrol in a philosophy unit at Undergraduate level only take one or two philosophy units as an undergraduate.
Enrolment trends by year level 2001 to 2008
The following table shows Philosophy Enrolments at Bachelor course level by level of year 2001-8. Year Level of year 2001 2002 2003 2004 2005 2006 2007 2008 1st year 7832 9085 7996 8744 8697 9313 8807 8615 2nd year 4276 4523 3651 3900 3935 3974 4166 4775 3rd year 2517 2698 2396 2743 2798 2748 2855 3149 4+ year 2798 2867 2676 3008 3038 2951 2960 3015 Grand Total 17423 19173 16719 18395 18468 18986 18788 19554 Table 7: Bachelor enrolments in philosophy units by year level all FOE and all
institutions 2001-2008
Summary
Total enrolments from 2001 to 2008 have increased, with increases at all year levels from 2001 to 2008. The largest increase has been at 1st year level – 10 per cent.
Degree profile of philosophy students
The following table gives a breakdown of bachelor level course load and percentage of total load by Field of Education code in 2008.
Sum of EFTSL
Broad field of education Total
Society and Culture 2149 64%
Management and Commerce 262 8%
Creative Arts 249 7%
Natural and Physical Sciences 243 7%
Education 165 5%
Health 155 5%
Engineering and Related Technologies 60 2%
Information Technology 47 1%
Agriculture, Environmental and Related Studies 12 0%
Architecture and Building 6 0%
Grand Total 3348 100%
Table 8: in Philosophy load Bachelor level course and percentage of total load by Field of Education code in 2008
Source: DEEWR, Selected Higher Education Statistics Summary
Student load in philosophy comes from several fields of education. The majority of load comes from Society and Culture. Most students who enrol in a philosophy unit at
Undergraduate level are enrolled in BA areas of studies (Society and Culture or Creative Arts) – 71 per cent, but a significant proportion come from Management and Commerce – 8 per cent, Natural and Physical Sciences – 7 per cent, and Education and Health – 5 per cent respectively.
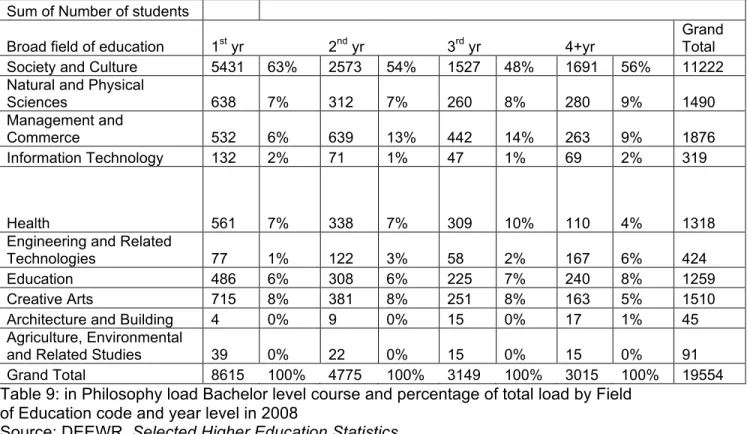
The following table gives a further breakdown of philosophy load in Bachelor level course in 2008 by field of education by year level.
Sum of Number of students Broad field of education 1st yr 2nd yr 3rd yr 4+yr
Grand Total Society and Culture 5431 63% 2573 54% 1527 48% 1691 56% 11222 Natural and Physical
Sciences 638 7% 312 7% 260 8% 280 9% 1490
Management and
Commerce 532 6% 639 13% 442 14% 263 9% 1876
Information Technology 132 2% 71 1% 47 1% 69 2% 319
Health 561 7% 338 7% 309 10% 110 4% 1318
Engineering and Related
Technologies 77 1% 122 3% 58 2% 167 6% 424
Education 486 6% 308 6% 225 7% 240 8% 1259
Creative Arts 715 8% 381 8% 251 8% 163 5% 1510
Architecture and Building 4 0% 9 0% 15 0% 17 1% 45 Agriculture, Environmental
and Related Studies 39 0% 22 0% 15 0% 15 0% 91 Grand Total 8615 100% 4775 100% 3149 100% 3015 100% 19554 Table 9: in Philosophy load Bachelor level course and percentage of total load by Field
of Education code and year level in 2008
Source: DEEWR, Selected Higher Education Statistics
Completions in philosophy
The following table shows Bachelor Award Course Completions in philosophy at Bachelor level in 2001-2008.
Sum of Number of student Year Level of course 2001 2002 2003 2004 2005 2006 2007 2008 Bachelor 442 438 460 498 442 434 414 509 Table 10: Completions in philosophy at Bachelor level in 2001-2008
Source: DEEWR, Selected Higher Education Statistics Summary
The data from DEEWR in the table above shows the number of Bachelor Award Course completions in philosophy. Whilst there has been growth of about 10 per cent in
philosophy load in the period since 2000 (see Table 2), it is difficult to ascertain whether there has been any growth in the number of students completing a philosophy major.
Student Profile
This Student Profile section of the report uses data from the DEEWR higher education statistics student collection; the data was prepared by DEEWR for the AAP. DEEWR reports data from all Higher Education Providers that code units to Higher Education Discipline Groups philosophy (091701). For a list of institutions that report load in philosophy units see Appendix 1. Units of study are coded to the classification without regard to the type of Academic Organisational Unit (AOU) responsible for the unit of study being coded, and as such, do not reflect the load of a philosophy department or school. (For further information see the section on limitations on the data in the Final Project Report). For a list of institutions that report load in philosophy units see Appendix 1.
In summary, this section shows that among students who have enrolled in a pattern of study that indicates a philosophy major5 in the period since 2000, a larger proportion of
these are enrolled full time than in the broader Australian undergraduate student body, and while female enrolments in philosophy units significantly outnumber male
enrolments, a student who has completed a pattern of study indicating a philosophy major is more likely to be male than female, more likely to be under 29, and more likely to have been born in Australia than the average undergraduate in Australia. There is a small, but significant percentage drawn from Asia, including China, Hong Kong,
Singapore and India. Most undergraduate philosophy is taught on an internal basis. Almost half (42 per cent) of external students are enrolled on a part time basis.
Enrolment status
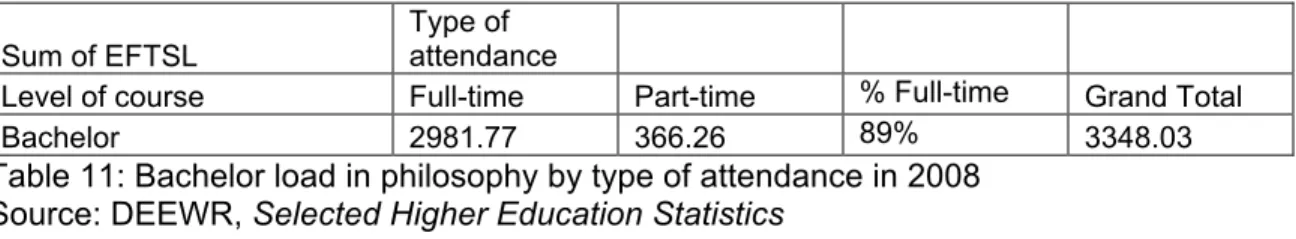
The following table provides a breakdown of bachelor load in philosophy by type of attendance in 2008.
Sum of EFTSL Type of attendance
Level of course Full-time Part-time % Full-time Grand Total
Bachelor 2981.77 366.26 89% 3348.03
Table 11: Bachelor load in philosophy by type of attendance in 2008 Source: DEEWR, Selected Higher Education Statistics
Summary
The great majority of Bachelor students are enrolled full time – 89 per cent.
5 DEEWR data reports how many units a student is enrolled in, but it does not tell us if they are
Gender
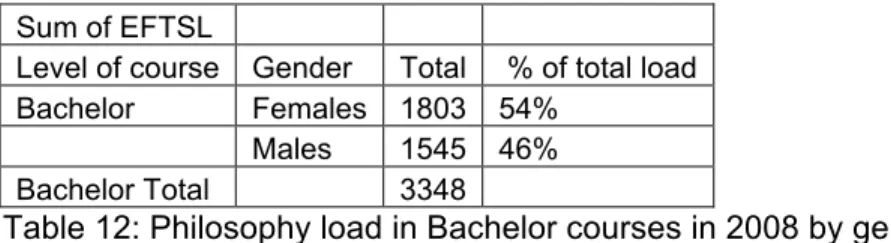
The following table provides a breakdown of philosophy load in Bachelor courses in 2008 by gender.
Sum of EFTSL
Level of course Gender Total % of total load Bachelor Females 1803 54%
Males 1545 46%
Bachelor Total 3348
Table 12: Philosophy load in Bachelor courses in 2008 by gender Source: Source: DEEWR, Selected Higher Education Statistics Summary
In 2008 female students made up 54 per cent of philosophy load at Bachelor course level.
Gender and trends
The following table gives a breakdown of philosophy load in Bachelor courses 2001-8 by Gender. Sum EFTSL % % % % % % % % 2001 2002 2003 2004 2005 2006 2007 2008 F 1722 57 1879 56 1700 55 1808 54 1763 54 1822 55 1789 55 1803 54 M 1323 43 1494 44 1368 45 1511 46 1475 46 1516 45 1458 45 1545 46 Total 3045 3373 3068 3319 3238 3338 3247 3348 Table 13: philosophy load in Bachelor courses 2001-8 by Gender
Source: DEEWR, Selected Higher Education Statistics Summary
For the years 2001-2008 total female load in philosophy at Bachelor level has varied within 3 per cent (between 54 in 2004 and 57 per cent in 2001).
Enrolments in philosophy units in the Bachelor Course in 2008 by gender and
year level
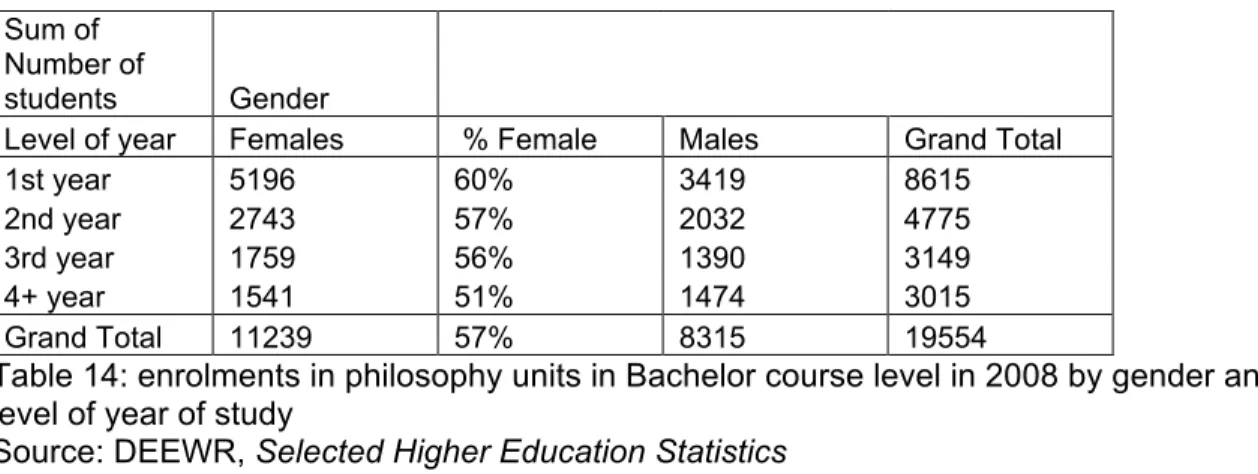
The following table gives a breakdown of enrolments in philosophy units in Bachelor course level in 2008 by gender and level of year of study.
Sum of Number of
students Gender
Level of year Females % Female Males Grand Total
1st year 5196 60% 3419 8615
2nd year 2743 57% 2032 4775
3rd year 1759 56% 1390 3149
4+ year 1541 51% 1474 3015
Grand Total 11239 57% 8315 19554
Table 14: enrolments in philosophy units in Bachelor course level in 2008 by gender and level of year of study
Source: DEEWR, Selected Higher Education Statistics Summary
Overall the percentage female enrolment declines by year of study. Female students make up 60 per cent of enrolments at 1st year; 57 per cent in second, 56 per cent in third
year and 51 per cent of four years plus study.
Enrolments in philosophy units in the Bachelor Course in 2008 by gender, level
of and number of units in a year
The following table gives a further breakdown of Enrolments in philosophy units in the Bachelor Course in 2008 by gender, level of and number of units in a year.
Unit in year Gender 1st year 2nd year 3rd year 4+ year Grand Total One
philosophy
unit in a year Females 3973 62% 2091 60% 1374 58% 1136 53% 8574 60% Males 2411 38% 1388 40% 979 42% 1015 47% 5793 40% One philosophy unit in a
year Total 6384 3479 2353 2151 14367 Three or more
philosophy
units in a year Females 153 44% 243 49% 181 51% 139 43% 716 47% Males 194 56% 250 51% 177 49% 186 57% 807 53% Three or more philosophy
units in a year Total 347 493 358 325 1523 Two
philosophy
units in a year Females 1070 57% 409 51% 204 47% 266 49% 1949 53% Males 814 43% 394 49% 234 53% 273 51% 1715 47% Two philosophy units in a
year Total 1884 803 438 539 3664
Grand Total 8615 4775 3149 3015 19554 Table 15: Enrolments in philosophy units in the Bachelor Course in 2008 by gender,
level of and number of units in a year
Summary
A breakdown of enrolments in philosophy units at the Bachelor Course level in 2008 shows that female enrolments decline by the number of units studied in and a year and by the level of year. Female enrolments in one unit of philosophy in first year make up for 62 per cent of enrolments; in contrast, female enrolments in three or more units in 4+ years make up 43 per cent of enrolments. (Recall, study of one philosophy unit in a year makes up for 73 per cent of enrolments; two units 19 per cent and three or more units 8 per cent.)
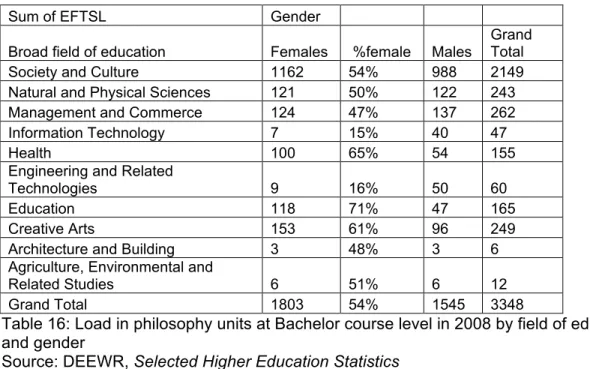
Bachelor 2008 BFOE and gender
The following table gives a breakdown of load in philosophy units at Bachelor course level in 2008 by field of education and gender.
Sum of EFTSL Gender
Broad field of education Females %female Males Grand Total Society and Culture 1162 54% 988 2149 Natural and Physical Sciences 121 50% 122 243 Management and Commerce 124 47% 137 262
Information Technology 7 15% 40 47
Health 100 65% 54 155
Engineering and Related
Technologies 9 16% 50 60
Education 118 71% 47 165
Creative Arts 153 61% 96 249
Architecture and Building 3 48% 3 6 Agriculture, Environmental and
Related Studies 6 51% 6 12
Grand Total 1803 54% 1545 3348
Table 16: Load in philosophy units at Bachelor course level in 2008 by field of education and gender
Source: DEEWR, Selected Higher Education Statistics Summary
The table shows that whilst female students make up 54 per cent of load at Bachelor level, and that 54 per cent of the students enrolled in Society and Culture are female, that the percentage female varies for load from other Broad Fields of Education. For example, 71 per cent of load from Education are female and 65 per cent from Health are female; whilst only 47 per cent of load from Management and Commerce are female and only 16 per cent from Engineering and Related Technologies are female.
Gender and completions
The following table provides a breakdown of completions in philosophy at Bachelor course level by gender 2001-2008
2001 % 2002 % 2003 % 2004 % 2005 % 2006 % 2007 % 2008 % Female 230 52 201 46 185 40 218 44 181 41 174 40 203 48 218 43 Table 17: Completions at Bachelor course level in 2008 by field of education, year level
and gender
Source: DEEWR, Selected Higher Education Statistics Summary
From the table above we see that female completions at Bachelor level in 2008 account for 43 per cent of completions. The female percentage completion varies by 12
percentage points, with 40 per cent in 2006 and 52 per cent in 2001. Note whilst female students account for more than 50 per cent of load/enrolments, completions by female students are less than 50 per cent. This may because female students do not major in philosophy in the same numbers as male students (either because they never intended to major or because they decide not to major or both) or that they do not complete or finish the major in the same proportions as male students.
Age
The following table provides a breakdown of student load in philosophy units at Undergraduate Course level in 2008 by age group.
Sum of EFTSL
Age group Bachelor % of total load
17 297 9% 18 624 19% 19 578 17% 20 450 14% 21 336 10% 22 232 7% 23 148 4% 24 109 3% 25 74 2% 26 64 2% 27 40 1% 28 33 1% 29 25 1% 16 and under 6 0% 30 to 39 177 5% 40 to 49 95 3% 50 to 59 41 1% 60 and over 17 1% Grand Total 3348 100%
Table 18: student load in philosophy units at Undergraduate Course level in 2008 by age group.
Summary
In 2008 69 per cent of students were aged between 17-21; 90 per cent were aged 29 or under.
Citizenship
Domestic/Overseas load
The following table provides a breakdown of philosophy load in 2008 by citizenship. Sum of EFTSL
Citizenship Bachelor % of total load Domestic Students 3105 93%
Overseas Students 243 7% Grand Total 3348 100%
Table 19: Philosophy load in 2008 by undergraduate course level and citizenship Source: DEEWR, Selected Higher Education Statistics
Summary
93 per cent of philosophy student load at undergraduate level in 2008 is made up of domestic students.
Load by domestic/overseas students 2001-2008
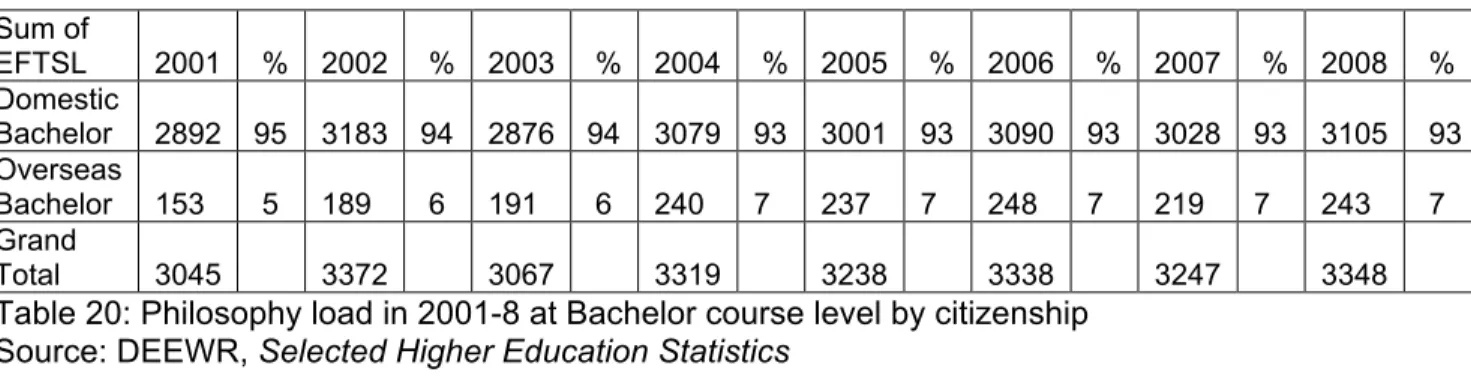
The following table provides a breakdown of philosophy load at Bachelor level in 2001-2008 by citizenship. Sum of EFTSL 2001 % 2002 % 2003 % 2004 % 2005 % 2006 % 2007 % 2008 % Domestic Bachelor 2892 95 3183 94 2876 94 3079 93 3001 93 3090 93 3028 93 3105 93 Overseas Bachelor 153 5 189 6 191 6 240 7 237 7 248 7 219 7 243 7 Grand Total 3045 3372 3067 3319 3238 3338 3247 3348 Table 20: Philosophy load in 2001-8 at Bachelor course level by citizenship
Source: DEEWR, Selected Higher Education Statistics Summary
There has been an increase in overseas load from 2001-2008, from 5 per cent of total Bachelor load in 2001, to 7 per cent in 2008.
Student load in 2008 by country of birth
The following table provides a breakdown of philosophy load at undergraduate course level in 2008 by country of birth.
Sum of EFTSL
Country of birth Bachelor Grand Total (all UG courses) load % of total
Australia 2613.38 2633.76 76.9%
China (excludes SARs and Taiwan
Province) 54.67 65.92 1.9%
England 57.73 57.86 1.7%
Hong Kong (SAR of China) 36.92 42.17 1.2%
New Zealand 34.71 35.21 1.0%
Singapore 33.65 33.90 1.0%
United States of America 26.29 33.29 1.0%
South Africa 32.10 32.35 0.9%
India 25.40 27.90 0.8%
United Kingdom, nfd 25.80 25.80 0.8%
Table 21: Philosophy load at undergraduate course level in 2008 by country of birth Source: DEEWR, Selected Higher Education Statistics
Summary
In 2008 77 per cent of student load in philosophy at undergraduate load is made up of students whose country of birth is Australia. The rest of the student load is made up of enrolments (from 2 per cent and under) from many countries. The most notable are China; England; Hong Kong; New Zealand; Singapore; USA; South Africa; India and the UK.
Student Experience
Information in this section is drawn from data prepared by Graduates Careers Australia.6
Data from Australian Graduate Survey (AGS) is conducted around four months after the completion of the qualification.7
In addition, survey respondents were asked to nominate a staff member who uses innovative evaluation procedures or has exceptional teaching evaluations for further
6 The data was prepared for the DASSH project ‘Scoping the BA’ (Gannaway and Trent 2009)
from the Course Experience Questionnaire (CEQ) for Arts students and was presented as pivot tables at http://www.dassh.edu.au/basp/data_excel. The project team thanks the Scoping the Project BA project Leader for access to this data.
7 The ACER Graduates pathway 2008 publication tracks outcomes 5 years out, but reports
outcomes only to the broad field of education "Society and Culture" (Coates and Edwards 2009). Australian Council for Educational Research (2008), ACER graduate pathways survey,
http://www.deewr.gov.au/HigherEducation/Publications/Pages/The2008GraduatePathwaysSurve y.aspx.
contact. On the basis of these nominations, round table discussions on issues arising in undergraduate learning and teaching were conducted. Case studies arising out of the discussions can be found here.
In summary, this section shows that students who have studied philosophy are happy with their study. They rank the quality of their course in the top 15 per cent of disciplines and academic groupings for Arts students 2001—2006. Their student satisfaction with their generic skill development is ranked above the average for Arts students, with notably higher than average responses to the statements “The course sharpened my analytic skills” and “The course developed my problem-solving skills”. The section also shows that the main sectors of employment for philosophy graduates are the private sector, education, government, self-employment and the non-profit sector. The main employers of philosophy graduates are Education; Finance, Health and Community Services; Wholesale and Retail Trade; Government Administration and Defence; and Accommodation, Cafes and Restaurants. However, whilst philosophy graduates are reported in higher demand, most philosophy programs do not track the career destinations of their graduates.
In addition, in response to the question: Is there an active philosophy society at your University?; just over half the programs (13 of 24) responded, Yes. A couple noted that whilst philosophy societies had been in active in the past, they were no longer.
Student satisfaction
The Course Experience Questionnaire (GCA) measures Arts Students' overall
satisfaction with their program of study and Students' satisfaction with their generic skill development as provided by their program of study. In response to the statement: Overall, I was satisfied with the quality of this course, where 1 = Strongly disagree and 5 = Strongly agree, philosophy students rate their discipline at 6th place of a total of 41
disciplines and academic groupings - i.e. in the top 15 percent at 4.2. Notably,
philosophy and religious studies students [as a combined reported grouping] rank their overall satisfaction the highest of all disciplines and groupings in which Arts Students are enrolled 2001-6 at 4.52 [1 of 41].), followed by Australian Indigenous languages, Gender Specific Studies, History, Religion and then Philosophy.
In response to a set of statements developed to measure Arts students' satisfaction with their generic skill development as provided by their discipline or grouping of study, philosophy and philosophy and religion students rate their experience above the average for Arts students, with notably higher than the average responses to the statements: “The course sharpened my analytic skills” and “The course developed my problem-solving skills”. To the statement: "The course sharpened my analytic skills", the overall average was: 4.07, the philosophy average: 4.43. To the statement: "The course developed my problem-solving skills", the overall average was: 3.57, the philosophy average: 3.89. Philosophy students also had higher than average responses to the statements: "As a result of my course, I feel confident about tackling unfamiliar
problems"; "The course improved my skills in written communication"; and "My course helped me to develop the ability to plan my own work. To the statement: “The course helped me develop my ability to work as a team member”, philosophy students rate their satisfaction below the average.
Career choices after graduation
Philosophy Graduates and Employability
In recent years, labour market shifts have revealed an unexpected new interest by employers in the skills of philosophy students. In the UK there are reports that philosophy graduates are able to earn higher salaries because of the perception that their skills in reasoning and the analysis of complex problems, and their ability to adapt reasoning to new information, make them better able to adapt to changing economic, regulatory and fiscal conditions (Shepherd 2007). There are similar reports from Canada (Drolet 2008), the USA and Australia (Gilling 2008). This is independent of emerging evidence that 10 years after graduation, Australian graduates who have completed a BA degree are able, on average, to earn more than the average university graduate
(excluding those who studied dentistry). (This issue is being pursued in the current ALTC Project, ‘Employability of Bachelor of Arts Graduates', Harvey, 2009). Recent data from PayScale,com, noted by the American Philosophical Association, shows that median salaries for philosophy majors ranks sixteenth in mid-career and that the salaries of philosophy graduates have increased.8
Responses to the survey show that most programs do not track career choices of students who have majored in philosophy. In response to this question, 10 per cent answered yes, and 90 per cent answered no. And of those that said yes, there was little detail. Whilst philosophy programs do not track career choices of philosophy majors formally, some do keep some records of where philosophy majors have gone. Some respondents noted contacts in the Scholarships or Careers Offices. However, obtaining data from careers offices by specialisation of major (rather than Faculty) has proved difficult to obtain. Whilst there is evidence that graduates with philosophical skills are in greater demand, both here and overseas (Cambourne 2008, Drolet 2008, Duffy 2008, Fearn 2009, Gilling 2008, Monaghan 2009 and Shepard 2007), we do not have direct evidence of where philosophy graduates go. A study that explores the areas of employment and the skills respected by employers would be helpful for both the teaching community and the philosophy graduates themselves. For further recommendations from the Forward Thinking Project, see the Final Report.
8 ‘Philosophy Majors and Jobs: Every year around graduation time we hear the reports of
average starting salary of college graduates by major. This data is often used to discourage people from majoring in disciplines like philosophy. Now, however, PayScale.com has released data showing average mid-career salaries of college graduates by major. This data makes the philosophy major look like a much more prudential choice. PayScale.com’s current data on “Best Undergrad College Degrees By Salary (www.payscale.com/2008-best-colleges/degrees.asp) lists starting median salary and mid-career (15.5 years after graduation) median salary for 50 different university majors. Of the fifty, the philosophy major ranks sixteenth in mid-career median salary. Seven of the majors ranking above philosophy are various engineering fields.
Of particular interest is the comparison with Business Management. The starting median salary for Business Management majors is $43,000, while the starting median salary for Philosophy majors is $39,900. By mid-career, however, the median salary for Business Management majors has risen to $72,100, while the median salary for Philosophy majors has jumped to $81,200.’; http://www.apaonline.org//default.aspx; accessed Monday 4th January 2010.
What sector do philosophy students end up in and who are they employed by?
The Graduate Destinations Survey (GDS) asks for information about sector of
employment, employer, full-time and part-time employment, and salary. Data from Arts Students, which isolates Students for the field of study code 917 philosophy and religious studies, shows that most philosophy graduates ‘end up’ in the private sector, then education, closely followed by government, then those that are self-employed and those in the non-profit sector.9 In answer to the question: “What sector do students end
up in and in what numbers across institution and years (2001-2006)”, 42 per cent (276 of 655) went into the private sector; 12 per cent (79 of 655) into Public Education; 9.6 percent are self-employed (63 of 655); 9 per cent (59 of 655) in State Government; 7.5 per cent (49 of 655) in Non-profit; 5.3 per cent (35 of 655) end up in Government; 4.4 per cent (29 of 655) in Private Education; 2 per cent (13 of 655) in category Other and 1.1 per cent (7 of 655) in Local Government.
In answer to the question: Who are students employed by and in what numbers across institution and years (2001-2006)?, we see that the main employers of philosophy graduates are Education; Finance, Health and Community Services; Wholesale and Retail Trade; Government Administration and Defence; and Accommodation, Cafes and Restaurants. Of those whose employer is known, Education is the highest employer (24.3 per cent), followed by Finance (16.2 per cent), Health and Community Services (13.8 per cent) and Wholesale and Retail Trade (12.5 per cent). Government
Administration and Defence employs 8.8 per cent and Accommodation, Cafes and Restaurants 6 per cent. All other categories of employer record less than 5 per cent.
Program & Curriculum
The information in the following section is drawn from several sources. Information relating to curriculum structure and trends is based on responses to the survey of philosophy programs. Twenty four Heads (discipline coordinators or others) responded to the survey. For a full list of respondents see Appendix 2 of this report. For a full list of survey questions see Appendix 2 of the Final Report. Information relating to teaching modes and areas covered by philosophy programs is drawn from a survey of online course handbooks conducted by members of the project team. For a full list of philosophy programs included in the handbook survey see Appendix 3 of this report. Information related to the sub-section on the major, which follows, is drawn from BA program surveys produced by the DASSH BA Arts Scoping Project (Gannaway and Trent 2008) and philosophy program websites.
The major in philosophy
The three year BA is typically made up of 24 single semester units, and the philosophy major is a more or less structured program of study that comprises approximately one-third of the degree, or 8 units. Most philosophy majors require no more than 2 units at
9 This data was prepared by Graduate Careers Australia for the DASSH project ‘Scoping the BA’,
and are available at http://www.dassh.edu.au/basp/data_excel. The project team thanks the Scoping the Project BA project Leader for access to this data.
introductory level, but there are two clear trends in upper level philosophy teaching. One is to provide students with maximal choice and no formal study structure, where students complete 6-8 units at 200 or 300 level to complete their major from a wide range of electives. The other is to structure the program so as to ensure a progression of learning and to require study of a number (often 3-4) of units at 300 or advanced level. In a smaller number of this latter group of philosophy majors are those that include a “pre-honours” unit at 300 level (e.g. University of Sydney).
Curriculum structure
Numbers of units
There is an average of 28 units per program, with an average of 19 offered in one year. There is a significant amount of variation in the number of units offered, between 11 (Swinburne University) and 84 (University of Tasmania). Programs such as at University of Tasmania and LaTrobe University, with large numbers of units listed, include
significant numbers of units not offered (for example, University of Tasmania offered 44 out of 84 units in 2008; LaTrobe offered 26 out of 48) as well as co-badged 2nd year/ 3rd year units, which have been treated as distinct where they have different codes. In some cases the co-badged units are otherwise identical, in other cases they differ in
assessment. Whilst it is difficult to determine from on-line handbooks just how many courses are active, it seems to be the case that many departments have many courses still listed that have not been taught in a number of years.
The average number of first year units is 4 (3.85), with most (3.67) offered within a year. Deakin University offered the fewest (2 courses). The majority of philosophy
departments taught 3-4 courses per year. The average number of units at 2nd/3rd year is
24. There are a number of departments that teach 6 courses each year (University of Tasmania and University of Newcastle, though some of the courses offered are service courses to specific degrees such as police ethics).
More than half of programs (57 per cent) differentiate between 2nd and 3rd year units.
University of Tasmania and La Trobe University have differentiated codes, but the same units/assessment, the other programs that differentiate do so by having distinct units taught only at 2nd year or 3rd year, or differentiated assessment.
Only a small number of programs have capstone unit for majors in philosophy (for example: Macquarie University and University of Melbourne). A number of programs were set to introduce capstone courses in the next few years and some of these may also double as pre-honours courses.
Core units
In response to the question: Are students required to complete any specific core units in order to major in Philosophy?, respondents showed quite a bit of variation. Over half of the programs have no specific core unit requirements. Of the others, many specify particular first year units. La Trobe University is the only program that will soon require core units at all levels. A few programs (University of Queensland, Macquarie University, University of Melbourne) have moved to a model of a required capstone unit at 300
level. In all three cases, this move has been driven by university-wide curriculum changes.
In response to the question: Is there provision for students to count non-Philosophy units toward a Philosophy major?, there was again considerable variation. About a third of programs don’t allow non-philosophy courses to be counted towards the major. Of the majority that do, some seem to allow this on an ad hoc basis. In other cases, specific units from a range of different disciplines areas (but especially politics) have been cross-listed as counting towards a Philosophy major.
Service units to other disciplines
In answer to the question: Does your program teach service units specifically designed for other (non philosophy) programs?, about 2/3rds of programs seem to be involved in service teaching, mainly teaching a range of professional and applied ethics units in health, law, business and media degrees. Critical thinking courses also seem to be offered as service units in a range of programs.
In response to the question: Are units in your program taught (wholly or in part) by staff members from a non-philosophy discipline?; less than a third of programs responded 'yes', although the nature and extent of the teaching by staff in non-philosophy
disciplines is not specified. However it appears that this happens mainly in applied ethics units taught as service units to other disciplines.
Teaching modes and teaching hours per unit
Philosophy programs use different teaching modes —traditional lectures-plus-tutorials; seminars; workshops—depending on unit level.
1
styear
At 1st year level, of the 15 programs for which timetabling information was available, 13
have three contact hours per week, most commonly two 1-hour lectures and a 1 hour tutorial (used in 11 programs). A different mode was used for Critical Thinking /Critical Reasoning at Flinders University (1.5 hour seminar) and Monash University (1 hour plus 2 hour lab). Eight programs used the same mode in each 1st year unit. University of
Sydney HPS had more contact hours, with 4 contact hours per week on all units at all levels, and Murdoch University had fewer, with one 1 hour lecture plus one 1.5 hour tutorial per week at all levels. Swinburne University had 2.5-3 hours of lectures and tutorials.
2
ndyear
At 2nd year, most units still have three contact hours per week. The most common mode
was still two 1-hour lectures and a 1 hour tutorial (used in 11 programs). Some programs use 2-hour seminars at 2nd year level, either independently (Monash University) or with
other lectures or tutorials (LaTrobe University, Swinburne University, University of Western Australia). As at 1st year, Murdoch University has 2.5 hours per week and
University of Sydney HPS has 4. Some programs have fewer tutorials at 2nd year level.
3
rdyear
At 3rd year, ten programs have three contact hours a week, with fewer hours at Monash
University (2 hours per week), Murdoch University (2.5) and University of Queensland (2), and more at University of Sydney HPS (4) and University of Western Australia (4). At this level, seminars are used by Monash University, LaTrobe University, University of Queensland, Swinburne University and University of Western Australia.
At all levels, there was a high degree of uniformity at each level within each program.10
Areas covered by program
1
stYear
Most programs offer at least one broad introductory unit at 1st year level usually,
covering metaphysics and epistemology with some history of philosophy. Other common 1st year areas are Critical Thinking (15 programs out of 21), Logic (6),
ethical/moral/political Philosophy (10), history of philosophy (4) and applied ethics (4). Critical thinking, while one of the most common first year philosophy subjects, is
however generally a service course rather than a fully-fledged introduction to philosophy. Only four programs offered critical thinking beyond first year.
2
ndand 3
rdYear
At second and third year, the most commonly taught areas (from the information obtainable through handbooks) were:11
• European Philosophy (55 units), • Social and Political Philosophy (54), • Applied and Professional Ethics (49), • Metaphysics (46), • History of Philosophy (44), • Philosophy of Science (44), • Moral Philosophy (41), • Logic (40), • Philosophy of Mind (31), • Epistemology (21), • Asian Philosophy (18), • Aesthetics (17), • Critical Thinking (4).12
10Data in this section is drawn from a survey of online course Handbooks.
11Note: The lines between social and political philosophy, and between history of philosophy and
European philosophy are not always easy to draw, since there is often considerable overlap between the content of these courses. In assigning courses to the history of philosophy or European philosophy we used the following principle: Any course that was a single named figure was taken to be a history of philosophy course, unless it was a notably continental thinker of the 20th C, such a for example a course on Heidegger. Philosophy of religion was listed under metaphysics.
Curriculum trends
In response to the question: Are there specific areas of Philosophy that were taught in the decade 1991-2000 but are no longer taught or taught in less depth?13, most
programs identified areas that they no longer teach or that they now teach in less depth than in the past. However, no clear patterns or trends across programs emerged from responses to this question, suggesting that changes to course offerings are very much driven by changes in staffing.
In response to the question: Have any new teaching areas emerged that were not taught, or taught only in passing, in the decade 1991-2000?, similar observations apply as above; there are no clear patterns or trends across programs. A few programs have introduced Asian philosophy, and a few have introduced applied ethics. However, others have reduced their teaching in these areas. Again, it seems likely that this is driven by staff changes and perhaps to some extent by student demand. But the demand seems to be shaped at least to some degree by the broader institutional context.
Graduate attributes
Nearly all universities now identify specific Graduate attributes, or skills that students are expected to develop during their degree programs. Graduate attributes are usually determined by the university, but some universities allow disciplines to develop discipline-specific lists of Graduate attributes. Many universities require graduate attributes to be included in the curriculum, for example in course design, course proposals, assessment and teaching material.
In response to the question: have you been integrating the development of graduate attributes into your philosophy curriculum?; a majority of programs responded Yes. In response to the question concerning whether specific graduate attributes have been determined by the University, developed by the Philosophy discipline, or both, there was significant variation. About half the programs seem required to adopt university
determined attributes. The rest seem to have some latitude to develop their own, within the context of university guidelines.
The philosophy group at the University of Queensland has developed a set of discipline specific graduate attributes, benchmarked against those devised by the British
Association of Philosophy and published through the QAA for higher education in the UK.14 As yet, these have not been incorporated as part of University policy.
13 For a couple of programs the question proved inappropriate at the program was introduced
after 1991 (University of Western Sydney) or the program is too small (University of Ballarat).
14 In 2000, the Quality Assurance Agency (QAA) for Higher Education in the UK released
a subject benchmark statement for philosophy (Bachelor’s degree with honours). This was revised in 2007 (QAA 2007). The statement lists academic standards for
philosophy, including a statement of the nature and extent of philosophy teaching, subject knowledge, understanding and skills, teaching, learning and assessment, as well as benchmark standards and levels of achievement.
Graduate attributes & Curriculum mapping
In response to the question: Are graduate attributes used in unit design (i.e. design of content, assessment methods, teaching methods?, it appears that in many institutions, graduate attributes must be linked to assessment. In a few, they also must be used in curriculum design.
In response to the question: Are there any particular attributes your program has difficulty embedding in its curriculum?, most programs indicated no difficulties
embedding graduate attributes into their curriculum. In cases where problems arise it seems to be because the university determines the attributes, without any latitude being given to disciplinary differences.
Changes to the BA degree and/or program
In response to the question: Has there been any major change to your BA degree or to your program in the period 2001-8 that should be taken into account in interpreting the data gathered here? (e.g. a new BA degree structure, a major Faculty restructuring, excluding staff movements and curriculum trends), 25 per cent of respondents answered YES and 75 per cent, NO.
In response to the question: Are there any major changes planned for your BA degree or your program in the next five years (2009-2013)?, 50 of respondents answered YES and 50 per cent NO.
Teaching Issues
Data used in this section is drawn from the responses to the survey of philosophy programs. Twenty four Heads (discipline coordinators or others) responded to the survey. For a full list if respondents see Appendix 2 of this report. For a full list of survey questions see Appendix 2 of the Final Report.
Developments and trends in teaching
Changes in teaching such as increased use of on-line teaching and team teaching. In response to the question: Approximately what proportion of units in your program are taught by a team of academics (not including part-time tutors)?, there were very
significant variations in response across programs. Half (12/24) the programs surveyed indicate that very few units are team taught (0-20 per cent). In the remaining programs there seems to be an even split between those with around half units team taught and those where most or all units are team taught.
In response to the question: Have there been any innovations in teaching modes in your program?, half the philosophy programs (12/24) reported using on-line resources
including: the introduction of e-learning tools; on-line self-testing; online blogs and quizzes, and podcasting; 1 program noted several staff use the Masur method, whilst
some use the Keller plan. Others reported the use of interactive teaching in lectures and tutorials, utilising a component of peer assessment in some writing tasks and another using music to present philosophical argument. A significant number of programs (9/24) reported either no innovations or did not respond to the question.
On-line learning
Only one out of 24 Programs responding to the Program Survey made no use of electronic resources in teaching. Almost all programs reported using some form of electronic resources, including using discussion boards or email to communicate with students; making audio recordings of lectures available on-line; using on-line quizzes; and using electronic submission of assignments. In response to the question: Are web-based learning and teaching tools typically used in the internal delivery of first, second, or third year units? 80 per cent of programs reported using discussion boards and email; 75 per cent reported that audio recordings of lectures were available on-line; 30 per cent reported using electronic submission of assessment and 50 per cent reported using on-line quizzes.
In response to the question: Are there any internal units taught solely online?, a majority of respondents answered No (including a few that did not answer the question). Of those that responded Yes, La Trobe University noted a critical thinking unit (one semester in 1st year) offered solely online; Monash University noted units are solely online for
off-campus delivery of the major and Australian Catholic University have one master’s unit in Philosophy and Religion offered solely online. At University of Queensland there are several units taught solely online though to upper levels.
Around half the programs reported that e-resources improved students' access to teaching materials and improved communication with and between students. In response to the question: What are the advantages, if any, of using online teaching resources in your program? 2/20 reported no advantages; 7/20 reported that it improves students' access to lectures; 3/20 reported that it improves communication with and between students; 1/20 reported that it improves students' engagement; and 1/20 reported that it improves lecture attendance.
However, significant numbers of Programs reported that the use of e-resources reduced class attendance and in-class interactions. Several also reported that reliance on e-resources encourages poor study habits. A common complaint was that, overall, the new technologies were less time-efficient than traditional teaching methods. Technical
problems were also widely reported. Overall, considerable doubts were expressed about the educational value of on-line technology. In response to the question: What
difficulties, if any, has your program encountered in using online teaching resources?, 6/20 noted technical problems; 3/20 reported reduced class interactions; 5/20 reported reduced class attendance; 3/20 reported that it encourages poor study habits; and 4/20 reported that it is time intensive for staff.
Broadly speaking, there appear to be two opposed positions on e-resources. On the one hand, many staff expressed strong positive attitudes towards the use of e-resources to support learning and teaching philosophy at university. On the other, a considerable number of staff expressed strong negative attitudes towards the use of e-resources, because students may come to view the downloading of online material as an easy alternative to attending lectures and actively engaging in tutorial discussion. One
academic went as far as to describe the use of e-resources as "an educational cane toad".
Clearly further research on the advantages and disadvantages of the use of on-line teaching tools is required. It may be that such tools are useful in some teaching areas of the discipline (for example logic and critical reasoning) but of less value in others (for example ethics). It is also possible that important distinctions can be made amongst the wide variety of on-line resources that are available and their effective deployment in teaching and learning. It may be, for example, that the use of email and discussion boards fosters communication with and between students, but that providing excessively detailed lecture notes on-line discourages students from independent learning.
A further very striking feature of the Project's research in this area was the high level of dissatisfaction with the training provided by universities in the use of on-line facilities. Only half the respondents reported that the training available in the construction of line resources was useful; and only 40 per cent reported that training in the use of on-line resources in teaching was useful. Clearly there is a major issue here which universities need to address.
In response to the question: Is there training/support available for staff in the
construction of online teaching resources?, 18 (90 per cent) responded yes and 2 (10 per cent), no. In response to the question: Have most staff in your program availed themselves of the training/support provided?, of the programs responding to the question, about 50 per cent responded yes, and about 50 per cent, no. In response to the question: Do staff typically find the training/support helpful?, of the programs
responding to the question, about 50 per cent responded yes, and about 50 per cent, no. In response to the question: Is there training/support available for staff in teaching with online resources?, of the programs responding to the question, about 95 per cent
responded yes, and about 5 per cent, no. In response to the question: Have most staff in your program availed themselves of the training/support provided?, of the programs responding to the question, about 28 per cent responded yes, and about 72 per cent, no. In response to the question: Do staff typically find the training/support helpful?, of the programs responding to the question, 29 per cent responded yes, and 71 per cent, no.
Assessment
Assessment modes
1st year
Only University of New South Wales HPS and University of Sydney HPS had uniform assessment across all units, with other programs having different assessment for
different units. The uniformity can only be determined by on-line handbook and it may be the case that all courses have a generic assessment package for the purposes of the on-line handbook but actual assessment practices in individual units may vary
considerably.
The most common form of assessment at this level were essays, used by at least some units in all programs. Written essay length varied considerably, from 550 to 2000 words. Most programs (10) also included assessment based on tutorial
participation/presentations. Nine programs use formal exams, worth up to 60 per cent (Sydney), and tests were used by six programs. Nine programs use homework exercises or other short assignments. Other forms of assessment were bibliographic exercises (ANU) and quizzes (UQ). The number of assessment tasks varied greatly. Some
programs had only two assessment tasks while others had five. A common assessment package for standard level one philosophy courses was two short written assignments, a test or exam and participation. Critical thinking, which is usually taught at first year, has the most diverse assessment package. This reflects the the content of these courses, which is well suited to on-line discussion, quizzes and short tests.
2nd and 3rd year
From the information given it appears that only Murdoch University and University of Sydney HPS had uniform assessment across all units. All programs used essays at this level, ranging from “short essays” (University of Sydney HPS) up to 5000 word essays in some units at Melbourne. Essay length varied within, as well as across, programs, for example, essays at Australian National University were from 1500-4000 words, and 1250-3000 words at LaTrobe University. A single major essay was worth up to 50 per cent in many programs, and up to 70 per cent at Newcastle, and 100 per cent in some units at University of Melbourne. Some units at Australian National University and Monash University offered students choice about how they were assessed (for example, either an exam or additional written work).
Assessment tasks were more varied at 2nd year level. As well as the modes of
assessment used at 1st year level, 2nd year assessment tasks included essay outlines
(University of Sydney), article reviews or précis (Australian National University,
University of New South Wales, University of Western Australia), journals and research journals (University of Western Australia, University of New South Wales), Research portfolios (University of New South Wales HPS) and Creative writing (University of Queensland). All programs for which information was available assessed tutorial presentations or participation in at least some units at this level. The weightings for this part of the assessment varied between 3 per cent (University of Melbourne) to 25 per cent in some units at University of New South Wales.
At 3rd year, similar assessment was used to 2nd year. Most institutions did not make any
consistent distinction between the amount of assessment at 2nd and 3rd year.
Assessment tasks used were the same as at 2nd year, except for blogs added for 3rd
year at Deakin University.15
Developments and Trends
The following table lists the results in answer to the question: What developments and trends in assessment modes have occurred since 2000? (For example, online quizzes, re-introduction of exams etc.).
15Data in this section is drawn from a survey of online course Handbooks. Information from 15