Total state and
local business taxes
State-by-state estimates for
fiscal year 2013
August 2014
The authors
Andrew Phillips is a principal in the Quantitative Economics and Statistics (QUEST) practice of Ernst & Young LLP and directs Ernst & Young LLP’s Regional Economics practice. He has a MA in Economics from Johns Hopkins University and a BA in Economics from Emory University.
Caroline Sallee, Ernst & Young LLP, is a manager in the Quantitative Economics and Statistics practice. She has an MPP from the University of Michigan.
Katie Ballard, Ernst & Young LLP, is a senior analyst in the Quantitative Economics and Statistics practice. She has a BS in Economics and Political Science from Clemson University and an MPP degree from the Thomas Jefferson Program in Public Policy at the College of William & Mary.
Daniel Sufranski, Ernst & Young LLP, is an analyst in the Quantitative Economics and Statistics practice. He has a BA in Economics and Political Science from Washington University in St. Louis.
This study was prepared by the Quantitative Economics and Statistics (QUEST) practice of Ernst & Young LLP in conjunction with the Council On State Taxation (COST).
QUEST is a group of economists, statisticians, survey specialists and tax policy researchers within Ernst & Young LLP’s National Tax Practice, located in Washington, DC. QUEST provides quantitative advisory services and products to private and public sector clients that enhance business processes, support regulatory compliance, analyze proposed policy issues and provide litigation support.
COST is a nonprofit trade association based in Washington, DC. COST was formed in 1969 as an advisory
committee to the Council of State Chambers of Commerce and today has an independent membership
This study presents detailed state-by-state estimates of the state and local taxes paid by businesses for FY2013. It is the 12th annual report prepared by
Ernst & Young LLP in conjunction with the Council On State Taxation (COST).
Businesses paid close to $671 billion in state and local taxes in FY2013, an increase of 4.3% from FY2012. State business taxes grew somewhat more quickly than local taxes, with state taxes growing 4.7% compared to local tax growth of 3.7%. In FY2013, business taxes accounted for 44.9% of all state and local taxes. While this is the lowest share of total state and local taxes since FY2006, the business share has remained relatively stable and peaked at 45.7% in FY2007, less than one percentage point different from the current share. The business share has been within one percentage point of 45% since FY2003.
The change in business taxes suggests relatively broad, yet still gradual, economic recovery. All categories of business taxes other than public utility and severance taxes rose in FY2013, which indicates increases in property values, business incomes, capital expenditures and input purchases. Lower energy prices, potentially due to expanded natural gas production in North America, resulted in lower severance and public utility taxes in 28 of the 48 states that levy such taxes. The state and local business tax estimates presented in this study reflect tax collections from July 2012
through June 2013 in most states.1 These include
business property taxes; sales and excise taxes paid by businesses on their input purchases and capital expenditures; gross receipts taxes; corporate income and franchise taxes; business and corporate license taxes; unemployment insurance taxes; individual income taxes paid by owners of non-corporate (pass-through) businesses; and other state and local taxes that are the statutory liability of business taxpayers.
Executive summary
Key findings of the study include:
• Following two years of decline in FY2009 and FY2010, state and local business taxes increased for a third consecutive year in FY2013. From FY2012 to FY2013, overall state and local business taxes increased 4.3%, with state business taxes growing by 4.7% and local business taxes growing 3.7%.
• After three straight years of growth rates below 1%, business property taxes increased 3.7% in FY2013, a gain of $8.5 billion. Property taxes remain by far the largest state and local tax paid by businesses, accounting for 36.1% of the total.
• General sales taxes on business inputs and capital investment totaled $139.8 billion, or 20.8% of state and local business taxes. While state sales taxes increased 3.8%, general sales taxes paid by businesses remained flat at the local level.
• In FY2013, state and local corporate income tax collections were $53.3 billion, or 7.9% of all state and local business taxes. FY2013 marked the third consecutive year of corporate income tax growth. While overall state and local corporate income tax collections grew in FY2013 by 8.4%, the corporate income tax has been the slowest of the major types of business taxes to return to pre-recession levels. In FY2013, state and local corporate income tax collections were still nearly 13% below the prior peak that occurred in 2007.
• Individual income taxes on pass-through business income accounted for 5.5% of total state and local business taxes. Individual income taxes on business income grew 13.2%, the highest rate of any tax in FY2013.
• On average, business taxes are equal to 4.7% of private-sector gross state product (GSP), which measures the total value of a state’s annual private-sector production of goods and services. There is
substantial variation, with ratios ranging from 3.3% in Oregon to 12.0% in Alaska. • Businesses continue to pay more in
state and local taxes than they receive in benefits, on average. On average, businesses paid $3.26 for every dollar of government spending benefiting businesses, assuming that education spending does not benefit local businesses. An alternate assumption, that half of education spending benefits local businesses, still results in businesses paying 20% more in taxes than the cost of state and local government spending benefiting business.
• Twelve states have still not returned to their prior highs for business tax collections reached near the start of the last recession. The corporate income tax has been the slowest to rebound, with 28 of the 47 states that levy some form of corporate income tax not yet returning to their prior peak level of collections.
Businesses paid $670.8 billion in total state and local taxes in FY2013, as presented in Table 1.2 This section describes the
business taxes in more detail and highlights the key results. • As shown in Table 1 and Figure 1, property taxes on real,
personal and utility property owned by businesses account for the largest share of total state and local business taxes, 36.1% or $242.1 billion in FY2013. Business property taxes increased 3.7% in FY2013, the first time since FY2009 that the growth rate has surpassed 0.9%.
• General sales and use taxes paid by businesses on purchases of inputs, including capital equipment, totaled $139.8 billion, or 20.8% of all state and local business taxes. General sales and use taxes paid by businesses increased 3.0% overall. Sales and use taxes collected on sales to final consumers are excluded; only the taxes paid on businesses’ operating inputs and capital equipment purchases are included in the total business tax estimates.3
• State and local corporate income tax collections were $53.3 billion in FY2013, an increase of 8.4% from FY2012. FY2013 was the third consecutive year of rising state and local corporate income taxes following three consecutive years of decline from FY2008 to FY2010. State and local corporate income taxes have risen 20% since FY2010, but remain 13% below the pre-recession peak that occurred in FY2007. While the economic recovery has played a large role in bolstering corporate income tax revenues, rate changes since FY2010 have also affected corporate tax revenues. Higher rates in Connecticut and Illinois have partially offset rate reductions in Idaho, Indiana, Massachusetts, North Dakota, Oregon and West Virginia.
• Employer contributions to unemployment insurance
(unemployment taxes) were $50.8 billion in FY2013, an increase of 5.1% from FY2012. Following increases in unemployment tax collections of 27.1% in FY2011 and 17.5% in FY2012, this year’s 5.1% growth rate marked a sharp reduction largely due to reduced unemployment rates in most states, progress toward replenishing state trust funds and the repayment of state loans from the federal government that funded benefit payments during the recession.
Total state and local business
taxes in FY2013
Table 1. Total state and local business taxes, FY2013 ($billions)
Business tax
FY2012*
FY2013
2013 % total taxes
One-year change
Property taxes on business property $233.5 $242.1 36.1% 3.7%
General sales taxes on business inputs 135.8 139.8 20.8% 3.0%
Corporate income tax 49.1 53.3 7.9% 8.4%
Unemployment insurance 48.4 50.8 7.6% 5.1%
Excise taxes 35.7 38.2 5.7% 7.1%
Individual income tax on business income 32.3 36.6 5.5% 13.2%
Business and corporate license 34.7 36.3 5.4% 4.7%
Public utility taxes 27.2 26.6 4.0% -2.2%
Insurance premium taxes 17.3 18.1 2.7% 4.5%
Severance taxes 17.4 16.6 2.5% -4.4%
Other business taxes 12.1 12.5 1.9% 3.5%
Total state and local business taxes $643.4 $670.8 100.0% 4.3%
Note: Amounts may not sum due to rounding.
*FY2012 tax estimates are revised from the COST FY2012 study due to newly released data from the U.S. Census Bureau. See Appendix for more information.
• Excise taxes paid by business were an estimated $38.2 billion in FY2013. Excise taxes attributed to business include a portion of motor fuel taxes and other excise taxes, such as taxes on hotel and rental car expenditures by business, as well as health care provider taxes on the revenue of hospitals and other providers of health services.
• Taxes on insurance premiums totalled $18.1 billion in FY2013, an increase of 4.5%.
• Public utility taxes decreased by 2.2% to $26.6 billion in FY2013, the second consecutive year of decline. These taxes are generally based on business gross receipts, and because they are often levied in lieu of property or corporate income taxes, they are allocated solely to business.
• Business and corporate license taxes totaled $36.3 billion, including $30.0 billion of corporation license and other occupation and business license taxes. Included in corporate license taxes are Ohio’s Commercial Activity Tax and Texas’ Margin Tax. These are based on gross receipts and constitute the primary business entity tax in each state, neither of which imposes a traditional corporate income tax. • State and local severance taxes fell by 4.4% in
FY2013. The $0.8 billion cumulative decrease in severance taxes was driven primarily by a $1.8 billion, or 31%, decrease in state severance tax collections in Alaska. This reduction was caused in part by a change to Alaska’s severance tax and more than offset the $1.7 billion combined severance tax revenue gains in North Dakota and Texas.
• Individual income taxes paid by owners of pass-through entities (e.g., partnerships, sole proprietorships, limited liability companies and S-corporations) totaled an estimated $36.6 billion in FY2013. Individual income taxes on pass-through business income represent 5.5% of total state and local business taxes, equivalent to 69% of corporate income tax collections in FY2013. State and local collections of individual income taxes on pass-through business income grew by 13.2% in FY2013, the fastest growth of any business tax. However, this pace may subside somewhat in the coming years as Kansas, Ohio and Missouri have enacted legislation creating exemptions for pass-through income. Kansas’ exemption took effect midway through FY2013. Ohio’s exemption was enacted in July 2013 and retroactive to the start of the calendar year, but had no impact on FY2013 collections. Missouri’s legislature overrode the Governor’s veto in May 2014 to enact a pass-through exemption.
• Other business taxes totaled $12.5 billion in FY2013, a 3.5% increase from the previous year.
Figure 1. Composition of total state and local business
taxes — FY2013
n Taxes on business property
n Sales tax on business inputs
n Excise, utility and insurance taxes
n Corporate income tax
n Unemployment insurance tax
n Individual income tax on business income
n Business license, severance and other business taxes
36.1%
20.8% 12.3%
7.9% 7.6%
9.7% 5.5%
This study generally defines business taxes as those that are the legal liability of businesses. Certain taxes collected by business, such as excise taxes on tobacco and alcohol and sales taxes on household purchases, are not included. In addition, individual income tax on pass-through business income is included as a legal tax liability of business owners. The business taxes included in this analysis are:
• Property taxes paid by business on real and personal property; taxes on income-generating, residential rental property are treated as business taxes • General sales taxes paid by businesses on purchases
of goods and services used in production; sales taxes on final goods paid by consumers are not included • A portion of excise taxes, such as business’ share of
motor fuel taxes • Corporate income taxes
• Taxes on insurance premiums and utility gross receipts, which are in some cases levied in lieu of other business entity taxes
• Individual income taxes on pass-through business income; taxes withheld on employee earnings are not considered business taxes
• Unemployment insurance (UI) tax paid by employers
• Business licenses, including general business licenses, specific industry and occupational licenses, and commercial motor vehicle licenses
• Severance taxes on mining, natural gas, oil and other natural resources
In most states, the corporate income tax is the primary tax levied specifically on business entities, but other types of taxes are used in several states. Ohio, Texas and Washington levy a tax based on gross receipts in place of a traditional corporate income tax. Michigan briefly levied a tax based on gross receipts (the Michigan Business Tax or MBT) until the middle of FY2012, when the MBT was replaced with a corporate income tax. In addition, New Hampshire’s Business Enterprise Tax is levied on a value-added base rather than income. Many states also levy franchise taxes based on the capital stock or net worth of a business. As shown in Table 2, taxes levied on a gross receipts base are classified as corporate income, corporate license or sales tax in this study consistent with their U.S. Census Bureau classification. If each of these taxes were combined into a single gross-receipts-based business tax category, the collections would total $9.8 billion, equal to 18.5% of reported corporate income taxes shown in Table 1. Not shown in Table 2 are minimum taxes based on gross receipts levied as part of state corporate income tax systems. For example, Oregon imposes a minimum tax ranging from $150 to $100,000 depending on the taxpayer’s gross receipts. For taxpayers subject to these taxes, the minimum taxes function as gross receipts taxes but are generally included in the corporate income tax statistics.
Total state and local business
taxes in FY2013
Table 2. State gross receipts and value-added business entity taxes, FY 2013 ($billions)
Business tax
U.S. Census Bureau tax
classification
FY2012
FY2013
One-year
change
New Hampshire — Business Enterprise Tax Corporate income tax 0.2 0.2 11.6%
Ohio — Commercial Activity Tax Corporate license tax 1.6 1.5 -4.8%
Texas — Texas Margin Tax Corporate license tax 4.6 4.8 5.0%
Washington — Business & Operation Tax General sales and use tax 3.1 3.3 5.8%
Total gross receipts taxes* $9.5 $9.8 3.8%
Note: Figures may not sum due to rounding.
*Michigan eliminated the Michigan Business Tax on January 1, 2012. Michigan’s gross receipts tax collections in FY2012 totaled $1.3 billion, bringing the national FY2012 total to $10.8 billion.
State and local business tax revenues both grew between FY2012 and FY2013, with state taxes growing at a faster rate than local tax revenue. Tables 3-A and 3-B provide dollar amounts, percentage distributions and growth rates in FY2013 for total business taxes at the state and local levels of government.
Total state and local business taxes increased by $27.4 billion in FY2013, after growing by $17.7 billion in FY2012. State and local business tax revenues grew 4.7% and 3.7%, respectively. The largest local tax, business property taxes, had remained relatively flat since 2009 but increased by $8.4 billion in FY 2013. While local public utility taxes fell, the increase in property taxes alone more than offset that decline in revenue. Local excise and other business taxes rose 5.1% and 12.3%, respectively.
At the state level, most business taxes increased or declined slightly, with the exception of state severance taxes, which saw a significant drop due largely to the decline in Alaska severance tax collections. The increase in state business taxes was primarily due to increases in general sales and use, corporate income, and individual income tax collections, each of which increased by over $3 billion.
Tables 3-A and 3-B demonstrate that the composition of state business taxes differs significantly from business taxes at the local level. Table 3-A shows the percentage distribution of state taxes by tax type; Table 3-B shows the distribution of local business taxes. While state business taxes draw on a relatively broad set of sources, local governments rely heavily on property taxes, which make up 76.8% of local business taxes. The largest business tax at the state level, the sales and use tax, accounts for 30.0% of state business taxes. The degree to which states impose sales and use taxes on business purchases, and the implications of proposals to increase this leading component of state business taxes, are detailed in the 2013 Ernst & Young LLP/COST study, What’s Wrong with Taxing Business Services? Adverse Effects from Existing and Proposed Sales Taxation of Business Investment and Services.
Table 3-A. State business taxes, FY2013 ($billions)
Business Tax
State business
taxes FY2012
State business
taxes FY2013
business taxes
% total state
state business taxes
One-year growth,
General sales and use tax on inputs $106.0 $110.0 30.0% 3.8%
Unemployment insurance $48.4 $50.8 13.9% 5.1%
Corporate net income $42.2 $45.5 12.4% 7.8%
Individual income tax $29.3 $33.2 9.1% 13.6%
Excise taxes on business inputs $30.0 $32.3 8.8% 7.4%
Business license tax $27.1 $27.7 7.6% 2.4%
Insurance premium tax $16.8 $17.5 4.8% 4.3%
Severance taxes $17.3 $16.5 4.5% -4.5%
Public utility tax $14.7 $14.5 4.0% -1.3%
Property tax on business property $8.4 $8.6 2.3% 1.6%
Other business taxes $9.9 $10.0 2.7% 1.2%
Total state business taxes $350.1 $366.7 100.0% 4.7%
Note: Figures may not sum due to rounding.
Source: Ernst & Young LLP estimates based on data from the U.S. Census Bureau, state and local government finances.
Table 3-B. Local business taxes, FY 2013 ($billions)
Business tax
Local business
taxes FY2012
Local business
taxes FY2013
business taxes
% total local
local business taxes
One-year growth,
Property taxes on business property $225.1 $233.5 76.8% 3.7%
General sales taxes on business inputs $29.8 $29.8 9.8% 0.1%
Public utility taxes $12.4 $12.0 3.9% -3.4%
Excise taxes on business inputs $5.6 $5.9 1.9% 5.1%
Other business taxes $20.4 $22.9 7.5% 12.3%
Total local business taxes $293.3 $304.1 100.0% 3.7%
Note: Figures may not sum due to rounding.
State-by-state business tax collections
Figure 2 shows the state-by-state change in total stateand local business taxes between FY2012 and FY2013. States with significant tax changes in FY2013 and trends in business tax collections are described below • In 2013, business property taxes increased
substantially for the first time since 2009. The higher national growth rate (3.7%) was driven largely by above average gains in three large states: California, New York and Texas. Thirty-seven states grew at a slower rate than the national average. Texas had the largest dollar increase in business property taxes, collecting $1.6 billion more than in 2012. North Dakota had the highest growth rate for business property taxes, increasing 22.4%.
• Alaska saw the single largest decline in business taxes. Contributing to the reduction was a mid-FY2013 reduction in the severance tax rate. Severance tax revenue ultimately fell 31%. Unlike most states, the state severance tax is by far the largest business tax in Alaska, accounting for 75% of Alaska state and local business taxes in FY2012 and 68% in FY2013, even with the sharp decline. Though Oklahoma and Wyoming also saw declines in severance tax revenue, other states such as North Dakota and Texas saw severance tax gains of 43.4% and 27.1%, respectively. Oklahoma’s severance tax collections fell 39.2%.
• Business taxes on individual income grew at a brisk 13.2% pace in 2013. Though corporate income taxes are often thought of as the main tax on business income, individual income taxes on business income are playing an increasingly important role in the taxation of business income. In 13 states, individual income tax on pass-through entity income exceeds corporate income tax revenue.4 Missouri and Ohio
recently enacted laws that will exempt a portion of pass-through income from personal income taxes, but neither provision took effect in time to impact FY2013 collections. In addition, Ohio relies on a gross receipts tax at the state level rather than a corporate income tax. Absent from the list is Kansas, which implemented its own exemption for pass-through income midway through fiscal year 2013. • Gains in state sales tax collections were almost
entirely due to expansion of the sales tax base. Only California increased its state sales tax rate during fiscal year 2013, increasing the state rate by 0.25% on January 1, 2013.
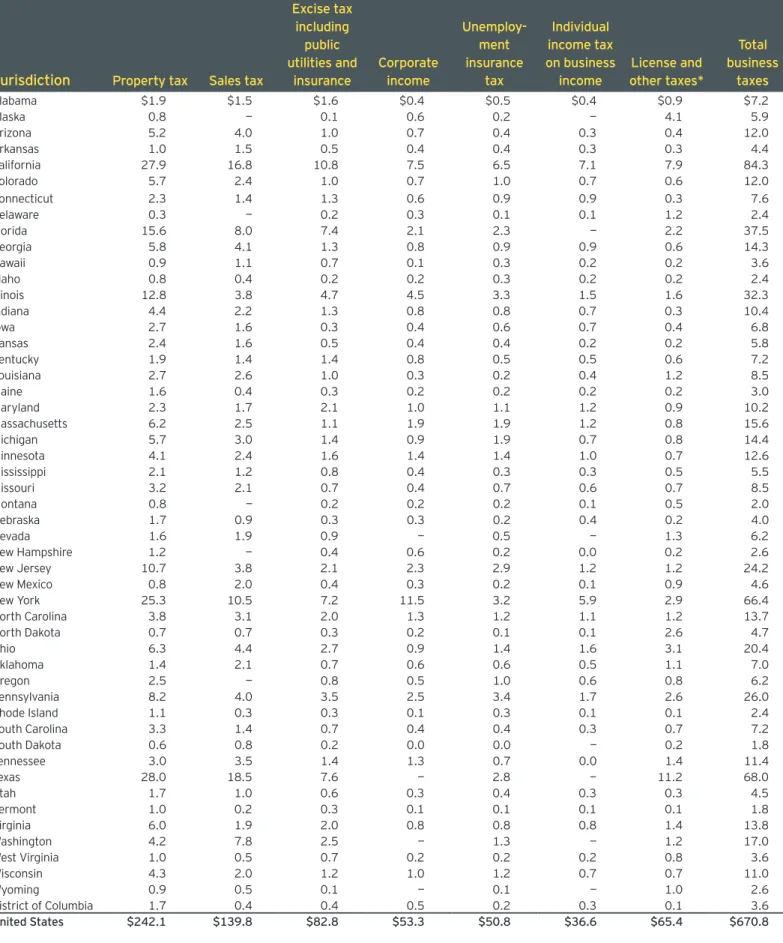
Table 4 presents business tax collections by tax type and state. The results show that states vary widely in the composition of their business tax structures, producing implications for revenue growth and stability in each state. Appendix Table A-3 presents the percentage composition by tax type for each of the 50 states and the District of Columbia.
Figure 2. Change in state and local business taxes by state, FY2012-FY2013
(Percentage change in total state and local business taxes)
Source: Ernst & Young LLP estimates based on data from the U.S. Census Bureau, state and local government Alaska, -23.7%
Louisiana, -6.5%Wyoming, -5.1% Kansas, -2.6%Maine, -0.6% Oklahoma, -0.2% Connecticut, 1.1% New Mexico, 1.1%Alabama, 1.8% Missouri, 1.8% Wisconsin, 2.3% West Virginia, 2.4%Minnesota, 2.5% Rhode Island, 2.6%Nebraska, 2.7% Oregon, 3.1% Massachusetts, 3.2%Kentucky, 3.3% Iowa, 3.3% Arizona, 3.3% New York, 3.4% South Dakota, 3.4%Michigan, 3.5% Ohio, 3.7% Montana, 3.8%Florida, 3.9% Indiana, 4.1% Virginia, 4.1% Washington, 4.3% New Hampshire, 4.3%Dist. Columbia, 4.3% Delaware, 4.4% South Carolina, 4.4%Arkansas, 4.7% Idaho, 4.7% Colorado, 4.9% Pennsylvania, 4.9%Tennessee, 4.9% Maryland, 4.9%Illinois, 5.5% Georgia, 5.7% California, 5.9%Nevada, 6.1% Vermont, 6.3% North Carolina, 6.7%New Jersey, 7.3% Utah, 7.5% Texas, 7.7% Mississippi, 7.7%Hawaii, 10.4% North Dakota, 29.9%
US state and local business tax growth 4.3%
Table 4. State and local business taxes, by type, FY2013 ($billions)
Jurisdiction
Property tax Sales taxExcise tax including
public utilities and
insurance
Corporate income
Unemploy-ment insurance
tax
Individual income tax on business
income
License and other taxes*
Total business
taxes
Alabama $1.9 $1.5 $1.6 $0.4 $0.5 $0.4 $0.9 $7.2
Alaska 0.8 — 0.1 0.6 0.2 — 4.1 5.9
Arizona 5.2 4.0 1.0 0.7 0.4 0.3 0.4 12.0
Arkansas 1.0 1.5 0.5 0.4 0.4 0.3 0.3 4.4
California 27.9 16.8 10.8 7.5 6.5 7.1 7.9 84.3
Colorado 5.7 2.4 1.0 0.7 1.0 0.7 0.6 12.0
Connecticut 2.3 1.4 1.3 0.6 0.9 0.9 0.3 7.6
Delaware 0.3 — 0.2 0.3 0.1 0.1 1.2 2.4
Florida 15.6 8.0 7.4 2.1 2.3 — 2.2 37.5
Georgia 5.8 4.1 1.3 0.8 0.9 0.9 0.6 14.3
Hawaii 0.9 1.1 0.7 0.1 0.3 0.2 0.2 3.6
Idaho 0.8 0.4 0.2 0.2 0.3 0.2 0.2 2.4
Illinois 12.8 3.8 4.7 4.5 3.3 1.5 1.6 32.3
Indiana 4.4 2.2 1.3 0.8 0.8 0.7 0.3 10.4
Iowa 2.7 1.6 0.3 0.4 0.6 0.7 0.4 6.8
Kansas 2.4 1.6 0.5 0.4 0.4 0.2 0.2 5.8
Kentucky 1.9 1.4 1.4 0.8 0.5 0.5 0.6 7.2
Louisiana 2.7 2.6 1.0 0.3 0.2 0.4 1.2 8.5
Maine 1.6 0.4 0.3 0.2 0.2 0.2 0.2 3.0
Maryland 2.3 1.7 2.1 1.0 1.1 1.2 0.9 10.2
Massachusetts 6.2 2.5 1.1 1.9 1.9 1.2 0.8 15.6
Michigan 5.7 3.0 1.4 0.9 1.9 0.7 0.8 14.4
Minnesota 4.1 2.4 1.6 1.4 1.4 1.0 0.7 12.6
Mississippi 2.1 1.2 0.8 0.4 0.3 0.3 0.5 5.5
Missouri 3.2 2.1 0.7 0.4 0.7 0.6 0.7 8.5
Montana 0.8 — 0.2 0.2 0.2 0.1 0.5 2.0
Nebraska 1.7 0.9 0.3 0.3 0.2 0.4 0.2 4.0
Nevada 1.6 1.9 0.9 — 0.5 — 1.3 6.2
New Hampshire 1.2 — 0.4 0.6 0.2 0.0 0.2 2.6
New Jersey 10.7 3.8 2.1 2.3 2.9 1.2 1.2 24.2
New Mexico 0.8 2.0 0.4 0.3 0.2 0.1 0.9 4.6
New York 25.3 10.5 7.2 11.5 3.2 5.9 2.9 66.4
North Carolina 3.8 3.1 2.0 1.3 1.2 1.1 1.2 13.7
North Dakota 0.7 0.7 0.3 0.2 0.1 0.1 2.6 4.7
Ohio 6.3 4.4 2.7 0.9 1.4 1.6 3.1 20.4
Oklahoma 1.4 2.1 0.7 0.6 0.6 0.5 1.1 7.0
Oregon 2.5 — 0.8 0.5 1.0 0.6 0.8 6.2
Pennsylvania 8.2 4.0 3.5 2.5 3.4 1.7 2.6 26.0
Rhode Island 1.1 0.3 0.3 0.1 0.3 0.1 0.1 2.4
South Carolina 3.3 1.4 0.7 0.4 0.4 0.3 0.7 7.2
South Dakota 0.6 0.8 0.2 0.0 0.0 — 0.2 1.8
Tennessee 3.0 3.5 1.4 1.3 0.7 0.0 1.4 11.4
Texas 28.0 18.5 7.6 — 2.8 — 11.2 68.0
Utah 1.7 1.0 0.6 0.3 0.4 0.3 0.3 4.5
Vermont 1.0 0.2 0.3 0.1 0.1 0.1 0.1 1.8
Virginia 6.0 1.9 2.0 0.8 0.8 0.8 1.4 13.8
Washington 4.2 7.8 2.5 — 1.3 — 1.2 17.0
West Virginia 1.0 0.5 0.7 0.2 0.2 0.2 0.8 3.6
Wisconsin 4.3 2.0 1.2 1.0 1.2 0.7 0.7 11.0
Wyoming 0.9 0.5 0.1 — 0.1 — 1.0 2.6
District of Columbia 1.7 0.4 0.4 0.5 0.2 0.3 0.1 3.6
Comparing state business tax levels
A state’s business tax burden can be measured in manyways, including the level of business taxes compared to the level of economic activity that is subject to taxation and the final incidence of business taxes, after they have been shifted to consumers or owners of factors of production, including workers.5 State and local business
taxes are imposed on a variety of tax bases, including net income, input purchases, payroll, property and other tax bases. Therefore, a broad measure of a state’s overall economic activity should be used to determine the measure of aggregate business tax burden that can be compared across states.
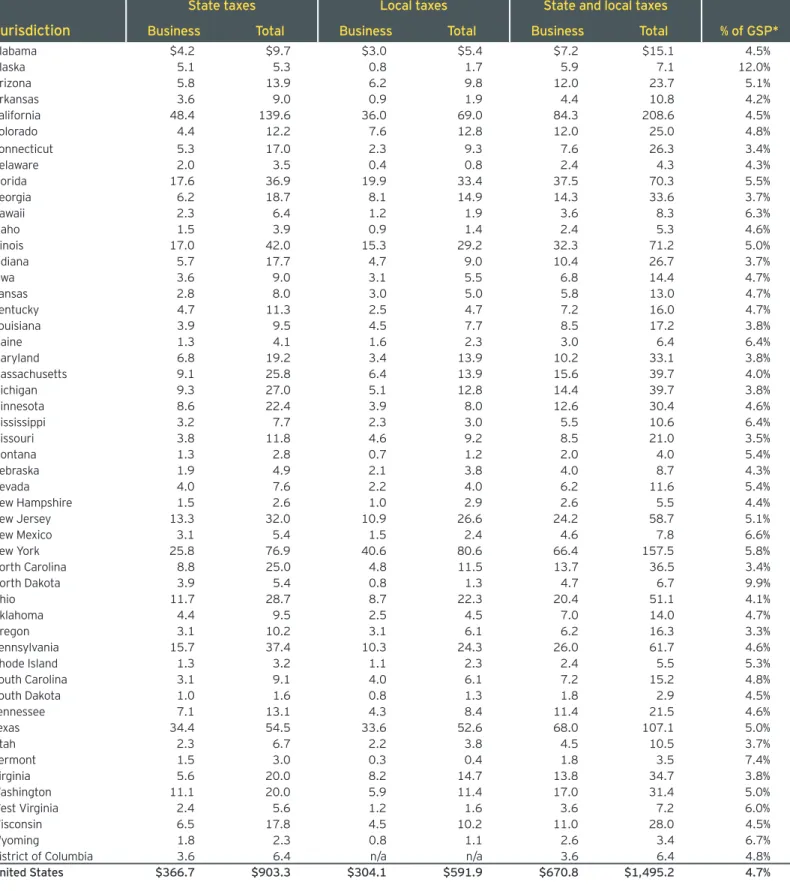
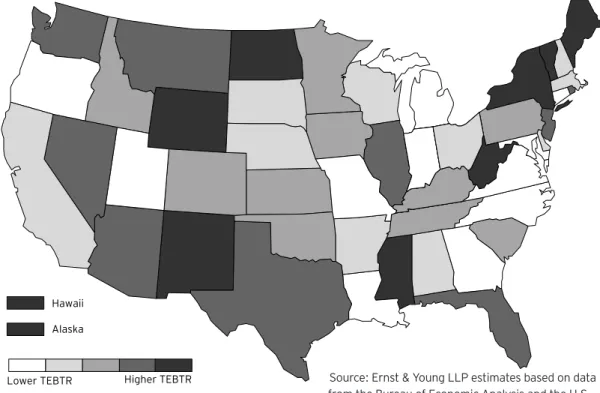
Table 5 presents state-by-state estimates of state and local business and total taxes, as well as the total effective business tax rate (TEBTR) imposed on business activity by state and local governments. The TEBTR is measured as the ratio of state and local business taxes to private-sector gross state product (GSP), the total value of a state’s annual production of goods and services by the private sector. The average TEBTR across all states is 4.7%; Oregon had the lowest TEBTR at 3.3%, while Alaska had the highest at 12.0%. TEBTRs provide a starting point for comparing burdens across states, but they do not provide sufficient information to evaluate a state’s competitiveness. States with relatively low TEBTRs that derive most of their business taxes from origin based taxes such as property taxes and sales taxes are not as competitive as states with higher TEBTRs that rely on taxes that have a larger impact on out-of-state businesses. TEBTRs also do not indicate the economic incidence of a tax. When a tax can be passed on to consumers, the tax is not a burden in the same way as taxes where the economic incidence, not just the legal liability, falls on the owners of a business. This is particularly likely in some of the states with the highest TEBTRs, such as Alaska, North Dakota, and Wyoming. These states rely on severance taxes (included in the “Other taxes” category in this analysis) which are imposed on businesses but are likely passed on to consumers, many of whom are located outside the state.6
Furthermore, two states with similar TEBTRs may vary in the manner in which they tax certain industries. For example, some states may levy relatively high taxes on capital-intensive manufacturers and relatively low taxes on labor-intensive service industries. When the state and local tax structure imposes disparate burdens by industry, economic decisions may be distorted due to disincentives facing highly taxed industries.
It is also important to note that the TEBTR is a measure of the average tax burden on existing businesses in a state rather than a measure of the marginal tax that would be borne by a company investing in a new facility. For this reason, the TEBTR provides one metric that can be used to evaluate a state’s business tax structure, but is not a clear indicator of the competitiveness of a state’s business tax system in terms of attracting new investment.
Table 5. Business taxes as a share of state, local, and total taxes and private
sector GSP, FY2013 ($billions)
State taxes Local taxes State and local taxes
Jurisdiction
Business Total Business Total Business Total % of GSP*Alabama $4.2 $9.7 $3.0 $5.4 $7.2 $15.1 4.5%
Alaska 5.1 5.3 0.8 1.7 5.9 7.1 12.0%
Arizona 5.8 13.9 6.2 9.8 12.0 23.7 5.1%
Arkansas 3.6 9.0 0.9 1.9 4.4 10.8 4.2%
California 48.4 139.6 36.0 69.0 84.3 208.6 4.5%
Colorado 4.4 12.2 7.6 12.8 12.0 25.0 4.8%
Connecticut 5.3 17.0 2.3 9.3 7.6 26.3 3.4%
Delaware 2.0 3.5 0.4 0.8 2.4 4.3 4.3%
Florida 17.6 36.9 19.9 33.4 37.5 70.3 5.5%
Georgia 6.2 18.7 8.1 14.9 14.3 33.6 3.7%
Hawaii 2.3 6.4 1.2 1.9 3.6 8.3 6.3%
Idaho 1.5 3.9 0.9 1.4 2.4 5.3 4.6%
Illinois 17.0 42.0 15.3 29.2 32.3 71.2 5.0%
Indiana 5.7 17.7 4.7 9.0 10.4 26.7 3.7%
Iowa 3.6 9.0 3.1 5.5 6.8 14.4 4.7%
Kansas 2.8 8.0 3.0 5.0 5.8 13.0 4.7%
Kentucky 4.7 11.3 2.5 4.7 7.2 16.0 4.7%
Louisiana 3.9 9.5 4.5 7.7 8.5 17.2 3.8%
Maine 1.3 4.1 1.6 2.3 3.0 6.4 6.4%
Maryland 6.8 19.2 3.4 13.9 10.2 33.1 3.8%
Massachusetts 9.1 25.8 6.4 13.9 15.6 39.7 4.0%
Michigan 9.3 27.0 5.1 12.8 14.4 39.7 3.8%
Minnesota 8.6 22.4 3.9 8.0 12.6 30.4 4.6%
Mississippi 3.2 7.7 2.3 3.0 5.5 10.6 6.4%
Missouri 3.8 11.8 4.6 9.2 8.5 21.0 3.5%
Montana 1.3 2.8 0.7 1.2 2.0 4.0 5.4%
Nebraska 1.9 4.9 2.1 3.8 4.0 8.7 4.3%
Nevada 4.0 7.6 2.2 4.0 6.2 11.6 5.4%
New Hampshire 1.5 2.6 1.0 2.9 2.6 5.5 4.4%
New Jersey 13.3 32.0 10.9 26.6 24.2 58.7 5.1%
New Mexico 3.1 5.4 1.5 2.4 4.6 7.8 6.6%
New York 25.8 76.9 40.6 80.6 66.4 157.5 5.8%
North Carolina 8.8 25.0 4.8 11.5 13.7 36.5 3.4%
North Dakota 3.9 5.4 0.8 1.3 4.7 6.7 9.9%
Ohio 11.7 28.7 8.7 22.3 20.4 51.1 4.1%
Oklahoma 4.4 9.5 2.5 4.5 7.0 14.0 4.7%
Oregon 3.1 10.2 3.1 6.1 6.2 16.3 3.3%
Pennsylvania 15.7 37.4 10.3 24.3 26.0 61.7 4.6%
Rhode Island 1.3 3.2 1.1 2.3 2.4 5.5 5.3%
South Carolina 3.1 9.1 4.0 6.1 7.2 15.2 4.8%
South Dakota 1.0 1.6 0.8 1.3 1.8 2.9 4.5%
Tennessee 7.1 13.1 4.3 8.4 11.4 21.5 4.6%
Texas 34.4 54.5 33.6 52.6 68.0 107.1 5.0%
Utah 2.3 6.7 2.2 3.8 4.5 10.5 3.7%
Vermont 1.5 3.0 0.3 0.4 1.8 3.5 7.4%
Virginia 5.6 20.0 8.2 14.7 13.8 34.7 3.8%
Washington 11.1 20.0 5.9 11.4 17.0 31.4 5.0%
West Virginia 2.4 5.6 1.2 1.6 3.6 7.2 6.0%
Wisconsin 6.5 17.8 4.5 10.2 11.0 28.0 4.5%
Wyoming 1.8 2.3 0.8 1.1 2.6 3.4 6.7%
District of Columbia 3.6 6.4 n/a n/a 3.6 6.4 4.8%
United States $366.7 $903.3 $304.1 $591.9 $670.8 $1,495.2 4.7% Note: Amounts may not sum due to rounding.
Lower TEBTR Higher TEBTR Hawaii
Alaska
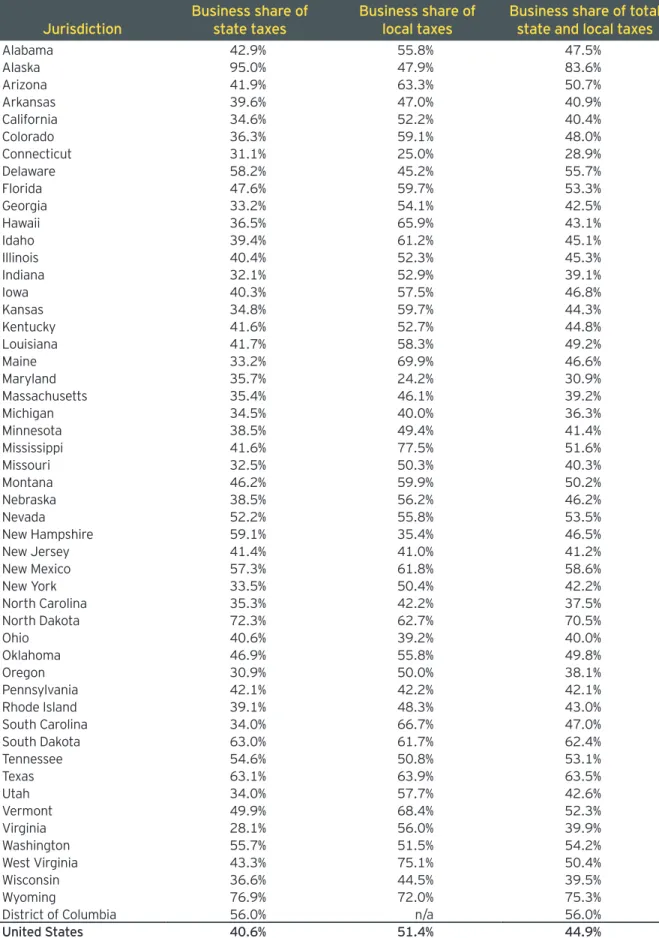
Table 6 summarizes the share of taxes paid by business in each state. Business taxes accounted for 44.9% of total state and local taxes in FY2013. Business taxes accounted for a smaller share of state taxes (40.6%) than local taxes (51.4%). The share of local taxes paid by business is higher than the state share because businesses pay 53% of local property taxes, which account for 74% of total (business and household) local tax collections, while state governments rely most heavily on the individual income tax, which is paid primarily by households.
The business share of total state and local taxes has remained relatively stable over the past decade, as shown in Appendix Table A-1. The business share has decreased from 45.7% in 2007 to 44.9% in 2013. The business share has been within 1 percentage point of 45% every year since 2003. Partially responsible for the modest drop in the business share is the increase in individual income tax collections. Though some individual income taxes are imposed on business income, the vast majority falls on households. Individual income taxes on non-business income accounted for 20.5% of total state and local business taxes in 2013. 2001 was the last year the non-business income tax share surpassed 20%.
A high share of total state and local taxes paid by business does not necessarily translate into a high effective business tax rate on economic activity. States without individual income taxes generally derive a larger share of their total tax revenue from business taxes, even though business taxes in these states may not be significantly higher than average. The business tax burden would not increase if household taxes were cut and no new taxes were imposed on businesses, but the business share of total taxes would increase. For instance, 63.5% of Texas taxes are paid by business compared to 44.9% nationwide (41.5% higher than average), but the TEBTR in Texas is 5.0% compared to the US average of 4.7% (only 7.8% higher than average). This suggests that while Texas collects a larger-than-average share of its taxes from business, its overall level of business taxes is relatively low.
A similar result occurs in Delaware, where 55.7% of taxes are paid by business (24.2% above average) but the TEBTR is 4.3%, (7.7% below average). In the case of Delaware, the high business share is largely attributable to the corporation license tax, which generates substantial revenue due to the significant number of businesses incorporated in Delaware.
Source: Ernst & Young LLP estimates based on data from the Bureau of Economic Analysis and the U.S. Census Bureau, state and local government finances.
Figure 3. Total effective business tax rate (TEBTR) by state, FY2013
(state and local business taxes divided by private sector gross state product in
each state)
Table 6. Business share of total state and local taxes, FY2013
Jurisdiction
Business share of
state taxes
Business share of
local taxes
Business share of total
state and local taxes
Alabama 42.9% 55.8% 47.5%
Alaska 95.0% 47.9% 83.6%
Arizona 41.9% 63.3% 50.7%
Arkansas 39.6% 47.0% 40.9%
California 34.6% 52.2% 40.4%
Colorado 36.3% 59.1% 48.0%
Connecticut 31.1% 25.0% 28.9%
Delaware 58.2% 45.2% 55.7%
Florida 47.6% 59.7% 53.3%
Georgia 33.2% 54.1% 42.5%
Hawaii 36.5% 65.9% 43.1%
Idaho 39.4% 61.2% 45.1%
Illinois 40.4% 52.3% 45.3%
Indiana 32.1% 52.9% 39.1%
Iowa 40.3% 57.5% 46.8%
Kansas 34.8% 59.7% 44.3%
Kentucky 41.6% 52.7% 44.8%
Louisiana 41.7% 58.3% 49.2%
Maine 33.2% 69.9% 46.6%
Maryland 35.7% 24.2% 30.9%
Massachusetts 35.4% 46.1% 39.2%
Michigan 34.5% 40.0% 36.3%
Minnesota 38.5% 49.4% 41.4%
Mississippi 41.6% 77.5% 51.6%
Missouri 32.5% 50.3% 40.3%
Montana 46.2% 59.9% 50.2%
Nebraska 38.5% 56.2% 46.2%
Nevada 52.2% 55.8% 53.5%
New Hampshire 59.1% 35.4% 46.5%
New Jersey 41.4% 41.0% 41.2%
New Mexico 57.3% 61.8% 58.6%
New York 33.5% 50.4% 42.2%
North Carolina 35.3% 42.2% 37.5%
North Dakota 72.3% 62.7% 70.5%
Ohio 40.6% 39.2% 40.0%
Oklahoma 46.9% 55.8% 49.8%
Oregon 30.9% 50.0% 38.1%
Pennsylvania 42.1% 42.2% 42.1%
Rhode Island 39.1% 48.3% 43.0%
South Carolina 34.0% 66.7% 47.0%
South Dakota 63.0% 61.7% 62.4%
Tennessee 54.6% 50.8% 53.1%
Texas 63.1% 63.9% 63.5%
Utah 34.0% 57.7% 42.6%
Vermont 49.9% 68.4% 52.3%
Virginia 28.1% 56.0% 39.9%
Washington 55.7% 51.5% 54.2%
West Virginia 43.3% 75.1% 50.4%
Wisconsin 36.6% 44.5% 39.5%
Wyoming 76.9% 72.0% 75.3%
District of Columbia 56.0% n/a 56.0%
Governmental benefits
received by businesses versus
taxes paid
In addition to the TEBTR, the business tax burden can be evaluated by comparing business taxes paid to benefits received by businesses due to government spending. Because government spending can reduce businesses’ non-tax costs, if two businesses pay the same amount of taxes but one receives larger benefits from government spending, the true burden of taxes is not the same for both businesses. Calculating the business tax-to-benefit ratio estimates the extent to which businesses are “getting what they paid for” from their tax dollars. Figure 4 shows total estimated state and local spending by category (net of user charges and other non-tax revenue) for FY2013. Using a methodology developed by economists at the Federal Reserve Bank of Chicago, expenditures in the major categories shown in Figure 4 were allocated between households and businesses to reflect the extent to which each group
benefits from each type of expenditure.7
Certain expenditures, such as health and human services, were assigned entirely to households while other categories, such as police, fire, and highway infrastructure costs, were split evenly between businesses and households. The tax-benefit ratio was calculated by dividing business taxes in each state by estimated government expenditures benefitting business. Since education spending is by far the largest category of net state and local expenditures, estimates of the tax-benefit ratio for businesses are sensitive to the allocation of education expenditures between businesses and households. While economic theory suggests that individuals are the primary beneficiaries of education due to higher wages, business owners can benefit if an educated workforce generates higher returns to capital.
Returns to capital would increase if workers do not completely capture productivity gains through higher wages or an educated workforce improves the productivity of capital (e.g., an educated or trained worker may know how to use machines in production more efficiently, resulting in fewer breakdowns or work stoppages). A review of the literature finds that a 1% increase in the share of workers with a college education in a city increases output by 0.5 to 0.6 percentage points.8 If
businesses are able to capture some or all of the additional productivity from increased education, they are deriving benefits from this type of government spending. Education can increase profits through indirect channels as well. For example, increasing education may reduce property crime, lowering business costs and increasing the return to capital. One estimate of the social returns of an educated workforce is that social benefits, in the form of lower government spending for police services and incarceration costs, are equal to 14% to 26% of the private return of education (higher wages) that accrues to individuals.9
Since the benefit of education to households and businesses is unknown, and the tax-benefit ratio is sensitive to this assumption, this analysis presents a range of estimates for the share of educational expenditures that benefit local business. The ratio is estimated assuming 0%, 25% and 50% of education spending benefits businesses.10
Calculating tax to benefit ratios using net government spending can yield different results than using gross spending. Net government spending subtracts non-tax revenue and estimates non-tax-funded state and local government spending. While taxes are the largest source of state and local government revenue, over 60% of total revenue was derived from other sources in 2011, the last year for which complete state and local government finances data from the U.S. Census Bureau is available. A state could maintain the same level of business taxation and gross spending from one year to the next, but its tax to benefit ratio would still differ if its level of non-tax revenue changed.
Figure 5 and Table 7 summarize the results using the three educational share assumptions for FY 2013. Assuming that education spending does not directly benefit local business, the ratio of business taxes paid to government services received by business is 3.3, indicating that businesses are taxed $3.26 per dollar of government services they receive (i.e., a ratio of 3.3 to 1). The ratio drops to 1.8 when one-quarter of education spending is assumed to benefit business and 1.2 when half of education spending is assumed to benefit local business. Under these three educational assumptions, the business share of total net state and local government expenditures is 17% with zero educational benefit, 32% with one-quarter of
educational spending benefitting businesses, and 47% if half of educational expenditures are assumed to benefit business.
Alaska, North Dakota and Wyoming have the highest tax-benefit ratios due in large part to the states’ reliance on severance taxes. In these states, the ratio of business taxes to expenditures benefitting local businesses averages 8.6, assuming education benefits households only. Fourteen additional states have tax-benefit ratios above 4.0, assuming educational expenditures do not benefit business. Every other state has a ratio between 2.1 and 4.0, meaning that under the assumption that all education benefits accrue to households, businesses pay at least twice as much in state and local taxes as they receive in tax-funded benefits from state and local governments.
If educational expenditures are split between households and businesses, the tax-benefit ratios are fairly similar across states, with all states except Alaska and North Dakota having tax-benefit ratios between 0.8 and 1.7. While Wyoming’s tax-to-benefit ratio under the 50% assumption was previously closer to Alaska and North Dakota, recent increases in state education spending reduced its ratio so that it now falls more in line with the other states.
Figure 4. Net state and local government expenditures
11-7%
54%
20%
14%
8% 7%
4%
-20% -10% 0% 10% 20% 30% 40% 50% 60%
Administrative
Table 7. Business taxes per dollar of government expenditures benefitting businesses,
FY2013 ($billions)
0% of education spending
benefitting business 25% of education spending benefitting business 50% of education spending benefitting business
Jurisdiction State and local business taxes
Total state and local spending
benefitting
business Tax-benefit ratio (taxes/benefits)
Total state and local spending
benefitting
business Tax-benefit ratio (taxes/benefits)
Total state and local spending
benefitting
business Tax-benefit ratio (taxes/benefits)
Alabama $7.2 $2.0 3.6 $4.0 1.8 $6.0 1.2
Alaska 5.9 0.5 11.6 0.9 6.2 1.4 4.3
Arizona 12.0 3.6 3.4 5.8 2.1 8.1 1.5
Arkansas 4.4 0.9 4.9 2.5 1.7 4.2 1.1
California 84.3 36.6 2.3 62.1 1.4 87.5 1.0
Colorado 12.0 4.0 3.0 6.2 2.0 8.4 1.4
Connecticut 7.6 2.8 2.7 5.9 1.3 9.0 0.8
Delaware 2.4 0.5 5.2 1.0 2.4 1.5 1.6
Florida 37.5 14.2 2.6 21.2 1.8 28.3 1.3
Georgia 14.3 4.1 3.5 9.0 1.6 13.8 1.0
Hawaii 3.6 0.6 5.5 1.4 2.5 2.2 1.6
Idaho 2.4 0.8 3.1 1.3 1.8 1.9 1.3
Illinois 32.3 11.5 2.8 20.6 1.6 29.7 1.1
Indiana 10.4 2.9 3.6 6.0 1.7 9.1 1.1
Iowa 6.8 1.8 3.8 3.6 1.9 5.5 1.2
Kansas 5.8 1.5 3.9 3.0 1.9 4.5 1.3
Kentucky 7.2 2.1 3.4 4.3 1.7 6.4 1.1
Louisiana 8.5 3.1 2.7 5.6 1.5 8.0 1.1
Maine 3.0 0.7 4.1 1.4 2.1 2.1 1.4
Maryland 10.2 4.8 2.1 8.9 1.2 12.9 0.8
Massachusetts 15.6 3.8 4.1 8.3 1.9 12.8 1.2
Michigan 14.4 4.3 3.4 8.9 1.6 13.5 1.1
Minnesota 12.6 3.9 3.2 6.9 1.8 10.0 1.3
Mississippi 5.5 1.0 5.5 2.5 2.2 3.9 1.4
Missouri 8.5 2.9 2.9 5.4 1.6 7.9 1.1
Montana 2.0 0.5 3.9 0.9 2.1 1.3 1.5
Nebraska 4.0 1.2 3.2 2.4 1.7 3.6 1.1
Nevada 6.2 2.4 2.5 3.7 1.7 4.9 1.3
New Hampshire 2.6 0.5 4.8 1.3 2.0 2.0 1.3
New Jersey 24.2 6.3 3.8 14.1 1.7 21.8 1.1
New Mexico 4.6 1.2 3.8 2.3 2.0 3.4 1.3
New York 66.4 19.6 3.4 38.1 1.7 56.6 1.2
North Carolina 13.7 4.5 3.0 8.7 1.6 13.0 1.1
North Dakota 4.7 0.6 7.4 1.1 4.5 1.5 3.2
Ohio 20.4 6.1 3.4 11.8 1.7 17.5 1.2
Oklahoma 7.0 1.4 4.9 2.8 2.5 4.2 1.7
Oregon 6.2 1.8 3.5 3.1 2.0 4.4 1.4
Pennsylvania 26.0 8.0 3.3 14.5 1.8 21.0 1.2
Rhode Island 2.4 0.6 4.1 1.2 2.0 1.7 1.4
South Carolina 7.2 1.5 4.7 3.4 2.1 5.3 1.3
South Dakota 1.8 0.5 4.0 0.8 2.3 1.1 1.6
Tennessee 11.4 2.8 4.0 5.0 2.3 7.3 1.6
Texas 68.0 13.1 5.2 28.0 2.4 42.8 1.6
Utah 4.5 1.6 2.7 2.9 1.5 4.2 1.1
Vermont 1.8 0.4 4.8 0.8 2.3 1.2 1.5
Virginia 13.8 5.0 2.8 9.1 1.5 13.3 1.0
Washington 17.0 5.1 3.3 8.6 2.0 12.2 1.4
West Virginia 3.6 0.6 5.7 1.6 2.2 2.6 1.4
Wisconsin 11.0 3.8 2.9 7.1 1.6 10.3 1.1
Wyoming 2.6 0.4 6.7 0.9 2.8 1.5 1.7
District of Columbia 3.6 0.9 3.8 1.7 2.2 2.4 1.5
United States $670.8 $205.4 3.26 $382.5 1.75 $559.6 1.20
Note: Figures may not sum due to rounding.
1.1 0.8 1.05 1.0 1.1 1.1 1.1 1.4 1.1 1.3
1.1 1.3 1.2 1.4 1.1 1.2
1.5 1.2 1.1 1.0 1.4
1.1 1.2 1.3 1.5 1.1 1.2
1.5 1.3 1.6
1.6 1.4 1.4 1.2 1.3
1.5 1.3 1.7 1.1 1.6
1.6 1.4 1.6 1.4 1.7
3.2 4.3 1.2
2.7 2.7 2.7 2.8 2.8 2.9
2.9 3.0 3.0 3.1 3.2 3.2 3.3 3.3 3.4 3.4 3.4 3.4 3.4 3.5
3.5 3.6 3.6 3.8
3.8 3.8 3.8 3.9 3.9 4.0
4.0 4.1 4.1 4.1
4.7 4.8 4.8 4.9
4.9 5.2 5.2 5.5
5.5 5.7
6.7 7.4
11.6 3.3 Louisiana ConnecticutUtah VirginiaIllinois Missouri Wisconsin Colorado North Carolina Idaho Nebraska Minnesota Pennsylvania Washington MichiganOhio Arizona New York KentuckyGeorgia OregonIndiana Alabama New Mexico District of ColumbiaNew Jersey Iowa Montana Kansas South Dakota Tennessee Rhode Island Maine Massachusetts South CarolinaVermont New HampshireOklahoma ArkansasTexas Delaware Mississippi Hawaii West Virginia Wyoming North Dakota Alaska United States
With 50% of educational expenses allocated to business With 0% of educational expenses allocated to business
Figure 5. Business taxes per dollar of net government spending that benefits businesses, FY2013
(values shown are equal to business taxes divided by government spending that benefits businesses)
Source: Ernst & Young LLP estimates based on data from the U.S. Census Bureau, state and local government finances and the National Association of State Budget Officers.
The long recovery
Each year since the recession, this study has examined the level of business tax collections compared with pre-recession highs. In FY2011, state and local business taxes rebounded to $625.7 billion, surpassing the prior peak of aggregate state and local business taxes of $615 billion in 2008.12 This trend continued in FY2012and FY2013, which both saw increases in business tax collections. The aggregate tax collection data, however, obscure the continued difficulty in some states where revenues have not yet recovered from the downturn. Table 8 shows that in FY2013, 12 states (24% of states and the District of Columbia) had not rebounded to the level of overall state and local business tax collections reached prior to, or just after, the start of the last recession. The most notable of these states is Alaska, which experienced a precipitous drop in business tax revenue due to declining severance taxes in FY2012 and FY2013 and is the only state with FY2013 tax collections less than 75% of the highs reached in FY2008.
In 28 of the 47 (60%) states levying some form of corporate income tax, FY2013 corporate income tax collections were still below their prior peak, generally reached in FY2007. In 14 of these states (30%), corporate income tax collections were still 25% or more below their pre-recession peak by the end of FY2013. For example, California’s corporate income tax collections peaked at $11.8 billion in FY2008 but totaled $7.5 billion in FY2013. In Alaska and Louisiana, which both derive significant corporate income tax revenue from the oil and gas industry, corporate income tax collections in FY2013 were less than half of their peak level in FY2008.
Table 8 also shows that while just over half of states collected property taxes that exceeded the peak level of revenue reached in the last decade, the outcome for revenue sources other than corporate income, sales, and property tax was more positive, with more than 80% of states exceeding their prior peaks. In fact, 29% of states exceeded the peak level of collections for these other sources of revenue achieved prior to 2009 by at least 25%.
Table 8. Percentage of states that have recovered to pre-recession peak state and local business tax
levels, by tax type* (% of states and the District of Columbia achieving business tax revenue growth
compared to prior peak)
Not recovered prior peak revenue
Recovered prior peak revenue
FY2013 wasbelow peak revenue by 25%
or more
FY2013 was 0%-25% below
peak revenue
Subtotal: FY2013 total was below peak
revenue
FY2013 was 0%-25% above
peak revenue
FY2013 was more than 25%
above peak revenue
Subtotal: FY2013 total was above peak
revenue
Corporate income tax 30% 30% 60% 34% 6% 40%
Sales tax 2% 30% 33% 46% 22% 67%
Property tax 4% 41% 45% 53% 2% 55%
Other taxes 2% 16% 18% 53% 29% 82%
Total business taxes 2% 22% 24% 69% 8% 76%
*Note: Pre-recession peak revenue is defined as peak revenue occurring in FY2007 to FY2009. The peak year for each tax type and each state may have occurred in a different year. Amounts may not sum due to rounding.
The outlook for FY2014
business taxes
Quarterly tax collections since the end of FY2013 have indicated continued growth in state and local tax revenues. For the first three quarters of FY2014, overall sales tax collections were up 6.2% compared with the same period in the prior fiscal year, while overall property tax collections increased 3.5%. Income taxes in the first three quarters of FY2014 have grown more slowly, with corporate income tax collections growing at 2.8% and individual income tax collections growing at 1.5%. Given continued growth in state and local tax bases, many states adopted reductions in business taxes in 2013 and 2014 designed to encourage economic development, particularly among small businesses.
One of the key drivers for state business tax revenue in FY2013 was individual income taxes on pass-through business income, which increased by more than 13% during the year. In the past two years, a number of business tax changes have been adopted that would reduce the level of individual income taxes on pass-through business income, many targeted toward small businesses that frequently organize as pass-through entities. Kansas adopted a provision that exempts business income from pass-through entities, Ohio adopted a $250,000 exemption for pass-through business income, and Missouri passed a 25% subtraction for pass-through business income. These changes are expected to reduce individual income taxes on pass-through income by more than $1 billion over the coming fiscal year.
As the largest share of total state and local business taxes, the growth of business property taxes in FY2014 has the potential to shape the overall increase in state and local business taxes. In 2014, several states enacted changes to the business property tax to increase their competitiveness and attract new business investment. Specifically, Idaho enacted a $100,000 exemption for business equipment, Michigan adopted a 10-year phase-out of business personal property tax for qualified property and Iowa reduced business property taxes by 10% through credits
Conclusion
State and local business taxes in FY2013 continued their long recovery,
despite challenges in several states. While all but 12 states have recovered to
their prior peaks of tax revenue collected before the last recession, 28 states
are still collecting less corporate income tax revenue than their peak year
near the start of the recession. The results of this analysis for FY2013 also
point to the significance of individual income taxes on business income, which
account for more tax revenue than corporate income taxes in 13 states.
Despite these shifts in the composition of state and local business taxes in
FY2013, business property tax and sales tax on business inputs remain the
largest components of total state and local business taxes. The continued
significance of these non-income taxes is a reminder that the tax contribution
of businesses encompasses far more than the corporate income taxes that
are most frequently considered as part of a business’s tax contribution.
Appendix
ot
al s
tat
e and loc
al busine
ss t
ax
es
, 2000-2013 ($billions
)
al t
ax
es
2000
2001
2002
2003
2004
2005
2006
2007
2008
2009
2010
2011
2012
2013
ax es $386.0 $399.1 $405.3 $427.8 $463.8 $505.7 $548.2 $602.2 $615.0 $593.7 $592.1 $625.7 $643.4 $670.8 ome t ax es on ome 192.9 206.0 184.5 182.0 193.9 215.4 240.7 261.4 274.1 243.3 234.6 256.5 279.5 306.1 313.7 324.3 336.2 356.5 383.6 408.9 453.2 455.5 473.0 472.3 480.6 499.0 502.3 518.3 al t ax es $892.6 $929.4 $926.1 $966.2 $1,041.2 $1,130.0 $1,242.1 $1,319.1 $1,362.1 $1,309.3 $1,307.3 $1,381.2 $1,425.1 $1,495.2f s
tat
e and
ax
es
2000
2001
2002
2003
2004
2005
2006
2007
2008
2009
2010
2011
2012
2013
ax es 43.2% 42.9% 43.8% 44.3% 44.5% 44.8% 44.1% 45.7% 45.2% 45.3% 45.3% 45.3% 45.15% 44.9% ome t ax es on ome 21.6% 22.2% 19.9% 18.8% 18.6% 19.1% 19.4% 19.8% 20.1% 18.6% 17.9% 18.6% 19.6% 20.5% 35.1% 34.9% 36.3% 36.9% 36.8% 36.2% 36.5% 34.5% 34.7% 36.1% 36.8% 36.1% 35.2% 34.7% al t ax es 100% 100% 100% 100% 100% 100% 100% 100% 100% 100% 100% 100% 100% 100.0% y not sum due t
o r
ounding.
oung LLP e
stimat
es b
as
ed on dat
a fr
om the U
.S . C ensus B ur eau, s tat
e and loc
al go vernmen t financ es .
ompo
sition o
f s
tat
e and loc
al busine
ss t
ax
es
, 2000-2013 ($billions
)
ax
2000
2001
2002
2003
2004
2005
2006
2007
2008
2009
2010
2011
2012
2013
ty $136.8 $142.6 $152.9 $160.9 $169.7 $176.6 $187.9 $217.7 $221.9 $228.8 $230.4 $232.5 $233.5 $242.1 e 94.4 97.6 97.9 100.9 107.3 115.2 123.8 132.0 134.2 127.7 126.0 132.3 135.8 139.8 ome 36.4 35.8 28.5 31.9 34.1 43.1 53.3 61.0 57.7 46.8 44.5 48.7 49.1 53.3 t c omp . 20.9 20.8 21.0 23.9 31.9 35.5 36.4 35.8 32.5 31.4 32.4 41.2 48.4 50.8 e t ax 14.8 15.0 17.0 16.8 18.9 29.5 32.9 34.0 36.3 35.6 34.6 35.6 34.7 36.3 20.1 20.2 20.8 21.9 23.4 23.9 25.1 28.5 29.6 28.4 30.0 35.0 35.7 38.2 ax 17.7 17.9 20.3 21.2 21.3 22.6 23.6 27.1 28.1 28.6 28.4 28.7 27.2 26.6 ax 18.7 20.0 18.3 18.4 21.3 25.6 28.0 28.9 30.8 27.7 26.7 29.0 32.3 36.6 es 4.4 6.4 4.2 5.3 6.4 8.2 10.7 11.1 17.9 13.5 11.4 13.8 17.4 16.6 9.8 10.3 11.2 12.6 14.0 14.9 15.6 16.1 16.5 15.7 16.5 17.1 17.3 18.1 ax es 12.1 12.5 13.2 14.2 15.5 10.7 10.9 10.0 9.6 9.3 11.1 11.7 12.1 12.5 ax es $386.0 $399.1 $405.3 $427.8 $463.8 $505.7 $548.2 $602.2 $615.0 $593.7 $592.1 $625.7 $643.4 $670.8 y not sum due t
o r
ounding.
oung LLP e
stimat
es b
as
ed on dat
a fr
om the U
.S . C ensus B ur eau, s tat
e and loc
al go
vernmen
t financ
es
Table A-3 Composition of state and local business taxes, by type, FY2013
Jurisdiction Property tax Sales tax Excise tax income taxCorporate
Unemploy-ment insurance tax
Individual income tax on
pass-through
income other taxes*License and Total business taxes
Alabama 27.0% 21.1% 22.4% 5.3% 6.4% 5.3% 12.6% 100.0%
Alaska 14.2% — 2.0% 10.7% 3.6% — 69.4% 100.0%
Arizona 43.2% 32.9% 8.4% 5.5% 3.6% 2.7% 3.7% 100.0%
Arkansas 22.8% 34.2% 10.5% 9.1% 9.0% 6.9% 7.6% 100.0%
California 33.0% 19.9% 12.8% 8.8% 7.6% 8.4% 9.3% 100.0%
Colorado 47.3% 20.1% 8.3% 5.4% 8.2% 5.4% 5.3% 100.0%
Connecticut 30.0% 19.0% 16.5% 7.5% 11.4% 11.5% 4.1% 100.0%
Delaware 13.7% — 10.2% 13.2% 5.2% 5.8% 52.0% 100.0%
Florida 41.6% 21.3% 19.8% 5.5% 6.1% — 5.7% 100.0%
Georgia 40.6% 28.5% 9.1% 5.6% 6.1% 6.0% 4.2% 100.0%
Hawaii 26.3% 29.7% 20.9% 3.5% 9.4% 4.5% 5.7% 100.0%
Idaho 34.0% 18.0% 9.0% 8.4% 13.5% 8.9% 8.2% 100.0%
Illinois 39.8% 11.8% 14.6% 13.8% 10.3% 4.8% 4.9% 100.0%
Indiana 41.8% 21.0% 12.7% 7.5% 7.5% 6.9% 2.5% 100.0%
Iowa 39.9% 23.9% 4.4% 6.3% 9.0% 10.4% 6.0% 100.0%
Kansas 42.4% 27.2% 8.7% 6.7% 7.2% 3.8% 4.0% 100.0%
Kentucky 27.2% 19.8% 19.3% 10.6% 7.3% 7.3% 8.5% 100.0%
Louisiana 32.0% 30.8% 11.6% 3.0% 2.9% 5.2% 14.5% 100.0%
Maine 55.3% 12.7% 9.6% 5.8% 5.9% 5.3% 5.5% 100.0%
Maryland 22.4% 16.9% 20.6% 9.3% 10.5% 11.5% 8.8% 100.0%
Massachusetts 39.7% 16.1% 6.8% 12.1% 12.3% 7.6% 5.2% 100.0%
Michigan 39.2% 21.1% 9.9% 6.2% 13.0% 4.9% 5.7% 100.0%
Minnesota 32.3% 19.1% 12.7% 10.8% 11.0% 8.2% 5.8% 100.0%
Mississippi 37.9% 21.6% 13.9% 7.6% 5.0% 5.0% 9.1% 100.0%
Missouri 37.9% 25.3% 7.9% 5.3% 7.9% 7.5% 8.2% 100.0%
Montana 42.0% — 11.3% 8.6% 8.1% 7.2% 22.8% 100.0%
Nebraska 43.7% 21.8% 7.4% 6.9% 4.5% 10.6% 5.2% 100.0%
Nevada 25.2% 30.3% 14.5% — 8.7% — 21.4% 100.0%
New Hampshire 45.1% — 16.3% 21.6% 8.3% 0.4% 8.3% 100.0%
New Jersey 44.2% 15.6% 8.7% 9.4% 12.2% 4.9% 4.9% 100.0%
New Mexico 16.9% 42.9% 7.9% 5.9% 4.8% 3.0% 18.7% 100.0%
New York 38.1% 15.7% 10.8% 17.3% 4.9% 8.9% 4.3% 100.0%
North Carolina 27.7% 22.5% 14.9% 9.4% 9.1% 7.8% 8.5% 100.0%
North Dakota 14.6% 15.5% 5.4% 4.8% 2.2% 3.1% 54.6% 100.0%
Ohio 31.1% 21.5% 13.1% 4.6% 6.9% 7.8% 15.0% 100.0%
Oklahoma 19.5% 29.8% 10.7% 8.4% 8.2% 7.9% 15.5% 100.0%
Oregon 39.6% — 13.5% 8.2% 16.7% 9.4% 12.5% 100.0%
Pennsylvania 31.4% 15.5% 13.6% 9.7% 13.1% 6.7% 10.0% 100.0%
Rhode Island 46.1% 14.1% 14.3% 6.1% 11.3% 4.1% 4.2% 100.0%
South Carolina 46.5% 19.2% 9.9% 5.4% 5.9% 3.9% 9.2% 100.0%
South Dakota 32.2% 42.7% 9.9% 2.0% 2.5% — 10.6% 100.0%
Tennessee 26.2% 30.8% 12.7% 11.0% 6.4% 0.4% 12.5% 100.0%
Texas 41.2% 27.3% 11.1% — 4.0% — 16.4% 100.0%
Utah 37.4% 21.3% 12.6% 7.4% 8.0% 6.5% 6.7% 100.0%
Vermont 53.2% 10.0% 16.4% 5.8% 7.8% 3.9% 3.0% 100.0%
Virginia 43.6% 14.0% 14.7% 5.6% 5.7% 6.1% 10.3% 100.0%
Washington 24.7% 46.0% 14.4% — 7.8% — 7.1% 100.0%
West Virginia 27.6% 13.6% 20.0% 6.7% 6.2% 4.5% 21.4% 100.0%
Wisconsin 39.2% 17.8% 10.5% 8.7% 11.2% 6.1% 6.5% 100.0%
Wyoming 34.1% 20.4% 3.0% — 5.5% — 37.0% 100.0%
District of Columbia 48.4% 11.2% 11.9% 12.7% 4.6% 7.8% 3.4% 100.0%
United States 36.1% 20.8% 12.3% 7.9% 7.6% 5.5% 9.7% 100.0%
Note: Figures may not sum due to rounding. “--” indicates 0; “0.0%” indicates less than 0.05%.
*Taxes categorized under ”other” include death and gift taxes, documentary and stock transfer taxes, severance taxes and local gross receipts taxes. Source: Ernst & Young LLP estimates based on data from the U.S. Census Bureau, state and local government finances.
Endnotes
1. States that follow a different fiscal year are Alabama (ends September 30), Michigan (ends September 30), New York (ends March 31) and Texas (ends August 31). Data presented in this study are for each state’s fiscal year.
2. The general methodology used to estimate state and local business taxes is described in detail in the Appendix to the Ernst & Young LLP/COST FY2005 50-State Business Tax study published in March 2006 (available at www.cost.org). Note that business tax estimates for prior years have been revised from those published in earlier editions of this study due to the use of newly released U.S. Census Bureau data, and refinements to the estimation of individual income taxes. All references to business taxes in prior fiscal years refer to the updated estimates included in this study, rather than the previously published estimates.
3. Robert Cline, Andrew Phillips and Tom Neubig, What’s Wrong with Taxing Business Services? Adverse Effects from Existing and Proposed Sales Taxation of Business Investment and Services, prepared for the Council on State Taxation, April 4, 2013. 4. Note that this applies to the taxation of business income only, not gross receipts. This group of states includes Colorado,
Connecticut, Georgia, Hawaii, Idaho, Iowa, Louisiana, Maryland, Missouri, Nebraska, Ohio, Oregon and Virginia.
5. For an analysis of the incidence of state and local taxes on business, see Robert Cline, Andrew Phillips, Joo Mi Kim and Tom
Neubig, “The Economic Incidence of Additional State Business Taxes,” State Tax Notes, Tax Analysts, January 11, 2010.
6. Robert Cline, Andrew Phillips, Joo Mi Kim and Tom Neubig, The Economic Incidence of Additional State Business Taxes,
State Tax Notes, January 11, 2010
7. Richard H. Mattoon and William A. Testa, How Closely Do Business Taxes Conform to the Benefits Principle? presentation at the Future State Business Tax Reforms: Perspectives from the Business, Government and Academic Communities conference, Federal Reserve Bank of Chicago (September 17, 2007). The authors distributed state and local government expenditures between businesses and households. Services benefitting business include shares of expenditures for transportation, water and sewer infrastructure, police and fire protection, general government “overhead” (e.g., legislative, administrative and judicial services), interest and regulatory activities. The methodology used is described in detail in
William H. Oakland and William A. Testa, “State-Local Business Taxation and the Benefits Principle,” Economic Perspectives
(January/February 1996). The authors also note that selective excise taxes, such as the severance tax, impact a small portion of businesses and could be removed from the business tax numerator to provide a measure of the tax to benefit ratio generally applicable to most firms. EY added in expenditure categories to the analysis not included in the 2007 data. 8. Evidence is reviewed in Enrico Moretti, “Workers’ Education, Spillovers, and Productivity: Evidence from Plant-Level
Production Functions,” The American Economic Review, June 2004.
9. An example of work related to the social benefits of education is Lance Lochner and Enrico Moretti, “The Effect of Education
on Crime: Evidence from Prison Inmates, Arrests, and Self-Reports,” NBER Working Paper 8605, November 2001.
10. The tax-benefit ratios shown in this study were constructed in the following way. Ernst & Young LLP followed the general methodology used by Richard H. Mattoon and William A. Testa that allocates expenditures net of user charges and federal transfers to businesses and households. Like Mattoon and Testa, Ernst & Young LLP identified major categories of state and local spending. Using data from the U.S. Census Bureau’s 2011 State and Local Government Finances, expenditures, charges, federal transfers, and other category-specific non-tax revenue were assigned to each category. These items were used to calculate the net expenditures for each category. The net expenditures were then allocated to businesses and households in an identical manner to the Rick Mattoon, William A. Testa allocation for all categories included in their analysis. For new categories, Ernst & Young LLP followed Mattoon and Testa’s general principles in allocating net expenditures. Using data from the National Association of State Budget Officers’ State Expenditure Report (2013), the 2011 amounts were adjusted to 2013 using the All Funds growth rate. For the District of Columbia, Ernst & Young LLP used data from the Statistical Section of the District of Columbia’s 2013 Comprehensive Annual Financial Report to grow state and local net expenditures.
11. Administrative and insurance share is negative because non-tax revenue from investments, interest, and other sources exceed total outlays.
EY | Assurance | Tax | Transactions | Advisory
About EY
EY is a global leader in assurance, tax, transaction and advisory services. The insights and quality services we deliver help build trust and confidence in the capital markets and in economies the world over. We develop outstanding leaders who team to deliver on our promises to all of our stakeholders. In so doing, we play a critical role in building a better working world for our people, for our clients and for our communities.
EY refers to the global organization, and may refer to one or more, of the member firms of Ernst & Young Global Limited, each of which is a separate legal entity. Ernst & Young Global Limited, a UK company limited by guarantee, does not provide services to clients. For more information about our organization, please visit ey.com.
Ernst & Young LLP is a client-serving member firm of Ernst & Young Global Limited operating in the US.
Quantitative Economics and Statistics (QUEST) QUEST is a group of economists, statisticians, survey specialists and tax policy analysts within Ernst & Young LLP’s National Tax Practice, located in Washington, DC. QUEST provides quantitative advisory services to private and public sector clients including tax policy economic studies, statistical sampling, and surveys.
© 2014 Ernst & Young LLP. All Rights Reserved.
SCORE No. YY3372 1407-1293640 ED None