HIV-Specific T Cell Responses Are Highly
Stable on Antiretroviral Therapy
Yinyan Xu,
1Ilana M. Trumble,
2Joanna A. Warren,
1Genevieve Clutton,
1Maria Abad-Fernandez,
1Jennifer Kirchnerr,
3Adaora A. Adimora,
3,4Steven G. Deeks,
5David M. Margolis,
3JoAnn D. Kuruc,
3Cynthia L. Gay,
3Nancie M. Archin,
3Katie R. Mollan,
4,6Michael Hudgens,
2and Nilu Goonetilleke
1,31Department of Microbiology & Immunology, UNC Chapel Hill School of Medicine, Chapel Hill, NC 27599, USA;2Department of Biostatistics, UNC Chapel Hill, Chapel Hill, NC 27516, USA;3School of Medicine and UNC HIV Cure Center, UNC Chapel Hill School of Medicine, Chapel Hill, NC 27599, USA;4Department of Epidemiology, UNC Gillings School of Global Public Health, University of North Carolina at Chapel Hill, Chapel Hill, NC 27599, USA;5Department of Medicine, University of California San Francisco, San Francisco, CA 94143, USA;6Lineberger Comprehensive Care Center, UNC Chapel Hill, Chapel Hill, NC 27599, USA
HIV infection induces a robust T cell response that is sustained by high viremia, but falls following the onset of antiretroviral therapy (ART). Relatively little has been reported on the subse-quent stability of the HIV-specific T cell response in individuals on durable therapy. Such data are critical for powering clinical trials testing T cell-based immunotherapies. In a cross-sectional study, HIV-specific T cell responses were detectable byex vivointerferon (IFN)-gELISpot (average1,100 spot-forming units [SFUs]/106peripheral blood mononuclear cells) in persons living with HIV (PLWH; n = 34), despite median durable ART suppression of 5.0 years. No substantial associa-tion was detected between the summed HIV-specific T cell response and the size of the replication-competent HIV reser-voir. T cell responses were next measured in participants sampled weekly, monthly, or yearly. HIV-specific T cell re-sponses were highly stable over the time periods examined; within-individual variation ranged from 16% coefficient of variation (CV) for weekly to 27% CV for yearly sampling. These data were used to generate power calculations for future immu-notherapy studies. The stability of the HIV-specific T cell response in suppressed PLWH will enable powered studies of small sizes (e.g., n = 6–12), facilitating rapid and iterative testing for T cell-based immunotherapies against HIV.
INTRODUCTION
To date, over 18.5 million people receive combination antiretroviral therapy (ART) to control HIV viremia and limit or restore CD4 T cell depletion. ART is life-long; interruption of therapy results in viral rebound within weeks for most individuals.1,2The success of ART against HIV has been an outstanding medical achievement saving many millions of lives. Effective HIV treatment does not ameliorate the clinical impact of ongoing immune activation, increased risk of cardiovascular disease and malignancies, and toxicity caused by ART. Nor does ART lessen the impact of HIV stigma on persons living with HIV (PLWH). Lifelong ART also has significant societal health costs, with the estimated lifetime costs for HIV-related treatment for one individual estimated at $370,000.3 HIV cure, whether complete eradication of the replication-competent
HIV reservoir or induction of ART-free remission, therefore remains the ultimate goal for both HIV+individuals and researchers.
The induction of HIV-specific CD8+T cells is likely to be an important component of both eradication and remission-focused cure strategies. HIV-specific CD8+T cell responses are detectable in all HIV-infected, untreated individuals.4,5Although CD8+T cells are broadly critical to HIV host immunity, they are more effective in some individuals than others.6In viremic individuals, the HIV-specific CD8+T cell response is dynamic, with new T cell responses emerging as others decline in response to viral escape.7,8As infection proceeds, chronic antigenic drive also leads to loss of functionality and immune exhaustion.9 Current ART regimens decrease HIV levels from >105–107 to <200 copies/mL in the majority of individuals within 6 months, concomitant with a recovery of CD4 T cell levels in the blood.10Multiple groups have reported that HIV-specific T cell responses remain detectableex vivoin individuals on durable virus suppression; however, there are very limited longitudinal data describing the HIV-specific T cell response in long-term ART-suppressed individuals.11–15
In this study, we investigated the strength, targeting, and maintenance of the HIV-specific T cell response. We show HIV-specific T cell re-sponses are maintained at relatively high frequencies and are stable over weeks, months, and years. These data are consistent with ongoing antigen presentation to CD8+T cells by HIV-infected cells during durable suppression and facilitate more accurate powering of T cell immunotherapy studies.
RESULTS Study Cohorts
All participants were adults (R18 years of age) with documented HIV infection. For cross-sectional and weekly and monthly longitudinal
Received 20 June 2019; accepted 26 July 2019; https://doi.org/10.1016/j.omtm.2019.07.008.
Correspondence:Nilu Goonetilleke, Department of Microbiology & Immunology, UNC Chapel Hill School of Medicine, Chapel Hill, NC 27599, USA.
studies, samples came from participants enrolled at the University of North Carolina at Chapel Hill. For the yearly longitudinal study, sam-ples were obtained from participants enrolled at the University of California, San Francisco (UCSF), through the Observational Study of the Consequences of the Protease Inhibitor Era (SCOPE) cohort. Tables 1and2summarize basic demographic and clinically impor-tant details relative to the cohorts. Institutional review board (IRB) approvals are detailed in theMaterials and Methods.
HIV-Specific T Cell Responses in HIV-Seropositive Durably Suppressed Individuals Remain Detectable and Do Not Correlate Strongly with Pre-ART CD4 Nadir or the Replication-Competent Reservoir
A cross-sectional analysis of HIV-specific T cell responses measured by ex vivo interferon (IFN)-g enzyme-linked immune absorbent spot (ELISpot) was performed in HIV+ART+ partici-pants (n = 34). Mean durable ART suppression prior to testing was 5.0 years (range: 0.6–13.2 years). In all participants, HIV-spe-cific T cell responses to protein pools spanning HIV Clade B (Gag, Pol, Env, and Acc composed of Nef, Rev, Tat, Vif, and Vpu) were clearly detected (Figure 1A). The total HIV-specific T cell response, defined as the sum of the individual HIV protein peptide pools, was 1,198 spot-forming units (SFUs)/106peripheral blood mononuclear cells (PBMCs; range: 164–4,156 SFUs/106 PBMCs), comparable with other reports of PLWH on durable ther-apy.11,14,16 Consistent with observations in untreated HIV infec-tion,17 Gag-specific T cell responses were immuno-prevalent in terms of the proportion of reactive participants (100%, 34/34 reactive) and magnitude (mean = 394 SFUs/106 PBMCs, range 35–1,298 106 PBMCs). The high frequency of targeting of Gag, Pol, and Nef proteins was similar to previous reports of treated HIV infection.15,17
Measurements of HIV-specific T cell responses to pools of HIV pep-tides have been previously reported as an accurate and cell-saving
approach to monitoring the total HIV-specific T cell response.18,19 Prior experimentally confirmed optimal CD8+ T cell epitopes collated and listed by the Los Alamos National Laboratory HIV database were synthesized and combined into two peptide pools, CTL-A and CTL-B.20CTL-A contained optimal epitopes found in HIV Gag and Nef, whereas CTL-B contained epitopes found in HIV proteins other than Gag and Nef.20T cell responses to both the CTL-A and -B pools were consistently detected within the cohort (either CTL-A or -B: n = 33/34, CTL-A: n = 33/34, CTL-B: n = 31/34). Within reactive participants, the CTL-A pool induced higher T cell responses than the CTL-B pool (CTL-A mean = 667 SFUs/106PBMCs [range 65–2,430 SFUs/106PBMCs] versus CTL-B mean = 436 SFUs/106 PBMCs [range 34–1,803 SFUs/106 PBMCs]). We compared the total HIV-specific T cell response with the sum of CTL-A and CTL-B pools (CTLA+B) for each partic-ipant (Figure 1B). A strong correlation was observed (r = 0.75, Spearman rank, p%0.001, n = 34 pairs).
We next examined whether clinical and virological characteristics were associated with the frequency of post-ART HIV-specific T cells. No difference in summed T cell response to HIV protein pools was detected (p = 0.234, Mann-Whitney test, unpaired) between men (1,147 SFUs/106 PBMCs, range 164–4,156) and women (1,395 SFUs/106PBMCs, range 311–3,611), nor was there a detectable asso-ciation between age and HIV-specific T cell magnitude (r = 0.02, Spearman rank, p = 0.91, n = 34 pairs). The magnitude of the measured HIV-specific T cell response was broadly the same whether participants initiated treatment in acute infection or chronic HIV infection (acute 1,202 SFUs/106 PBMCs versus chronic 1,197 SFUs/106PBMCs). No association was detected between pre-ART CD4 nadir (range 9–789 cells/mL) and HIV-specific T cell response (r = 0.03, p = 0.87, Spearman rank, n = 34 pairs;Figure 1C). Simi-larly, no strong correlation was detected between T cell responses to either the summed total or individual HIV proteins and the size of the replication-competent virus measured by the quantitative viral
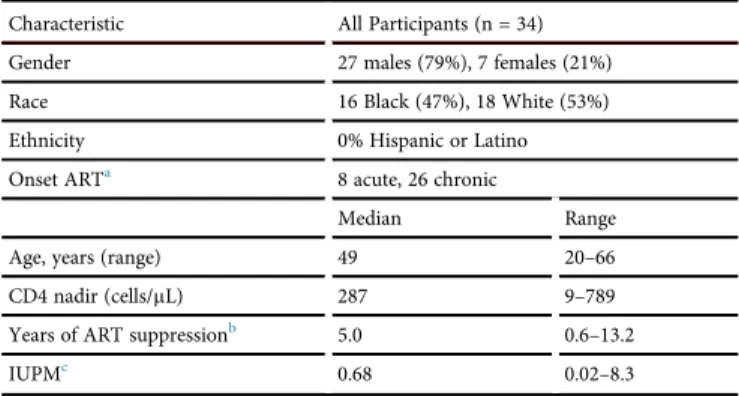
Table 1. Cross-Sectional Cohort (n = 34) Characteristics
Characteristic All Participants (n = 34)
Gender 27 males (79%), 7 females (21%)
Race 16 Black (47%), 18 White (53%)
Ethnicity 0% Hispanic or Latino
Onset ARTa 8 acute, 26 chronic
Median Range
Age, years (range) 49 20–66
CD4 nadir (cells/mL) 287 9–789
Years of ART suppressionb 5.0 0.6–13.2
IUPMc 0.68 0.02–8.3
aAcute: combination antiretroviral therapy (cART) begun within 30 days of negative or
discordant HIV antigen test.
bDurable suppression defined as time from%40 copies/mL to date of T cell
measure-ment. Numbers based on 33 participants because status of one participant unknown.
cIUPM (infectious units per million) numbers based on study data of 19 participants.
Table 2. Longitudinal Cohort (n = 32) Characteristics
Weekly, Monthlya Yearlya
Gender 19 males, 4 females 8 males, 1 female
Ethnicity 13 Black (56%), 10 White
1 Black, 1 Pacific Islander, 7 White
Race 0% Hispanic or Latino 11% Hispanic or Latino
Onset of ARTb 4 acute, 19 chronic all chronic
Age, years (range)c 48 (20–66) 41 (37–58)
CD4 nadir (cells/mL) 334 (9–789) 190 (10–397)
Years of ART suppressiond 4.8 (0.55–8.4) 2.4 (1.5–8.2)e
aWeekly and monthly enrolled at UNC; yearly enrolled at UCSF.
bAcute: ART begun within 30 days of negative or discordant HIV antigen test. c
Age atfirst T cell measurement.
dDurable suppression for UNC cohort defined as time from%40 copies/mL tofirst
T cell measurement. UCSF (SCOPE cohort) defined as time from%500 copies/mL to
first T cell measurement.
outgrowth assay (QVOA) (r = 0.22, Spearman rank, p = 0.37, n = 18 pairs;Figure 1D;Table S1).
HIV-Specific T Cell Responses Are Stable over Weeks, Months, and Years
Durably ART-suppressed PLWH were sampled either weekly (n = 14; Figure 2A), monthly (n = 9;Figure 2B), or yearly (n = 9, every 1–3 years for up to 8.5 years) for up to eight visits. T cell responses to CTL-A and CTL-B were measured at each time point. In each group, the magnitude of the HIV-specific T cell response was remarkably stable. Percent coefficient of variation (%CV) was calculated to sum-marize within-individual variability over time. Although overall %CV
Figure 1. HIV-Specific T Cell Responses Are Detectable in HIV-Seropositive, ART-Suppressed Individuals
(A) HIV-specific T cell responses from HIV-seropositive durably suppressed individuals (n = 34) were quantified by
ex vivoIFN-gELISpot assay. PBMCs were stimulated with either HIV Clade B peptides pooled by protein (Gag, Env, Pol, Nef, or ACC = Rev, Tat, Vif, Vpu, or Vpr) or previously defined HIV CD8+
optimal epitopes split into two pools, containing either a pool of Gag Nef optimal epitopes (CTL-A) or a pool of non-Gag Nef (“other,” CTL-B) optimal epitopes. Data are shown as boxplots (25th–75th inter-quartile range), with median and whiskers showing mini-mum to maximini-mum datapoints. Dotted line = 30 SFUs/106 PBMCs. Spearman rank correlations of total HIV-specific T cell response Gag+Pol+Env+Nef+Acc against (B) summed optimal T cell epitopes (r = 0.751, p < 0.001, n = 34), (C) CD4 nadir (r = 0.003, p = 0.98, n = 19, dotted line indicated CD4 T cells/mL = 100), and (D) the size of the replication-competent reservoir as measured by infec-tious units per million (IUPM) (r = 0.224, p = 0.37, n = 17). Red dots (B–D) indicate participants who started ART in acute HIV infection.
was low, a numerically higher %CV was observed in the yearly group (median CV: 26.9%; 95% confidence interval [CI] for the pseudo-median: 14.9%, 39.4%) compared with the weekly (16.2%; CI: 9.6%, 27.1%) and monthly (14.5%; CI: 9.1%, 26.1%) groups.
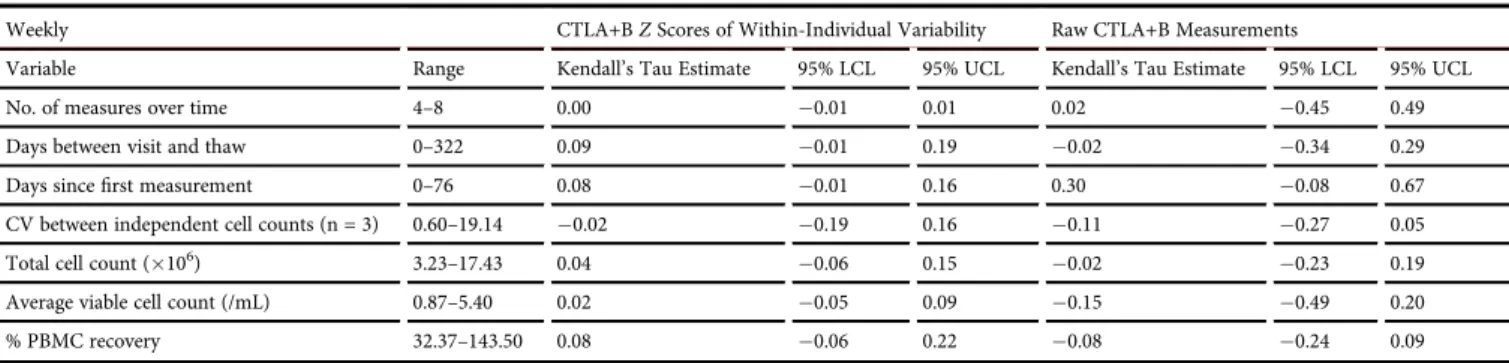
Parameters Influencing T Cell Measurements over Time
We examined a number of measurements, including technical measures such as CV between independent cell counts, T cell qual-ity measures such as total cell recovery and viabilqual-ity, and storage quality measures such as time between original sampling and assay testing (Table 2; Tables S3 and S4). Non-parametric Kendall’s Tau rank correlations were performed between either a Z score calculated for a participant’s HIV-specific T cell response or the raw T cell measurement and each assay variable. TheZscore anal-ysis informed assay reliability, whereas the raw T cell analanal-ysis
Figure 2. HIV-Specific T Cell Responses Are Stable over Weeks, Months, and Years
investigated whether assay variables directly impacted T cell measurements.
Not surprisingly, given the stability of HIV-specific T cell responses observed over time, mostZscore correlations were not detected at a 5% significance level (Table 3;Tables S3and S4). Mean SFU of the mock-stimulated was inversely correlated with total CTLA+B T cell response for participants measured yearly (Kendall’s Tau = 0.36; 95% CI: 0.63, 0.10).21Although some yearly data were excluded for high background (see Materials and Methods), the mean of the mock wells in yearly samples included for analysis re-mained higher than the weekly and monthly samples (yearly mean = 14.6 SFUs/106PBMCs versus weekly and monthly mean = 4.4 SFUs/106PBMCs).
Overall, these analyses suggest that HIV-specific T cell responses were not measurably impacted by the range of variation observed in technical parameters such as cell recovery and large differences in the period of cell storage. However, as expected, increasing non-specific background in negative control wells resulted in lowered assay sensitivity.
Minimal Variation of the Baseline HIV-Specific T Cell Response Allows for Design of Small but Powered Intervention Studies Baseline HIV-specific T cell responses were used to inform power calculations for future therapeutic vaccine studies (all data are pro-vided in Table S2). To calculate power for a continuous variable such as T cell magnitude, one must identify beforehand a mean-ingful effect size (e.g., vaccination will induce a geometric mean ratio [GMR] of 2.0, or equivalently a 2-fold change), a level of significance (e.g., alpha = 0.01 or 0.05), and a range of feasible sample sizes.
Based on recent therapeutic HIV vaccine studies (B. Mothe et al., 2017, Retroviruses Opportunistic Infect., abstract),14,16,22 we considered an effect size of GMR = 2.0, significance level of 0.05, and group sizes of 6, 8, and 12 participants per vaccine group relevant to HIV vaccine testing. The outcome measure (HIV-specific T cell responses) was assumed to follow a log-normal dis-tribution in order to generate simulated datasets. The baseline
variation data herein were used to estimate: (1) between-individual variation and (2) within-individual correlation in the weekly and monthly groups. Effectively, baseline variation data identified the “noise” against which to detect a vaccine-induced change in T cell response.
To calculate between-individual variation, measured as SD, the average of two baseline measurements per individual from weekly and monthly participants was used. A SD of 0.8 at baseline was observed using log-transformed CTLA+B measurements. The same SD was assumed for post-vaccination HIV-specific data (because post-vaccination data were not available at the time of study design, one potential limitation to this analysis).
Two approaches were taken to estimate within-individual correla-tion in the natural log-transformed CTLA+B T cell response: Pear-son’s correlation between the natural log-transformed CTLA+B T cell response at baseline and 9 weeks (±3 weeks), and an exchange-able working correlation estimatefit using generalized estimating equations (GEE) across all baseline measurements. Both methods estimated a within-individual correlation >0.9. Using an exact Wilcoxon signed-rank test under these assumptions, a group size of n = 6 participants provides 85% power to detect a GMR of 2 or greater (Table 4).
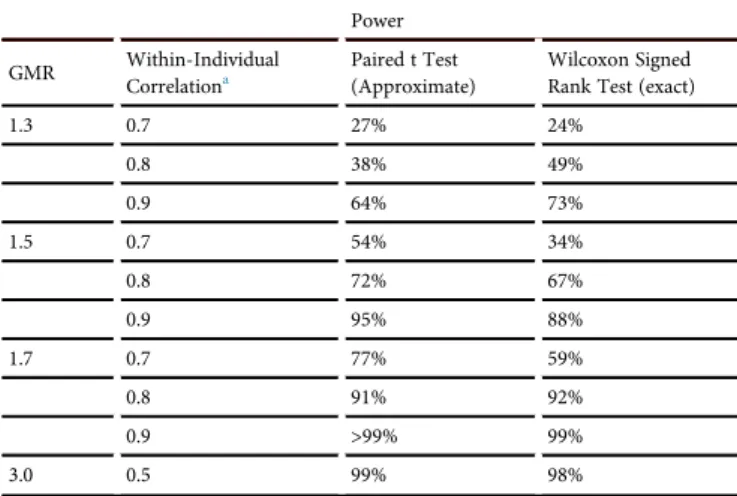
In a paired, pre- versus post-vaccination design, high levels of statis-tical power are more likely to be achieved when the within-individ-ual correlation is high. To allow for the possibility that in future vac-cine studies, baseline and post-vacvac-cine responses may not be as strongly correlated within individual as baseline responses alone (e.g., not all vaccine recipients may respond consistently to vaccina-tion), we also explored a range of within-pair correlations from 0.5 to 0.9 (Table 4). Due to the limited variance of HIV-specific T cell responses, we estimated >80% power to detect a GMR of 2 in the HIV-specific T cell response with a group size of 12 partici-pants, using a within-pair correlation as low as 0.6 (Table 4). Lastly, we used these baseline variation data to calculate the ability to detect changes in GMR <2 in group sizes of 12 (Table 5). When within-pair correlations are strong (0.9), there is >80% power to detect a fold-change in GMR as low as 1.5.
Table 3. Variability of HIV-Specific T Cell Responses Measured Weekly Was Not Associated with Assay Covariates
Weekly CTLA+BZScores of Within-Individual Variability Raw CTLA+B Measurements
Variable Range Kendall’s Tau Estimate 95% LCL 95% UCL Kendall’s Tau Estimate 95% LCL 95% UCL
No. of measures over time 4–8 0.00 0.01 0.01 0.02 0.45 0.49
Days between visit and thaw 0–322 0.09 0.01 0.19 0.02 0.34 0.29
Days sincefirst measurement 0–76 0.08 0.01 0.16 0.30 0.08 0.67
CV between independent cell counts (n = 3) 0.60–19.14 0.02 0.19 0.16 0.11 0.27 0.05
Total cell count (106) 3.23–17.43 0.04 0.06 0.15 0.02 0.23 0.19
Average viable cell count (/mL) 0.87–5.40 0.02 0.05 0.09 0.15 0.49 0.20
DISCUSSION
In this study, the strength and targeting of HIV-specific T cell re-sponses were examined cross-sectionally and longitudinally in durably suppressed PLWH. The cross-sectional analysis confirmed earlier observations that T cell targeting of HIV proteins in HIV+ ART+ individuals is similar to the patterns observed in untreated chronic infection, most notably the immuno-prevalence of Gag.17 T cell responses to previously identified optimal HIV CD8+T cell epi-topes were also examined.20The majority of these epitopes represent immuno-prevalent epitopes targeted by CD8+ T cells in chronic untreated HIV infection.23 An association was observed between the total summed T cell response to the HIV Clade B proteome and the summed response to these optimal epitope pools, suggesting that post-ART specific T cell responses strongly overlap with im-muno-prevalent CD8+T cell responses in untreated infection.
It is common for HIV immunotherapy studies to include a mini-mum threshold for pre-ART CD4 nadir, the rationale being that im-mune depletion during untreated infection may limit participant responsiveness to T cell immunotherapy. Here, consistent with a previous report,24no meaningful association was detected between the size of the HIV-specific T cell response and the wide range of CD4 nadir in participants in this study cohort. Although pre-ART CD4 depletion may impact T cell parameters not measured in this study, for immunotherapy trials employing ELISpot as an endpoint
assay, these data suggest that participants with low CD4 nadir can be enrolled.
Overall, we observed that the HIV-specific T cell response in durably suppressed PLWH is uniformly detectable with an average frequency of >1,000 SFUs/106PBMCs and is maintained over years. Although the overall frequency of the measured HIV-specific T cell response in our participant cohort is lower than in untreated HIV infec-tion,17,25 measured T cell responses were >10 times higher than memory T cell responses to influenza and yellow fever vaccina-tion.26,27In both influenza and yellow fever vaccination, there is no residual antigen, and the T cell responses measured reflect long-term memory. This suggests that the higher frequency of HIV-specific T cell responses in HIV+ART+individuals is maintained by ongoing low-level antigen presentation from residually infected cells, consistent with reports of low-level viremia in ART-suppressed individuals.28,29
A recent study reported a correlation between the T cell response measured by ELISpot targeting Nef and cell-associated HIV DNA levels,15suggesting post-ART detection of HIV Nef expression by T cells. In our study, no correlation was detected between the magni-tude of the HIV-specific T cell response (both the summed total HIV Clade B response and the response to individual HIV proteins) and the size of the replication-competent reservoir measured by QVOA. We do not consider these results incompatible. First, as discussed above, the stability of the HIV-specific T cell response over months and years observed in our study is consistent with low-level expres-sion of HIV proteins, including Nef, in ART-suppressed participants. Second, cell-associated DNA and QVOA measure different aspects of post-ART residual HIV. QVOA measures rare, transcriptionally quiescent, memory CD4+T cells that constitute <1% of the total
Table 4. Power to Detect 2-Fold Change in the GMR of the HIV-Specific T Cell Response from Pre- to Post-vaccine
Power to Detect GMR = 2a
Within-Individual
Correlationb Pairs, n
Paired t Test (Approximate)
Wilcoxon Signed Rank Test (Exact)
0.5 6 41% 27%
8 56% 49%
12 78% 73%
0.6 6 48% 34%
8 65% 58%
12 86% 83%
0.7 6 60% 43%
8 77% 71%
12 94% 92%
0.8 6 76% 58%
8 91% 86%
12 99% 98%
0.9 6 96% 85%
8 >99.9% 99%
12 >99.9% >99.9%
Power calculations were based on weekly and monthly CTLA+B data (UNC cohort). A between-individual SD = 0.8 for natural log-transformed CTLA+B was assumed for both pre- and post-vaccine, based on baseline data presented herein.
aA GMR = 2 corresponds to a 2-fold change between pre- and post-vaccine. bCorrelation between pre- and post-vaccination paired measurements.
Table 5. Power to Detect Various Fold Changes in the GMR of the HIV-Specific T Cell Response from Pre- to Post-vaccine (n = 12 Pairs)
Power
GMR Within-Individual Correlationa
Paired t Test (Approximate)
Wilcoxon Signed Rank Test (exact)
1.3 0.7 27% 24%
0.8 38% 49%
0.9 64% 73%
1.5 0.7 54% 34%
0.8 72% 67%
0.9 95% 88%
1.7 0.7 77% 59%
0.8 91% 92%
0.9 >99% 99%
3.0 0.5 99% 98%
Power calculations were based on weekly and monthly CTLA+B data (UNC cohort). A between-individual SD = 0.8 for natural log-transformed CTLA+B was assumed for both pre- and post-vaccine, based on baseline data presented herein.
HIV-infected cells measured by HIV DNA assays.30 Our results therefore suggest that the HIV-specific T cell response in HIV+ ART+individuals is not maintained by rare, stochastic reactivation of CD4+T cells harboring replication-competent cells, but rather sus-tained by antigen presentation from more frequent, less quiescent cells harboring both replication-competent and -incompetent HIV.
In summary, these data suggest that HIV-specific T cell response pre-ART treatment is largely maintained, albeit at lower frequencies, over durable ART-mediated HIV suppression. Given consistent rebound observed following treatment interruption and the lack of observed correlations between T cell responses and post-treatment control, therapeutic interventions will be necessary to improve the post-ART HIV-specific T cell response, particularly to ensure that CD8+ T cells detect and clear replication-competent reservoir virus. IFN-gELISpot is the most commonly used immunogenicity endpoint assay for clinical testing of T cell vaccines and immunotherapies, including HIV cure. The minimal variation over time of the HIV-specific T cell response measured by IFN-gELISpot in HIV+ART+ individuals has translational implications. We show that group sizes as small as six participants can provide sufficient power to detect a GMR of 2 for the HIV-specific T cell responses pre- versus post-vacci-nation. Data provided by this study will facilitate the design and powering of future T cell therapies against HIV.
MATERIALS AND METHODS IRB Approvals
Participants enrolled in one of three cohorts. Participants partici-pating in the cross-sectional and weekly and monthly longitudinal studies at UNC enrolled in one of the following IRB-approved studies: (1) CID 1107, Single Blood Collection Study (IRB #11-15060); (2) CID 0819, Apheresis Procedures to Obtain Leukocytes for Research Studies from HIV Positive Participants (08-1575); and (3) The UNC Women’s Interagency HIV Study (WIHS) (12-1660). Partici-pants providing the yearly longitudinal samples enrolled in the SCOPE cohort (IRB 10-01330, NCT00187512).
Review and implementation of all protocols utilized for the collection of samples for this analysis were approved by the University of North Carolina at Chapel Hill Biomedical IRB and the UCSF IRB. All par-ticipants provided written informed consent.
We used HIV-seronegative participants for assay standardization. These participants were recruited by the UNC Center for AIDS Research (CFAR) Immunology Core (IRB).
Study Participants and Ethics Statement
Participants were enrolled across three observational cohorts; all pro-vided written informed consent. For cross-sectional and weekly and monthly longitudinal studies, participants were enrolled through either the UNC Chapel Hill HIV Clinical Trials Unit or the WIHS UNC Chapel Hill site. For yearly longitudinal studies, participants were enrolled through the SCOPE cohort (NCT00187512) at UCSF. All experimental protocols were approved by local Institutional
Biomedical Review Boards (ethics numbers: 14-0741, 11-0228, and 13-3613, 12-1660, 10-01330) and performed in accordance with the relevant guidelines. HIV-seronegative participants for assay stan-dardization were recruited by the UNC CFAR Immunology Core (IRB 96-0859).
All participants were receiving stable standard-of-care ART and had maintained plasma HIV-1 RNA <50 copies/mL and a CD4 T cell count of >300/mL forR6 months before enrollment. Study character-istics of the cohorts are summarized inTables 1and2.
PBMC Isolation
Samples (50–100 mL) of apheresis product were collected for this study. PBMCs were isolated from the product by centrifugation (1,200gfor 15 min at room temperature) on a Ficoll-Paque density gradient (GE Healthcare Life Sciences Ficoll-Paque Plus). In brief, the apheresis product was diluted 1:2.5 in 2% fetal bovine serum (FBS)/ PBS, and 30 mL diluted product was underlaid with 15 mL Ficoll-Plaque in SepMate tube (SepMate-50 [IVD]) prior to centrifugation. PBMCs were harvested, then washed three times in 2% FBS/PBS. Cells were counted and then frozen.31
IFN-gELISpot
excluded because of high background; several time points in the longitudinal yearly study that used retrospective samples were excluded for high background.
Peptides
Two sets of HIV peptides were generated (Sigma-Genosys, USA): 18-mer peptides overlapping by 10 amino acids were synthesized (Sigma-Genosys, USA) to match the HIV Clade B consensus sequence (386 peptides) and previously defined HIV CD8+optimal peptides (9- to 11-mer peptides).20 Optimal CD8+ peptides were grouped by protein, 109 Gag/Nef (CTL-A) peptides or 103 non-Gag/Nef (CTL-B) peptides.
QVOA
QVOA assays were performed as previously described35to provide a minimum estimate of replication-competent HIV in 19 partici-pants.36 Infectious units per million (IUPM) estimates and CIs were calculated using the SLDAssay R software package.37
Statistical Analysis
The primary outcomes were mock-adjusted (i.e., mock-subtracted) HIV peptide pools (protein, CTLA, and CTLB) defined as: mean (HIV pools) mean (mock). All data are reported as SFUs per 106 PBMCs. Total HIV T cell response was defined as the sum of each mock-adjusted HIV protein pool: (mean CTLA mean mock) + (mean CTLB mean mock). At least three replicates were used per HIV peptide pool in all individuals. Visits with high background (mean mockR25 per 4105PBMCs) were excluded from analyses.
Cross-Sectional Data
Spearman rank two-sided tests for correlations were performed. Cross-sectional data analyses were conducted using GraphPad Prism version 6.00 for Windows (GraphPad Software, La Jolla, CA, USA).
Longitudinal Data
To describe within-individual variability over time, %CV was esti-mated. %CV is a measure of relative variability. A corresponding dis-tribution-free 95% CI for the pseudo-median CV was calculated. To inspect factors that may contribute to measurement variation, while standardizing for within-individual variability, an individual-specific Z score was calculated for mock-adjusted CTL-A+B and plotted against covariates of interest. Covariates included number of mea-sures over time, CV between percent live counts, total cell count, viable cell count, percent cell recovery following thaw, mock mean, days between visit and thaw, and days since first measurement. Additionally, to inspect factors that may be associated with high or low CTL-A+B values, raw CTL-A+B measurements were plotted against the same covariates of interest (data not shown). A marginal non-parametric Kendall’s Tau correlation for clustered (repeated-measures) data was estimated with a corresponding 95% Wald CI for CTL-A+B Z scores and covariates of interest, and raw CTL-A+B scores and covariates of interest.21 Analyses were conducted separately for (1) weekly, (2) monthly, and (3) yearly
data (unless noted otherwise). A two-sided 0.05 significance level was used throughout without adjustment for multiplicity. Statistical analyses were conducted in SAS version 9.4 (SAS/STAT 14.2) and R version 3.4.1.
Power Analysis: Methods
Statistical power was estimated for future studies that would compare average within-individual change in mock-adjusted CTLA+B from baseline to post-vaccine with n = 6, 8, and 12 participants. A GMR of at least 2 (corresponding to a 2-fold change pre- and post-vaccine) was anticipated to be scientifically meaningful and was used as the specific alternative hypothesis. Power for a paired ratio t test and a nonparametric exact Wilcoxon signed-rank test was calculated. The assumed between-individual SD for natural log-transformed CTLA+B was estimated from longitudinal data as the average of two baseline measurements per individual using weekly and monthly measurements combined. Correlation within an individual was esti-mated between paired natural log-transformed CTLA+B measures at thefirst time point and at 9 (±3) weeks using Pearson’s correlation. Empirical power for the exact Wilcoxon signed-rank test was calculated using 100,000 simulated datasets assuming that natural log-transformed CTLA+B follows a normal distribution, and the effect size under the alternative hypothesis wasln(2), i.e., a GMR of 2 on the raw CTLA+B (per 400,000 SFUs) scale. Approximate power for a paired t test was calculated using the Power procedurepaired meansstatement in SAS software.
SUPPLEMENTAL INFORMATION
Supplemental Information can be found online athttps://doi.org/10. 1016/j.omtm.2019.07.008.
AUTHOR CONTRIBUTIONS
N.G. conceived and designed the study. Y.X. and J.A.W., supported by G.C. and M.A.-F., performed immune assays and analyzed data. J.K., N.M.A., and D.M.M. generated and shared virologic data. A.A.A. pro-vided WIHS clinical samples. S.G.D. propro-vided SCOBE clinical sam-ples. J.D.K. and C.L.G. coordinated and led the UNC clinical protocol team for both cross-sectional and longitudinal collection of samples from participants. I.M.T., K.R.M., and M.H. performed statistical an-alyses and generated powering calculations. All authors reviewed the manuscript and contributed to its writing.
ACKNOWLEDGMENTS
REFERENCES
1.Sáez-Cirión, A., Bacchus, C., Hocqueloux, L., Avettand-Fenoel, V., Girault, I., Lecuroux, C., Potard, V., Versmisse, P., Melard, A., Prazuck, T., et al.; ANRS VISCONTI Study Group (2013). Post-treatment HIV-1 controllers with a long-term virological remission after the interruption of early initiated antiretroviral therapy ANRS VISCONTI Study. PLoS Pathog.9, e1003211.
2.Bongiovanni, M., Casana, M., Tincati, C., and d’Arminio Monforte, A. (2006). Treatment interruptions in HIV-infected subjects. J. Antimicrob. Chemother.58, 502–505.
3.Schackman, B.R., Gebo, K.A., Walensky, R.P., Losina, E., Muccio, T., Sax, P.E., Weinstein, M.C., Seage, G.R., 3rd, Moore, R.D., and Freedberg, K.A. (2006). The life-time cost of current human immunodeficiency virus care in the United States. Med. Care44, 990–997.
4.Mothe, B., Llano, A., Ibarrondo, J., Daniels, M., Miranda, C., Zamarreño, J., Bach, V., Zuniga, R., Pérez-Álvarez, S., Berger, C.T., et al. (2011). Definition of the viral targets of protective HIV-1-specific T cell responses. J. Transl. Med.9, 208.
5.Kiepiela, P., Leslie, A.J., Honeyborne, I., Ramduth, D., Thobakgale, C., Chetty, S., Rathnavalu, P., Moore, C., Pfafferott, K.J., Hilton, L., et al. (2004). Dominant infl u-ence of HLA-B in mediating the potential co-evolution of HIV and HLA. Nature 432, 769–775.
6.Deeks, S.G., and Walker, B.D. (2007). Human immunodeficiency virus controllers: mechanisms of durable virus control in the absence of antiretroviral therapy. Immunity27, 406–416.
7.Allen, T.M., Altfeld, M., Geer, S.C., Kalife, E.T., Moore, C., O’sullivan, K.M., Desouza, I., Feeney, M.E., Eldridge, R.L., Maier, E.L., et al. (2005). Selective escape from CD8+ T-cell responses represents a major driving force of human immunodeficiency virus type 1 (HIV-1) sequence diversity and reveals constraints on HIV-1 evolution. J. Virol.79, 13239–13249.
8.Liu, M.K., Hawkins, N., Ritchie, A.J., Ganusov, V.V., Whale, V., Brackenridge, S., Li, H., Pavlicek, J.W., Cai, F., Rose-Abrahams, M., et al.; CHAVI Core B (2013). Vertical T cell immunodominance and epitope entropy determine HIV-1 escape. J. Clin. Invest.123, 380–393.
9.Day, C.L., Kaufmann, D.E., Kiepiela, P., Brown, J.A., Moodley, E.S., Reddy, S., Mackey, E.W., Miller, J.D., Leslie, A.J., DePierres, C., et al. (2006). PD-1 expression on HIV-specific T cells is associated with T-cell exhaustion and disease progression. Nature443, 350–354.
10.Coffey, S., Bacchetti, P., Sachdev, D., Bacon, O., Jones, D., Ospina-Norvell, C., Torres, S., Lynch, E., Camp, C., Mercer-Slomoff, R., et al. (2019). RAPID antiretroviral ther-apy: high virologic suppression rates with immediate antiretroviral therapy initiation in a vulnerable urban clinic population. AIDS33, 825–832.
11.Dorrell, L., Yang, H., Ondondo, B., Dong, T., di Gleria, K., Suttill, A., Conlon, C., Brown, D., Williams, P., Bowness, P., et al. (2006). Expansion and diversification of virus-specific T cells following immunization of human immunodeficiency virus type 1 (HIV-1)-infected individuals with a recombinant modified vaccinia virus Ankara/HIV-1 Gag vaccine. J. Virol.80, 4705–4716.
12.Autran, B., Murphy, R.L., Costagliola, D., Tubiana, R., Clotet, B., Gatell, J., Staszewski, S., Wincker, N., Assoumou, L., El-Habib, R., et al.; ORVACS Study Group (2008). Greater viral rebound and reduced time to resume antiretroviral therapy after therapeutic immunization with the ALVAC-HIV vaccine (vCP1452). AIDS 22, 1313–1322.
13.Schooley, R.T., Spino, C., Kuritzkes, D., Walker, B.D., Valentine, F.A., Hirsch, M.S., Cooney, E., Friedland, G., Kundu, S., Merigan, T.C., Jr., et al. (2000). Two double-blinded, randomized, comparative trials of 4 human immunodeficiency virus type 1 (HIV-1) envelope vaccines in HIV-1-infected individuals across a spectrum of dis-ease severity: AIDS Clinical Trials Groups 209 and 214. J. Infect. Dis.182, 1357–1364.
14.Harari, A., Rozot, V., Cavassini, M., Bellutti Enders, F., Vigano, S., Tapia, G., Castro, E., Burnet, S., Lange, J., Moog, C., et al. (2012). NYVAC immunization induces poly-functional HIV-specific T-cell responses in chronically-infected, ART-treated HIV patients. Eur. J. Immunol.42, 3038–3048.
15.Thomas, A.S., Jones, K.L., Gandhi, R.T., McMahon, D.K., Cyktor, J.C., Chan, D., Huang, S.H., Truong, R., Bosque, A., Macedo, A.B., et al. (2017). T-cell responses targeting HIV Nef uniquely correlate with infected cell frequencies after long-term antiretroviral therapy. PLoS Pathog.13, e1006629.
16.Achenbach, C.J., Assoumou, L., Deeks, S.G., Wilkin, T.J., Berzins, B., Casazza, J.P., Lambert-Niclot, S., Koup, R.A., Costagliola, D., Calvez, V., et al.; EraMune 02 study team (2015). Effect of therapeutic intensification followed by HIV DNA prime and rAd5 boost vaccination on HIV-specific immunity and HIV reservoir (EraMune 02): a multicentre randomised clinical trial. Lancet HIV2, e82–e91.
17.Addo, M.M., Yu, X.G., Rathod, A., Cohen, D., Eldridge, R.L., Strick, D., Johnston, M.N., Corcoran, C., Wurcel, A.G., Fitzpatrick, C.A., et al. (2003). Comprehensive epitope analysis of human immunodeficiency virus type 1 (HIV-1)-specific T-cell re-sponses directed against the entire expressed HIV-1 genome demonstrate broadly directed responses, but no correlation to viral load. J. Virol.77, 2081–2092.
18.Streeck, H., Jolin, J.S., Qi, Y., Yassine-Diab, B., Johnson, R.C., Kwon, D.S., Addo, M.M., Brumme, C., Routy, J.P., Little, S., et al. (2009). Human immunodeficiency virus type 1-specific CD8+ T-cell responses during primary infection are major de-terminants of the viral set point and loss of CD4+ T cells. J. Virol.83, 7641–7648.
19.Streeck, H., Frahm, N., and Walker, B.D. (2009). The role of IFN-gamma Elispot assay in HIV vaccine research. Nat. Protoc.4, 461–469.
20.K. Yusim, B.T.M. Korber, C. Brander, D. Barouch, R. de Boer, B.F. Haynes, R. Koup, J.P. Moore, B.D. Walker, and D.I. Watkins, eds. (2016). HIV Molecular Immunology. Los Alamos National Laboratory, Theoretical Biology and Biophysics (Los Alamos: NM), USA. LA-UR 17-24847.
21.Lorenz, D.J., Datta, S., and Harkema, S.J. (2011). Marginal association measures for clustered data. Stat. Med.30, 3181–3191.
22.Li, J.Z., Heisey, A., Ahmed, H., Wang, H., Zheng, L., Carrington, M., Wrin, T., Schooley, R.T., Lederman, M.M., and Kuritzkes, D.R.; ACTG A5197 Study Team (2014). Relationship of HIV reservoir characteristics with immune status and viral rebound kinetics in an HIV therapeutic vaccine study. AIDS28, 2649–2657.
23.Frahm, N., Baker, B., and Brander, C. (2008). Identification and Optimal Definition of HIV-Derived Cytotoxic T-Lymphocyte (CTL) Epitopes for the Study of CTL Escape, Functional Avidity and Viral Evolution. Los Alamos National Laboratory, Theoretical Biology and Biophysics (Los Alamos: NM), USA. LA-UR 08-05096.
24.Rehr, M., Cahenzli, J., Haas, A., Price, D.A., Gostick, E., Huber, M., Karrer, U., and Oxenius, A. (2008). Emergence of polyfunctional CD8+ T cells after prolonged sup-pression of human immunodeficiency virus replication by antiretroviral therapy. J. Virol.82, 3391–3404.
25.Mothe, B., Llano, A., Ibarrondo, J., Zamarreño, J., Schiaulini, M., Miranda, C., Ruiz-Riol, M., Berger, C.T., Herrero, M.J., Palou, E., et al. (2012). CTL responses of high functional avidity and broad variant cross-reactivity are associated with HIV control. PLoS ONE7, e29717.
26.Hayward, A.C., Wang, L., Goonetilleke, N., Fragaszy, E.B., Bermingham, A., Copas, A., Dukes, O., Millett, E.R., Nazareth, I., Nguyen-Van-Tam, J.S., et al.; Flu Watch Group (2015). Natural T Cell-mediated Protection against Seasonal and Pandemic Influenza. Results of the Flu Watch Cohort Study. Am. J. Respir. Crit. Care Med. 191, 1422–1431.
27.Hammarlund, E., Lewis, M.W., Hansen, S.G., Strelow, L.I., Nelson, J.A., Sexton, G.J., Hanifin, J.M., and Slifka, M.K. (2003). Duration of antiviral immunity after smallpox vaccination. Nat. Med.9, 1131–1137.
28.Maldarelli, F., Palmer, S., King, M.S., Wiegand, A., Polis, M.A., Mican, J., Kovacs, J.A., Davey, R.T., Rock-Kress, D., Dewar, R., et al. (2007). ART suppresses plasma HIV-1 RNA to a stable set point predicted by pretherapy viremia. PLoS Pathog.3, e46.
29.Palmer, S., Maldarelli, F., Wiegand, A., Bernstein, B., Hanna, G.J., Brun, S.C., Kempf, D.J., Mellors, J.W., Coffin, J.M., and King, M.S. (2008). Low-level viremia persists for at least 7 years in patients on suppressive antiretroviral therapy. Proc. Natl. Acad. Sci. USA105, 3879–3884.
30.Chun, T.W., Carruth, L., Finzi, D., Shen, X., DiGiuseppe, J.A., Taylor, H., Hermankova, M., Chadwick, K., Margolick, J., Quinn, T.C., et al. (1997). Quantification of latent tissue reservoirs and total body viral load in HIV-1 infection. Nature387, 183–188.
31.Goonetilleke, N., Moore, S., Dally, L., Winstone, N., Cebere, I., Mahmoud, A., Pinheiro, S., Gillespie, G., Brown, D., Loach, V., et al. (2006). Induction of multifunc-tional human immunodeficiency virus type 1 (HIV-1)-specific T cells capable of proliferation in healthy subjects by using a prime-boost regimen of DNA- and
32.Wang, L., Hückelhoven, A., Hong, J., Jin, N., Mani, J., Chen, B.A., Schmitt, M., and Schmitt, A. (2016). Standardization of cryopreserved peripheral blood mononuclear cells through a resting process for clinical immunomonitoring–Development of an algorithm. Cytometry A89, 246–258.
33.Kutscher, S., Dembek, C.J., Deckert, S., Russo, C., Körber, N., Bogner, J.R., Geisler, F., Umgelter, A., Neuenhahn, M., Albrecht, J., et al. (2013). Overnight resting of PBMC changes functional signatures of antigen specific T- cell responses: impact for im-mune monitoring within clinical trials. PLoS ONE8, e76215.
34.Santos, R., Buying, A., Sabri, N., Yu, J., Gringeri, A., Bender, J., Janetzki, S., Pinilla, C., and Judkowski, V.A. (2014). Improvement of IFNg ELISPOT Performance Following Overnight Resting of Frozen PBMC Samples Confirmed Through Rigorous Statistical Analysis. Cells4, 1–18.
35.Crooks, A.M., Bateson, R., Cope, A.B., Dahl, N.P., Griggs, M.K., Kuruc, J.D., Gay, C.L., Eron, J.J., Margolis, D.M., Bosch, R.J., and Archin, N.M. (2015). Precise Quantitation of the Latent HIV-1 Reservoir: Implications for Eradication Strategies. J. Infect. Dis.212, 1361–1365.
36.Siliciano, J.D., and Siliciano, R.F. (2005). Enhanced culture assay for detection and quantitation of latently infected, resting CD4+ T-cells carrying replication-competent virus in HIV-1-infected individuals. Methods Mol. Biol. 304, 3–15.