https://doi.org/10.1007/s00204-018-2256-2
TOXICOGENOMICS
Comparison of base-line and chemical-induced transcriptomic
responses in HepaRG and RPTEC/TERT1 cells using TempO-Seq
Alice Limonciel1,3 · Gamze Ates2 · Giada Carta1,3 · Anja Wilmes1,3 · Manfred Watzele4 · Peter J. Shepard5 ·
Harper C. VanSteenhouse5 · Bruce Seligmann5 · Joanne M. Yeakley5 · Bob van de Water6 · Mathieu Vinken2 ·
Paul Jennings1,3
Received: 18 August 2017 / Accepted: 4 July 2018 / Published online: 14 July 2018 © The Author(s) 2018
Abstract
The utilisation of genome-wide transcriptomics has played a pivotal role in advancing the field of toxicology, allowing the mapping of transcriptional signatures to chemical exposures. These activities have uncovered several transcriptionally regu-lated pathways that can be utilised for assessing the perturbation impact of a chemical and also the identification of toxic mode of action. However, current transcriptomic platforms are not very amenable to high-throughput workflows due to, high cost, complexities in sample preparation and relatively complex bioinformatic analysis. Thus, transcriptomic investigations are usually limited in dose and time dimensions and are, therefore, not optimal for implementation in risk assessment workflows. In this study, we investigated a new cost-effective, transcriptomic assay, TempO-Seq, which alleviates the aforementioned limitations. This technique was evaluated in a 6-compound screen, utilising differentiated kidney (RPTEC/TERT1) and liver (HepaRG) cells and compared to non-transcriptomic label-free sensitive endpoints of chemical-induced disturbances, namely phase contrast morphology, xCELLigence and glycolysis. Non-proliferating cell monolayers were exposed to six sub-lethal concentrations of each compound for 24 h. The results show that utilising a 2839 gene panel, it is possible to discriminate basal tissue-specific signatures, generate dose–response relationships and to discriminate compound-specific and cell type-specific responses. This study also reiterates previous findings that chemical-induced transcriptomic alterations occur prior to cytotoxicity and that transcriptomics provides in depth mechanistic information of the effects of chemicals on cellular transcriptional responses. TempO-Seq is a robust transcriptomic platform that is well suited for in vitro toxicity experiments.
Keywords HepaRG · RPTEC/TERT1 · TempO-Seq · Stress responses · Dedifferentiation
Introduction
A distinct advantage of in vitro techniques over whole animal models is their applicability to mechanistic inves-tigations and the ability to use cells of human origin. Alice Limonciel and Gamze Ates are equally contributing
first authorship. Paul Jennings and Mathieu Vinken are joint corresponding authors.
Electronic supplementary material The online version of this
article (https ://doi.org/10.1007/s0020 4-018-2256-2) contains
supplementary material, which is available to authorized users.
* Mathieu Vinken
mvinken@vub.ac.be
* Paul Jennings
p.jennings@vu.nl
1 Division of Molecular and Computational Toxicology,
Amsterdam Institute for Molecules, Medicines and Systems, Vrije Universiteit Amsterdam, De Boelelaan 1108,
1081 HZ Amsterdam, The Netherlands
2 Department of In Vitro Toxicology
and Dermato-Cosmetology, Vrije Universiteit Brussel, Laarbeeklaan 103, 1090 Brussels, Belgium
3 Division of Physiology, Department of Physiology
and Medical Physics, Medical University of Innsbruck, 6020 Innsbruck, Austria
4 Roche Diagnostics GmbH, Nonnenwald 2, 82377 Penzberg,
Germany
5 BioSpyder Technologies, Inc., 5922 Farnsworth Ct Ste 102,
Carlsbad, CA 92008, USA
6 Division of Toxicology, Leiden Academic Center for Drug
Mechanistic-based assays are rapidly becoming the corner-stone of contemporary toxicological investigations, driven by advances in genetic analysis and associated omic meth-odologies. Transcriptomics has been a key tool in allow-ing a better understandallow-ing of how the cellular program is altered in response to stress situations (Jennings et al. 2013). However, whole genome arrays are still too expensive to be considered for routine use. Additionally, RNA sample preparation and post-analysis is cumbersome when sample numbers are large. Thus, multiple compound concentrations and/or temporal effects are seldom studied in transcriptomic investigations and toxicogenomic data is often limited in dimension (Wilmes et al. 2011, 2013). Where complete dose responses were conducted, for example, by Waldmann et al., the chemical-induced alterations in transcriptomic expres-sion were shown to manifest at concentrations well below alterations in cell viability (Waldmann et al. 2014). Thus, if transcriptomic assays become cheaper and easier to perform, it is likely to become a dominant methodology for hazard and risk assessment, due to the wealth of mechanistic infor-mation it provides.
In the present study we investigated the utility of a new, cost-effective technique templated oligo assay with sequencing readout (TempO-Seq) that solves both the cost and throughput issues (Grimm et al. 2016; Yeakley et al. 2017). TempO-Seq is an NGS library preparation method that is based on ligation of detector oligos that are hybrid-ized directly to RNA targets, with the subsequent addition of sample barcodes and sequencing adapters by PCR amplifica-tion. In addition, there is no RNA extraction step required. The detector oligos are chimeric and contain a sequence spe-cific to the targeted RNA as well as a sequence in common among the detector oligos for universal primers. TempO-Seq thus allows cost-effective, simultaneous quantification of specific mRNA targets without the need to isolate RNA. In this particular study, we utilised a probe set identifying 2839 genes which is a combination of a previously selected gene panel (Mav et al. 2018) supplemented with knowledge-based cellular stress response-related genes identified by the experiences of the academic groups in this publication. The entire gene set utilised is provided in Table S1. The Mav et al. gene-set was developed by the U.S. Tox21 Federal collaboration program and represents a data-driven strategy of sentinel genes (selected for biological diversity, maximal information content, and widespread pathway coverage), which was also augmented using a knowledge-driven selec-tion of addiselec-tional genes (Mav et al. 2018).
Two of the major target organs for systemic toxicology are the liver and kidney. While renal and hepatic in vitro systems are often run within the same project umbrella, they are not usually challenged with the same compounds at the same concentrations. This makes it difficult to compare data and draw conclusions pertaining to tissue-specificity
of responses and tissue-specific biomarkers. Here we uti-lised a human renal and human hepatic cell line (RPTEC/ TERT1 and HepaRG, respectively). RPTEC/TERT1 and HepaRG are considered the most differentiated and stable cell lines currently available for their respective tissues and thus the most applicable for in vitro toxicological investiga-tions (Guillouzo et al. 2007; Doktorova et al. 2013; Aschauer et al. 2013, 2015). Both cell types were used for drug expo-sures under serum-free conditions and under differentiated non-proliferating monolayer conditions. The cells were exposed to the same six compounds at the same concentra-tions, measuring the same endpoints (impedance, glycolysis, morphology, and targeted TempO-Seq transcriptomics). The six structurally unrelated compounds selected were
ochra-toxin A (OTA), potassium bromate (KBrO3), cyclosporine A
(CsA), acetaminophen (APAP), isoniazid (ISZ) and sodium valproate (VALP). While some of these may be considered preferentially nephrotoxic or hepatotoxic, in reality, many adversely affect both organs and in addition pharmacoki-netic properties are likely to play a major role in target organ specificity in vivo.
The present study demonstrates the usefulness of the TempO-Seq methodology, identifies differences in RPTEC/ TERT1 and HepaRG expressed transcriptomes, differences in toxicological responses and identifies chemical- and tis-sue-specificity of certain gene and pathway responses.
Materials and methods
Routine cell culture and differentiation
The hepatic cell line, HepaRG (Guillouzo et al. 2007), was obtained from BioPredic International and the renal proxi-mal tubule cell line, RPTEC/TERT1 (Wieser et al. 2008), from Evercyte GmbH. HepaRG cells were routinely cultured in William’s E medium (Gibco 12551032) supplemented with 2 mM Glutamax, 5 µg/ml insulin, 50 µM hydrocor-tisone 21-hemisuccinate, 100 U/ml penicillin, 100 µg/ml streptomycin and 9% Foetal Calf Serum (FCS) (all compo-nents were from BioPredic International). RPTEC/TERT1 cells were routinely cultured, differentiated and exposed to chemicals in a 1:1 mix of DMEM (Gibco 11966-025) and Ham’s F12 (Gibco 21765-029) (containing a final con-centration of 5 mM glucose) and supplemented with 2 mM Glutamax, 10 ng/ml epidermal growth factor, 36 ng/ml hydrocortisone, 5 µg/ml insulin, 5 µg/ml transferrin, 5 ng/ml selenium, 100 U/ml penicillin and 100 µg/ml streptomycin (Jennings et al. 2009). Cells were cultured in a controlled
humidified 37 °C, 5% CO2 environment. Cells were
10 µg/cm2 collagen I (Biopredic) coated 12 well or 96 well plates in base William’s E medium with GlutaMAX and ADD670 additives (Biopredic). Medium was changed after 24 h to maintenance/metabolism medium (base medium with ADD620 additives) and renewed after 48 h. Three days later the medium was changed to Induction medium (base medium with ADD650 serum-free additives). RPTEC/ TERT1 cells were differentiated by allowing them to reach confluence and remain in a confluent state for at least 7 days before treatment as previously described (Aschauer et al. 2013).
Chemical exposures
From the past experiences of the two experienced testing laboratories (i.e., Medical University of Innsbruck, MUI, and the Vrije Universiteit Brussel, VUB), a panel of six unrelated compounds and associated concentrations were
selected (Table 1). Differentiated cell monolayers were
washed and treated with the compounds in serum-free medium for 24 h. All compounds, except for CsA, were water soluble. Stock solutions of CsA (15 mM) were made in 100% DMSO, aliquoted and frozen. All final concentra-tions for CsA had a 0.1% DMSO content and 0.1% DMSO was used as a vehicle control. OTA was made up to 2.48 mM in supplemented DMEM/Ham’s F12 aliquoted and frozen. All other stocks were generated in either HepaRG complete medium or RPTEC/TERT1 complete medium and used freshly (Table 1).
xCELLigence assay
xCELLigence experiments were conducted at the MUI laboratory. Cells were seeded in the proprietary E-Plates containing the impedance gold electrodes in 60 µl medium and differentiated. Impedance was measured intermittently using the RTCA unit in a cell culture incubator. At time of exposure impedance was measured every 5 min for the 24-h duration. Cell index (CI) was normalised to the impedance before measurement per well.
TempO‑Seq assay
Three separate batches of HepaRG and RPTEC/TERT1 were cultured in separate medium stocks and seeded and differentiated in 12-well plates. The HepaRG and RPTEC/ TERT1 experiments were conducted at the VUB and the MUI, respectively. The three biological replicates of differ-entiated cells were exposed to chemicals, medium controls and 0.1% DMSO controls for 24 h in serum-free medium. Morphology was documented by phase contrast micros-copy (Fig. 2). Wells were washed in 1 ml PBS (DPBS, Gibco, 14190-094) and lysed in 750 µl of 1× BioSpyder lysis buffer. Lysates were frozen at − 80 °C and shipped to BioSpyder technologies on dry ice where the TempO-Seq assay was conducted.
Cellular extracts were harvested for TempO-Seq analy-sis to quantify the 3050 probe set representing 2839 genes (Table S1). A pair of detector oligos were annealed to adja-cent 25 nt sequences in the target RNA, after which excess oligos were digested with a nuclease, and remaining oligos were ligated (Yeakley et al. 2017). This process occurred as a homogenous assay through progressive dilution to ensure enzyme compatibility and was, therefore, free of
Table 1 Concentrations of chemicals used with vehicle and ordering information
0–5 are the dilutions, all values are expressed in µM unless otherwise stated Tested concentrations in µM
Name Ochratoxin A Potassium Bromate Cyclosporine A Na valproate Acetaminophen Isoniazid
Short name OTA KBrO3 CsA VALP APAP ISZ
Dilution
0 0 0 0 0 0 0
1 0.001 80 0.05 8 8 8
2 0.01 400 1 40 40 40
3 0.13 800 5 200 200 200
4 1 2000 10 1000 1000 1000
5 10 4000 15 5000 5000 10,000
Pre-stock 2.48 mM – 15 mM – – –
Vehicle RPTEC/TERT1 Medium RPTEC/TERT1 Medium DMSO HepaRG medium HepaRG medium HepaRG medium
Source Sigma Sigma Calbiochem Sigma Sigma Sigma
the need for bead-based clean-up or poly (A) + selection. Furthermore, the assay did not require RNA purification or cDNA synthesis. Once ligated, the detector oligos acted as templates in a PCR-based amplification to add sequenc-ing adapters for an Illumina instrument and sample bar-codes. Since all the detector oligos share the same pair of primer landing sites, the assay could be multiplexed with respect to the RNA targets, but still single plex with respect to the primers. The PCR primers both include a 9-mer index sequence, different for the primers used to amplify each sample, that resulted in dual index sample barcodes, allowing pooling post-PCR of up to 384 samples in 1 library. The number of samples per library depends on the sequencing depth achievable for a given instrument and the read depth desired. For a detector pool of ~ 3 K targets, between 0.5M and 3M reads per sample should
give correlations of R2 = ~ 0.97 for technical replicates of
100 ng purified total RNA. Each sample fastq file was aligned against the TempO-Seq transcriptome using the Bowtie aligner (Li and Durbin 2009). The output of this analysis generated a table of counts per gene per sample.
Lactate assay
Supernatant samples from the same TempO-Seq run were centrifuged at 150 g for 5 min to remove free floating cells. The supernatant was frozen at − 20 °C until assay. Samples from the VUB lab were transferred to the MUI lab for assay. In a 96 well microtitre plate 10 µl super-natant medium was incubated with 90 µl lactate reagent
buffer (86 mM Triethanolamine HCl, 8.6 mM EDTA.Na2,
33 mM MgCl2, 326 µM N-methylphenazonium methyl
sulphate (PMS), 790 µM p-iodonitrotetrazolium violet (INT), 3.37 mM β-NAD, 7% ethanol, 0.4% Triton-X-100, 4 U/ml Lactate Dehydrogenase) for approximately 7 min at room temperature, as previously described (Limonciel
et al. 2011). Optical density was measured in a Tecan
Infinite M200 at 490 nm. An 8-point calibration curve starting with 25 mM lactate was used to determine actual concentrations. To avoid confusion we wish to clarify that this assay measures the metabolite lactate, not the activity of the lactate dehydrogenase enzyme, which is often used as a cell viability (plasma membrane integrity) assay.
Data analysis and visualisation
TempO-Seq sample outliers were assessed for the two cell types independently and identified using both the Tukey’s and Grubb’s outlier tests. No outliers were uncovered in this sample set. Normalization and differential expression were performed using the DESeq2 package (Love et al. 2014). To perform differential expression analysis, each
treatment condition was paired with the appropriate con-trol and the counts for each sample were then normalized using the DESeq2 estimateSizeFactors function. Differen-tial expression of each treatment relative to its respective control was measured using the Wald test. Probes with
Benjamin Hochberg adjusted p values ≤ 0.05 were
con-sidered significantly differentially expressed.
Heat maps were generated using the conditional for-matting function of Microsoft Excel (version 1803). Genes were assigned to ATF4, Nrf2 or p53 pathways using information from several published sources (Riley et al. 2008; Limonciel et al. 2015). For a complete list of pathway allocations and sources see Table S3. Toxico-logical Prioritization Index (ToxPi) visualisations were generated using the National Center for Computational Toxicology, U.S. EPA’s ToxPi software version 2.0 (Reif
et al. 2013; Marvel et al. 2018). The linear algorithm
was used for all Pis, with equal weightings. The complete input file for the ToxPi software is given in Table S5.
Statistical analysis
For concentration dependent analysis a one-way ANOVA with Dunnett’s post-test vs control (lactate and individual genes) was conducted. For time and concentration analysis a two-way ANOVA was used with a Sidak’s post-test (xCEL-Ligence). Both were generated using GraphPad Prism ver-sion 6. See legends for specific details.
Results
N-acyltransferase (BAAT), genes involved in the urea cycle Arginase 1 (ARG1) and the transcription factor hepatocyte nuclear factor 4 alpha (HNF4A). HepaRG, compared to RPTEC/TERT1 cells also highly express Epiregulin (EREG) and several genes associated with cancer, many belonging to the GAGE family (GAGE − 1, − 2, − 3, − 4 and − 12).
RPTEC/TERT1 cells exhibited a higher expression of genes including the nephrogenic transcription fac-tor PAX8, the tight junction protein claudin 2 (CLDN2), SLC7A5 and SLC3A2 (the genes encoding the proteins for the large neutral amino acid transporter LAT1), the brush border enzyme gamma glutamyl transferase (GGT1), col-lagen 4A (COL4A), methionine adenosyltransferase 2A (MAT2A), secreted phosphoprotein 1 (SPP1), mal, T-cell
differentiation protein 2 (MAL2), ATP binding cassette sub-family C members (ABCC 4 and 5), phosphofructokinase (PFKP), gamma-butyrobetaine hydroxylase 1 (BBOX1), vimentin (VIM), ATPase Na+/K+ transporting subunit beta 1 (ATP1B1), the proton pump (ATP6VOE1), glyceraldehyde 3-phosphate dehydrogenase (GAPDH), ribosomal protein S7 (RPS7), amyloid beta precursor protein (APP), myosin X (MYO10), NAD(P)H quinone dehydrogenase 1 (NQO1), mucin 1 (MUC1), adhesion molecule with Ig like domain 2 (AMIGO2) and plasminogen activator urokinase (PLAU).
Upon exposure to the selected compounds, temporal alterations in impedance utilising the xCELLigence system showed an initial spike after all treatments in both cell lines, presumably due to the manipulation of the cells outside the
Fig. 1 Comparison of HepaRG
and RPTEC/TERT1 transcrip-tome. From a total of 3050 probes (inset a), probes were filtered for significant difference between the in vitro models (p value < 0.001) and with a coef-ficient of variance greater than 0.6. a Plot of HepaRG mRNA values against the correspond-ing RPTEC/TERT1 values. b Most abundant 15 genes from the 105 genes which are exclu-sively expressed in 1 model. All values are given in Table S2A and S2B
-1 0 1 2 3 4 5
0 1 2 3 4 5 6
RPTEC/TERT1 (log 10 mRNA expression level)
H
epa
RG
(log
10
mRNA
ex
pression
le
ve
l)
ABCC4 MAGEA6
DCN
MUC1 GUCY1A3
SDC1
YWHAB
DDIT3 TMEM97 FN1
ATP1B1
ALDH3A2
SPP1
ABCA1
FERMT2 ATP2C1
LPAR2 GLUL
ABCC2
SLC7A5 IFIT1
PPP1CB
NR2F2 IRF1
GJA1
PLS1
AFP
DDIT3
LRRC41 MAOB
BBOX1 LGMN ABCC2
GAGE12F
TOMM34
PROC TSC22D3
NQO1 AKR1C3MAOA
PPM1B
HK1 INPP4B
GNPDA1 CDK7
VIM CDH2
AKR1B10
TXNDC9 FN1
APP
IGFBP4
MFAP5
CCBL2
AKR1B1
FKBP5 TIMP1
MFSD10
ATP6V0E1 AKR1C3
GJB2
PFKP ITGA1
AMIGO2 SOD2ETFB
COL4A1 TFAP2A PLIN2
KIAA0753 BCL2L11
TMEM185A EIF4G1
ABCC4
FAM69A
MBD4 ADCK3
SERPINE2
SYTL2 DCN
MDM2
SNRPG FASN
PLEKHA7 SNAI2
GDF15
CDA
ARPC3 PROS1
VPS72
CLDN2 SLC39A10
KLF5
VAPB
CCT5
KDM3A
GDF15
SMNDC1 C1R
MALT1 ATP6V1D
ADAM10
KRT7 RAC2
CTSS
ZNF274 FN1
WASF3 H2AFV SYNE2
DDC
CDH1 SOD3
GTF2H2C
MRPS6
MYO10 SERPINE2 ACSL5
PTPN6
TRIM2 EMP1
SLC6A8 HSPA2
CSNK1A1
DDC SHC1
GHR CLSTN1
SOX4 EDN1
UBE2Q2 HN1L
EREG
BAG3
PDCD6IP
CYP26B1
MLLT11 C3
HDAC2
GPR56 MAP1LC3A
NSA2 HMGCS2
SRPX
CEBPB COL12A1 SESN1
PLSCR1 XBP1
ASS1 PBK
SLC35F2 CCNA2
SLC35A5
LAMA3
ASB3 UGT2A3
FEZ2
F3 PITPNA
STXBP2 TSKU
SCARA3
P4HTM ALB
HIST1H3H BAAT
SPC25 PROCR
PPP2R5A GGH
CD55 HLA-C
MAL2 RPAP3
DDX60 MAPT
CD97
OSGIN1
BIRC3
CLTB MDM2
C12orf5
AMY2B
LDHA
DTL AKR1C2
ACTA2
DNTTIP2 FGG
TXNRD1
PRSS23
DTL
VEGFA
GFOD1
RNASE4
FAM57A BDNF
XRCC5
FGF7 BMF CRELD2 PIK3R1
ABCC5 RPL22 CTGF
MDM2 EPHX1
MAT2A
IGFBP3 F3 SERPINA1
RRM2
APBB2
PKIB
SLC11A2
GFOD1 LAMA2
SCOC
ABCC3 WARS
ELF3
HIF1A
SPTLC2
STXBP2 DBNDD2
CHMP4A TRAM1
SEMA4B C5
C2(CFB)
ARRDC4 SKA1
C2CD5 GDA LOC100510495
SOCS3 HLA-DRA
LAPTM5
ZNF555 GSTA5
SPAG4
DAAM1
PEG10
EPHB2
RPS20
NCEH1 C1S
CCL15
FLRT2
PAFAH1B3
SCARB1 LRRC16A
CYP2C8
FABP4
COL4A2 TNFSF13 SP110 CYP3A5
PCNA TUBB2A
PRAF2
SMARCA5
NAMPT SAA1
SLC27A3 MITF
KRT17
ZNF367
CBLB
RPS7 TTR
TARBP1
GGT1 ZNF165THRB
MAP7 NPC1 APOE
ATAD2
KRT7 DNAJB9
APOC1
ZMYM2 CES1
CFH
MT1M PTPN12 APOA1
NGRN
ISG20 NAT2
DPYS
ANO10
GPX1 GGCX
TPM1 HIST1H2AG
VAT1 FAH
KDM5A CLU
COIL
LAMB3
KIAA0355 CA2
KIF20A
FLNA
PLOD3
CHERP AR
NQO1 SLC3A2 BACE2
ZNF586 HERC6
TYMS
GRB14 CCL14
DDB2
MAFF HAVCR1DFFB
GABBR1 IER3
CBR3 CASP1
CXCL1
AEN ORM2
IFI27
UGT1A8
CEBPA
TNFAIP2 TM4SF1
HMGA2 DMTN
MEFV CYP4A11
ARSE
NR1H3
MOK SCYL3 AMDHD2
PPP1R15A EPHX2
UEVLD
BCL2L11
BBS10 PUS7 KRT6A
MRPL36
EXO1 AURKB
REL
ATP6V1B2 SLCO1B1
DEPDC1
OIP5 FMO5
NISCH FAM72A
MELK
DEPDC1B ANLN
MT1E
NFKBIZ
SLC1A3
TOPORS IGFBP7 FNDC4
C2CD5 CREBBP
CPS1
CAST
ABCB6 NISCH TMED7 LEAP2
LCP1 BTG2
E2F7
GAPDH
FHL2 RARA
HP
NCK2 GABARAPL1 BCL2
MRE11A CDC6
ST6GALNAC2PRKAB2 FABP1
CCNE2 IGFBP1
ARID4B ZWINTTK1
ABCA6
CAV1 ADH1A
PAFAH1B3 LMNB1
AMER1
PSMA7
NR2F2 SERPINA3
IL8
ID1 HMMR
SLC2A2
-1 0 1 2 3 4 5
0 1 2 3 4 5 6
RPTEC/TERT1
He
pa
RG
GAGE
3
GAGE
1
GAGE
2D
SPAN
XA1
GSTA
2 FMO3GAGE2A
SERP
INE1VTN
PLXD
C2 S100A
9 CIDECGAGE
4
UGT1
A9 F2
GSTP
1
HOXD
8 L1CAMRPS4Y1
GUCY
1B3FGF2 ME1
L1CAMKDM5 D
VAV3PLAUEMX2SEMA5ANPDC1DDX3Y
0 1000 2000 3000 4000
mRNA
Expressi
on
HepaRG RPTEC/TERT1
A
incubator (Fig. 2a, b). The xCELLigence apparatus measures net impedance of each well, reported as Cell Index (CI), with high temporal resolution (Kustermann et al. 2013; Kho et al. 2015). CI is dependent on the amount of cells attached to the well, the forces at which they bind and the net vol-ume of the cells per well and is considered a sensitive label-free viability assay (Ke et al. 2011). RPTEC/TERT1 cells exhibited an oscillating CI, compared to the smooth CI of HepaRG cells. RPTEC/TERT1 monolayers due to vectorial solute and water transport, form raised areas called, domes (Wieser et al. 2008; Aschauer et al. 2013). Where a dome forms, the cells are no longer in contact with the electrode and thus do not contribute to impedance. Since, domes are dynamic and are formed and collapse overtime, the CI pat-tern appears ruffled. The strongest compound effect observed
in RPTEC/TERT1 was with 4000 µM KBrO3. This
condi-tion resulted in an increase of CI, beginning at 9-h exposure (Fig. 2a), which is likely due to toxicity induced decrease in
dome formation. In HepaRG 4000 µM KBrO3 also showed
the strongest effect, with a decrease in CI starting at 15-h exposure (Fig. 2b). Enhanced glycolysis, as measured by supernatant lactate, was observed in RPTEC/TERT1 cells
only, and only in two conditions: CsA 15 µM and KBrO3
4000 µM (Fig. 2c). VALP caused a slight decrease in lactate production at the highest concentration in RPTEC/TERT1 cells (Fig. 2c). Phase contrast morphology shows a typical representation of differentiated RPTEC/TER1 cells and dif-ferentiated HepaRG cells; with a complete monolayer, cob-ble stone morphology and dome formation in the RPTEC/ TERT1 controls (Fig. 2d) and a mixture of compact hepat-ocyte-like cells and biliary epithelial-like cells for HepaRG cells (Fig. 2e). Morphological aberrations were observed
only with KBrO3 at 4000 µM in RPTEC/TERT1 cells, with
small holes visible in the monolayer (Fig. 2d, e).
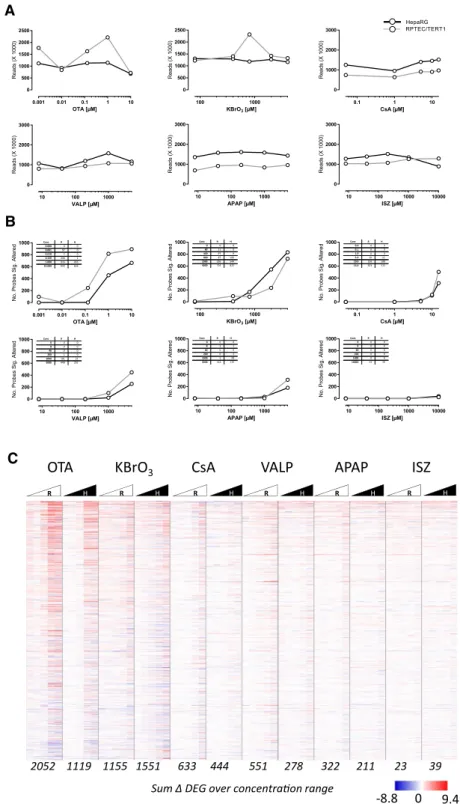
Figure 3 shows the read counts, differentially expressed probes (DEP) and a heat map of genes which were differen-tially expressed compared to controls in at least 2 of the 60 conditions (i.e., cell type, compounds, and concentration). The treatments had no discernible effect on read counts (Fig. 3a). There was, however, a concentration-dependent increase (i.e., an increase in at least two consecutive concen-trations) in the number of DEPs for all compounds except ISZ. OTA had the strongest impact on DEPs, followed by
KBrO3, CsA, VALP, APAP, and ISZ. (This does not reflect
the potency ranking as different concentrations were used.) Based on the first concentration with an increase in DEP,
A RPTEC/TERT1: impedance
B HepaRG: impedance
OTA 10 µM APAP5000µM
l o r t n o c
DMSO control CsA 15 µM
ISZ 10 000 µM
KBrO34000 µM
VALP 5000 µM
E HepaRG morphology
OTA 10 µM APAP5000µM
l o r t n o c
DMSO control CsA 15 µM
ISZ 10 000 µM
KBrO34000 µM
VALP 5000 µM
D RPTEC/TERT1 morphology
C Supernatant lactate
RPTEC/TERT1 HepaRG
Fig. 2 xCELLigence, lactate production and morphology after 24 h
single application exposures. a, b Impedance measurements utilis-ing the xCELLigence system with the same concentrations as utilised for the transcriptomics study. The values are mean from three bio-logical replicates. *Indicates a significant difference using a two-way ANOVA, using a Sidak’s post-test with a significant cut off of 0.05. c
RPTEC/TERT1 were more sensitive to OTA and KBrO3, and sensitivities for the rest of the compounds were similar.
The data are also visualised using ToxPi with the slices representing DEP, genes in the ATF4 (major branch of the unfolded protein response), Nrf2 and p53 pathway (Fig. 4). It should be noted that the ToxPi charts do not show direc-tionality of the genes in the pathway, just overall impact.
Utilising the hierarchical clustering feature, three main clus-ters were apparent (Fig. 4). The yellow cluster represents the concentrations that had the highest impact on the four parameters and includes the two highest concentrations of
OTA and KBrO3 for both cell types (OTA_H4,H5, OTA_
R4,R5, KBrO3_H4,H5, KBrO3_R4,R5) and the highest
con-centration of CsA in RPTEC/TERT1 cells (CsA_R5). The
Fig. 3 Effect of compounds
on read counts (a), differential gene expression per treatment (b) and individual differential gene expression (c). The total read counts (×1000) are plotted versus concentration per cell model. b The number of total differentially expressed genes (with a significance cut off Benjamini Hochberg adjusted p > 0.05), are plotted versus concentration per cell model. The numeric values are given in the tables. c Heat map of log2 fold control data from 1514 genes that were significantly altered in 2 or more condi-tions. The heat map is sorted by the sum across all condi-tions per gene. R is RPTEC/ TERT1, H is HepaRG. The red colour indicates increased and blue decreased, where white is unchanged. Where the log2 fold control could not be calculated (i.e., a division by zero error where all values zero in the control) the value is also repre-sented by a white. The values at the bottom of the heat map are the sum of the DEGs over the 5 concentrations per cell line (maximum possible is 7570). The values behind the heat map with the gene annotations are given in Table S4
KBrO3
R H R H R H R H R H R H
VALP
CsA APAP ISZ
A T O
2052 1119 1155 1551 633 444 551 278 322 211 23 39
Sum Δ DEG over concentraon range C
9.4 -8.8 0
Log2 Fold Control
0.001 0.01 0.1 1 10
0 500 1000 1500 2000 2500
OTA [µM]
Re
ad
s (X 1000
)
100 1000 0
500 1000 1500 2000 2500
KBrO3 [µM]
Read
s
(X
1
000
)
0.1 1 10 0
1000 2000 3000
CsA [µM]
Re
ads (X
1000
)
10 100 1000
0 1000 2000 3000
VALP [µM]
Re
ads
(X
10
00
)
10 100 1000
0 1000 2000 3000
APAP [µM]
Re
ads (X
1000
)
10 100 1000 10000
0 1000 2000 3000
ISZ [µM]
Re
ads (X
1000
)
0.001 0.01 0.1 1 10
0 200 400 600 800 1000
OTA [µM]
No
. Pr
ob
es
Si
g.
Al
tere
d Conc
0.000 0.001 0.010 0.130 1.000 10.000 R
0 97 2 244 816 893 H
0 0 0 1 455 663
100 1000
0 200 400 600 800 1000
KBrO3 [µM]
No.
Probes
Sig. Al
te
red
Conc 0 80 400 800 2000 4000 R
0 11 97 87 236 724 H
0 0 9 166 544 832
0.1 1 10
0 200 400 600 800 1000
CsA [µM]
No
. Probe
s
Sig.
Al
te
re
d Conc
0.0 0.1 1.0 5.0 10.0 15.0 R
0 0 0 10 120 503 H
0 0 0 21 108 315
10 100 1000
0 200 400 600 800 1000
VALP [µM]
No.
Pr
ob
es
Si
g.
Al
tere
d Conc
0 8 40 200 1000 5000 R
0 0 0 1 101 449 H
0 0 0 0 23 255
10 100 1000
0 200 400 600 800 1000
APAP [µM]
No
. Prob
es Sig.
Al
tere
d Conc
0 8 40 200 1000 5000 R
0 3 0 0 5 314 H
0 1 0 3 28 179
10 100 1000 10000
0 200 400 600 800 1000
ISZ [µM]
No
. Prob
es Sig.
Al
tere
d Conc
0 8 40 200 1000 10000 R
0 0 0 0 0 23 H
0 0 0 0 0 39
A
B
green cluster represents the conditions that had a medium impact and the purple cluster contains mild to zero impact. All of the ISZ compounds were in the green cluster. In the lower panels of Fig. 4 the ToxPis are organised per com-pound and cell type. OTA had a strong impact on all three pathways, but the impact was larger in RPTEC/TERT1 cells.
KBrO3 had a strong impact the Nrf2 and p53 pathways. Both
CsA and APAP had a stronger impact on the ATF4 path-way and this was larger in RPTEC/TERT1 cells. In RPTEC/ TERT1 cells VALP had a prominent effect only on the Nrf2 pathway. None of the selected pathways were impacted on by ISZ in either cell type.
Quantitative data for 27 selected representative genes is given graphical form as non-transformed and in heat maps as log2 fold control transformed data (Fig. 5). The first panel of nine represent genes in the Nrf2 (HMOX1, SRXN1 and GCLM), p53 (GADD45A, CDKN1A, SFN) and ATF4 pathways (ASNS, TRIB3, DDIT3) (Fig. 5a). For
the Nrf2 genes, HMOX1 was more responsive in RPTEC/ TERT1 cells, while SRXN1 and GCLM showed similar
levels of induction (Fig. 5a). KBrO3 was the strongest
inducer of these genes. At the highest concentration of OTA HMOX1 was significantly decreased in RPTEC/ TERT1 and GCLM significantly decreased in both cell types. For the p53 genes, GADD45A, CDKN1A and SFN showed similar levels of induction in both cell types and
again KBrO3 was the highest inducer. OTA decreased
SFN at the highest 2 concentrations in HepaRG cells. For the ATF4 genes, both TRIB3 and DDIT3 were more responsive in RPTEC/TERT1, whereas ASNS showed a similar level of maximum induction in both cell types. CsA, particularity in RPTEC/TERT1 cells, was the highest inducer of these three genes, but the highest concentration of APAP also resulted in a significant increase in ATF4 genes in both cell types. OTA decreased TRIB3 in both cell types.
Fig. 4 Representation of
compound-induced differen-tially expressed genes using ToxPi visualisations. The ToxPi v 2 software was used to generate the diagrams. The top panel shows a full pie with its colour codes and gene numbers each slice uses the linear model. DEP is differentially expressed probes. The numbers for p53, Nrf2 and ATF4 represent the no. of genes allocated to those pathways (see Table S3). On the right of the top panel is a Hierarchical Clustering using ward.D2. Labelling of samples is compound code, the dilution
(as per Table 1), R for RPTEC/
TERT1 and H for HepaRG The lower panels show the ToxPis per cell type, compound and concentrations, where numbers represent the µM concentration of the corresponding compound. The ToxPi data are given in Table S5.
R
H R
H
R
H
R
H CsA
R
H
R
H OTA
0.001 0.01 0.13 1 10
KBrO3
80 400 800 2000 4000
APAP
8 40 200 1000 5000
ISZ
8 40 200 1000 10000 VALP
DEP p53 (28)
Nrf2 (72) ATF4 (79)
Examples of HepaRG responsive genes are given in Fig. 5b. CYP3A4, EREG, A2M, ARG1, HNF4A, ADH1A were unresponsive in RPTEC/TERT1 cells. AFP, BAAT and HPR showed some mild induction in certain exposures in
RPTEC/TERT1. All of these 9 genes were robustly respon-sive with at least one of the compounds in HepaRG. APAP
was a strong inducer of CYP3A4; OTA and KBrO3 were
inducers of AFP; while KBrO3 and VALP were inducers of
HMOX1, heme oxygenase 1
Diluon 1 2 3 4 5 1 2 3 4 5 1 2 3 4 5 1 2 3 4 5 1 2 3 4 5 1 2 3 4 5
RPTEC/TERT1 HepaRG
Isonazid
Ochratoxin A Potassium Bromate Cyclosporine A Na Valproate Acetaminophen
0 200 400 600 800 1000 1200 1400 1600 1800 2000
0 8 40 200 1000 5000
mR NA ex pr es sion le ve l 0 200 400 600 800 1000 1200 1400 1600 1800 2000
0 0.05 1 5 10 15
mR NA expres sion le ve l 0 200 400 600 800 1000 1200 1400 1600 1800 2000
0 8 40 200 1000 10000
mR NA ex pr es sion le ve l 0 200 400 600 800 1000 1200 1400 1600 1800 2000
0 8 40 200 1000 5000
mR NA expres sion le ve l 0 200 400 600 800 1000 1200 1400 1600 1800 2000
0 80 400 800 2000 4000
mR NA ex pr es si on leve l 0 200 400 600 800 1000 1200 1400 1600 1800 2000
0 0.001 0.01 0.13 1 10
mR NA ex pr es si on leve l
Ochratoxin[µM] Potassium Bromate[µM]
Cyclosporine A [µM] Na Valproate [µM]
Acetaminophen[µM] Isonazid[µM]
SRXN1, sulfiredoxin 1
Diluon 1 2 3 4 5 1 2 3 4 5 1 2 3 4 5 1 2 3 4 5 1 2 3 4 5 1 2 3 4 5
RPTEC/TERT1 HepaRG
Isonazid Ochratoxin A Potassium Bromate Cyclosporine A Na Valproate Acetaminophen 0 5 10 15 20 25 30 35 40 45 50
0 8 40 200 1000 5000
mR NA ex pr es si on le ve l 0 5 10 15 20 25 30 35 40 45 50
0 0.05 1 5 10 15
mR NA ex pr es sion leve l 0 5 10 15 20 25 30 35 40 45 50
0 8 40 200 1000 10000
mR NA ex pr es si on le ve l 0 5 10 15 20 25 30 35 40 45 50
0 8 40 200 1000 5000
mR NA ex pr es sion leve l 0 5 10 15 20 25 30 35 40 45 50
0 80 400 800 2000 4000
mR NA ex pr es si on le ve l 0 5 10 15 20 25 30 35 40 45 50
0 0.001 0.01 0.13 1 10
mR NA ex pr es si on le ve l
Ochratoxin[µM] Potassium Bromate[µM]
Cyclosporine A [µM] Na Valproate [µM]
Acetaminophen[µM] Isonazid[µM]
GCLM, glutamate-cysteine ligase modifier subunit
Diluon 1 2 3 4 5 1 2 3 4 5 1 2 3 4 5 1 2 3 4 5 1 2 3 4 5 1 2 3 4 5
RPTEC/TERT1 HepaRG
Isonazid Ochratoxin A Potassium Bromate Cyclosporine A Na Valproate Acetaminophen 0 500 1000 1500 2000 2500 3000 3500
0 8 40 200 1000 5000
mR NA ex pr es si on le ve l 0 500 1000 1500 2000 2500 3000 3500
0 0.05 1 5 10 15
mR NA ex pr es si on leve l 0 500 1000 1500 2000 2500 3000 3500
0 8 40 200 1000 10000
mR NA ex pr es si on le ve l 0 500 1000 1500 2000 2500 3000 3500
0 8 40 200 1000 5000
mR NA ex pr es si on leve l 0 500 1000 1500 2000 2500 3000 3500
0 80 400 800 2000 4000
mR NA ex pr es si on le ve l 0 500 1000 1500 2000 2500 3000 3500
0 0.001 0.01 0.13 1 10
mR NA ex pr es si on le ve l
Ochratoxin[µM] Potassium Bromate[µM]
Cyclosporine A [µM] Na Valproate [µM]
Acetaminophen[µM] Isonazid[µM]
GADD45A, growth arrest and DNA damage inducible alpha
Diluon 1 2 3 4 5 1 2 3 4 5 1 2 3 4 5 1 2 3 4 5 1 2 3 4 5 1 2 3 4 5
RPTEC/TERT1 HepaRG
Isonazid Ochratoxin A Potassium Bromate Cyclosporine A Na Valproate Acetaminophen 0 50 100 150 200 250 300 350 400 450 500
0 8 40 200 1000 5000
mR NA ex pr es sion le ve l 0 50 100 150 200 250 300 350 400 450 500
0 0.05 1 5 10 15
mR NA expres sion le ve l 0 50 100 150 200 250 300 350 400 450 500
0 8 40 200 1000 10000
mR NA ex pr es sion le ve l 0 50 100 150 200 250 300 350 400 450 500
0 8 40 200 1000 5000
mR NA expres sion le ve l 0 50 100 150 200 250 300 350 400 450 500
0 80 400 800 2000 4000
mR NA ex pr es si on leve l 0 50 100 150 200 250 300 350 400 450 500
0 0.001 0.01 0.13 1 10
mR NA ex pr es si on leve l
Ochratoxin[µM] Potassium Bromate[µM]
Cyclosporine A [µM] Na Valproate [µM]
Acetaminophen[µM] Isonazid[µM]
CDKN1A, cyclin dependent kinase inhibitor 1A
Diluon 1 2 3 4 5 1 2 3 4 5 1 2 3 4 5 1 2 3 4 5 1 2 3 4 5 1 2 3 4 5
RPTEC/TERT1 HepaRG
Isonazid Ochratoxin A Potassium Bromate Cyclosporine A Na Valproate Acetaminophen 0 10 20 30 40 50 60 70 80 90 100
0 8 40 200 1000 5000
mR NA ex pr es sion le ve l 0 10 20 30 40 50 60 70 80 90 100
0 0.05 1 5 10 15
mR NA expres sion le ve l 0 10 20 30 40 50 60 70 80 90 100
0 8 40 200 1000 10000
mR NA ex pr es sion le ve l 0 10 20 30 40 50 60 70 80 90 100
0 8 40 200 1000 5000
mR NA expres sion le ve l 0 10 20 30 40 50 60 70 80 90 100
0 80 400 800 2000 4000
mR NA ex pr es si on leve l 0 10 20 30 40 50 60 70 80 90 100
0 0.001 0.01 0.13 1 10
mR NA ex pr es sion leve l
Ochratoxin[µM] Potassium Bromate[µM]
Cyclosporine A [µM] Na Valproate [µM]
Acetaminophen[µM] Isonazid[µM]
SFN, strafin
Diluon 1 2 3 4 5 1 2 3 4 5 1 2 3 4 5 1 2 3 4 5 1 2 3 4 5 1 2 3 4 5
RPTEC/TERT1 HepaRG
Isonazid Ochratoxin A Potassium Bromate Cyclosporine A Na Valproate Acetaminophen
0 10 20 30 40 50 60 70
0 8 40 200 1000 5000
mR NA ex pr es sion le ve l 0 10 20 30 40 50 60 70
0 0.05 1 5 10 15
mR NA expres sion le ve l 0 10 20 30 40 50 60 70
0 8 40 200 1000 10000
mR NA ex pr es sion le ve l 0 10 20 30 40 50 60 70
0 8 40 200 1000 5000
mR NA expres sion le ve l 0 10 20 30 40 50 60 70
0 80 400 800 2000 4000
mR NA ex pr es sion leve l 0 10 20 30 40 50 60 70
0 0.001 0.01 0.13 1 10
mR NA ex pr es sion leve l
Ochratoxin[µM] Potassium Bromate[µM]
Cyclosporine A [µM] Na Valproate [µM]
Acetaminophen[µM] Isonazid[µM]
ASNS, asparagine synthetase (glutamine-hydrolyzing)
Diluon 1 2 3 4 5 1 2 3 4 5 1 2 3 4 5 1 2 3 4 5 1 2 3 4 5 1 2 3 4 5
RPTEC/TERT1 HepaRG
Isonazid Ochratoxin A Potassium Bromate Cyclosporine A Na Valproate Acetaminophen
0 50 100 150 200 250 300 350 400
0 8 40 200 1000 5000
mR NA ex pr es si on le ve l 0 50 100 150 200 250 300 350 400
0 0.05 1 5 10 15
mR NA ex pr es si on leve l 0 50 100 150 200 250 300 350 400
0 8 40 200 1000 10000
mR NA ex pr es si on le ve l 0 50 100 150 200 250 300 350 400
0 8 40 200 1000 5000
mR NA ex pr es si on leve l 0 50 100 150 200 250 300 350 400
0 80 400 800 2000 4000
mRN A ex pr es si on le ve l 0 50 100 150 200 250 300 350 400
0 0.001 0.01 0.13 1 10
mRN A ex pr es si on le ve l
Ochratoxin[µM] Potassium Bromate[µM]
Cyclosporine A [µM] Na Valproate [µM]
Acetaminophen[µM] Isonazid[µM]
DDIT3, DNA damage inducible transcript 3
Diluon 1 2 3 4 5 1 2 3 4 5 1 2 3 4 5 1 2 3 4 5 1 2 3 4 5 1 2 3 4 5
RPTEC/TERT1 HepaRG
Isonazid Ochratoxin A Potassium Bromate Cyclosporine A Na Valproate Acetaminophen
0 500 1000 1500 2000 2500 3000
0 8 40 200 1000 5000
mR NA ex pr es si on le ve l 0 500 1000 1500 2000 2500 3000
0 0.05 1 5 10 15
mR NA ex pr es si on leve l 0 500 1000 1500 2000 2500 3000
0 8 40 200 1000 10000
mR NA ex pr es si on le ve l 0 500 1000 1500 2000 2500 3000
0 8 40 200 1000 5000
mR NA ex pr es si on leve l 0 500 1000 1500 2000 2500 3000
0 80 400 800 2000 4000
mRN A ex pr es si on le ve l 0 500 1000 1500 2000 2500 3000
0 0.001 0.01 0.13 1 10
mRN A ex pr es si on le ve l
Ochratoxin[µM] Potassium Bromate[µM]
Cyclosporine A [µM] Na Valproate [µM]
Acetaminophen[µM] Isonazid[µM]
TRIB3, tribbles pseudokinase 3
Diluon 1 2 3 4 5 1 2 3 4 5 1 2 3 4 5 1 2 3 4 5 1 2 3 4 5 1 2 3 4 5
RPTEC/TERT1 HepaRG
Isonazid Ochratoxin A Potassium Bromate Cyclosporine A Na Valproate Acetaminophen
0 500 1000 1500 2000 2500 3000 3500 4000 4500 5000
0 8 40 200 1000 5000
mR NA ex pr es si on le ve l 0 500 1000 1500 2000 2500 3000 3500 4000 4500 5000
0 0.05 1 5 10 15
mR NA ex pr es si on leve l 0 500 1000 1500 2000 2500 3000 3500 4000 4500 5000
0 8 40 200 1000 10000
mR NA ex pr es si on le ve l 0 500 1000 1500 2000 2500 3000 3500 4000 4500 5000
0 8 40 200 1000 5000
mR NA ex pr es si on leve l 0 500 1000 1500 2000 2500 3000 3500 4000 4500 5000
0 80 400 800 2000 4000
mRN A ex pr es si on le ve l 0 500 1000 1500 2000 2500 3000 3500 4000 4500 5000
0 0.001 0.01 0.13 1 10
mRN A ex pr es si on le ve l
Ochratoxin[µM] Potassium Bromate[µM]
Cyclosporine A [µM] Na Valproate [µM]
Acetaminophen[µM] Isonazid[µM]
A Stress Response Pathways
* * * # # * * * * * * * # *
Isoniazid[μM] Isoniazid[μM]
Isoniazid[μM] Isoniazid[μM]
Isoniazid[μM]
Isoniazid[μM] Isoniazid[μM] Isoniazid[μM]
Isoniazid[μM] Isoniazid[μM]
Nrf2
P5
3
AT
F4
# # # # * # * # * # * # * * * # * * # # * # # * * * * # # * * * * # # * # # * * * * * # * * *# * * * # # * *# *# * # * * * * * # * # * # * * * # * * * * * * * * # * *# # * # * # * * # *Fig. 5 Concentration response relationships of selected genes,
repre-senting a stress response pathways, b HepaRG-specific and c RPTEC/ TERT1-specific. In the graphs the values are expressed as mean mRNA expression ± SEM. In the heat map values represent the mean log2 fold control with red representing the highest value and blue the
EREG. A2M, ARG1, BAAT, HNF4A, ADH1A and HPR were mostly decreased in the chemical exposures, which was
particularly predominant with KBrO3 exposure.
Examples of RPTEC/TERT1 responsive genes are given in Fig. 5c. SPP1, SLC7A5, ME1, BBOX1, and MUC1 were
unresponsive in HepaRG cells. APP, CLDN2, ATP1B1 and AMIGO2 showed some mild responses in HepaRG. All of these 9 genes were robustly responsive with at least three of the compounds in RPTEC/TERT1. SPP1 was induced by
OTA, KBrO3 and CsA. APP was induced by all compounds
CYP3A4, cytochrome P450 family 3 subfamily A member 4
Diluon 1 2 3 4 5 1 2 3 4 5 1 2 3 4 5 1 2 3 4 5 1 2 3 4 5 1 2 3 4 5
RPTEC/TERT1 HepaRG
Isonazid Ochratoxin A Potassium Bromate Cyclosporine A Na Valproate Acetaminophen 0 50 100 150 200 250
0 8 40 200 1000 5000
mR NA ex pr es sion le ve l 0 50 100 150 200 250
0 0.05 1 5 10 15
mR NA expres sion le ve l 0 50 100 150 200 250
0 8 40 200 1000 10000
mR NA ex pr es sion le ve l 0 50 100 150 200 250
0 8 40 200 1000 5000
mR NA expres sion le ve l 0 50 100 150 200 250
0 80 400 800 2000 4000
mR NA ex pr es si on leve l 0 50 100 150 200 250
0 0.001 0.01 0.13 1 10
mR NA ex pr es si on leve l
Ochratoxin[µM] Potassium Bromate[µM]
Cyclosporine A [µM] Na Valproate [µM]
Acetaminophen[µM] Isonazid[µM]
AFP, alpha fetoprotein
Diluon 1 2 3 4 5 1 2 3 4 5 1 2 3 4 5 1 2 3 4 5 1 2 3 4 5 1 2 3 4 5
RPTEC/TERT1 HepaRG
Isonazid
Ochratoxin A Potassium Bromate Cyclosporine A Na Valproate Acetaminophen
0 20 40 60 80 100 120 140 160 180 200
0 8 40 200 1000 5000
mR NA ex pr es sion le ve l 0 20 40 60 80 100 120 140 160 180 200
0 0.05 1 5 10 15
mR NA expres sion le ve l 0 20 40 60 80 100 120 140 160 180 200
0 8 40 200 1000 10000
mR NA ex pr es sion le ve l 0 20 40 60 80 100 120 140 160 180 200
0 8 40 200 1000 5000
mR NA expres sion le ve l 0 20 40 60 80 100 120 140 160 180 200
0 80 400 800 2000 4000
mR NA ex pr es si on leve l 0 20 40 60 80 100 120 140 160 180 200
0 0.001 0.01 0.13 1 10
mR NA ex pr es si on leve l
Ochratoxin[µM] Potassium Bromate[µM]
Cyclosporine A [µM] Na Valproate [µM]
Acetaminophen[µM] Isonazid[µM]
HNF4A, hepatocyte nuclear factor 4 alpha
Diluon 1 2 3 4 5 1 2 3 4 5 1 2 3 4 5 1 2 3 4 5 1 2 3 4 5 1 2 3 4 5
RPTEC/TERT1 HepaRG
Isonazid
Ochratoxin A Potassium Bromate Cyclosporine A Na Valproate Acetaminophen
0 10 20 30 40 50 60 70
0 8 40 200 1000 5000
mR NA ex pr es si on le ve l 0 10 20 30 40 50 60 70
0 0.05 1 5 10 15
mR NA ex pr es si on leve l 0 10 20 30 40 50 60 70
0 8 40 200 1000 10000
mR NA ex pr es si on le ve l 0 10 20 30 40 50 60 70
0 8 40 200 1000 5000
mR NA ex pr es si on leve l 0 10 20 30 40 50 60 70
0 80 400 800 2000 4000
mR NA ex pr es si on le ve l 0 10 20 30 40 50 60 70
0 0.001 0.01 0.13 1 10
mR NA ex pr es si on le ve l
Ochratoxin[µM] Potassium Bromate[µM]
Cyclosporine A [µM] Na Valproate [µM]
Acetaminophen[µM] Isonazid[µM]
A2M, alpha-2-macroglobulin
Diluon 1 2 3 4 5 1 2 3 4 5 1 2 3 4 5 1 2 3 4 5 1 2 3 4 5 1 2 3 4 5 RPTEC/TERT1
HepaRG
Isonazid Ochratoxin A Potassium Bromate Cyclosporine A Na Valproate Acetaminophen 0 20 40 60 80 100 120 140 160 180 200
0 8 40 200 1000 5000
mR NA ex pr es sion le ve l 0 20 40 60 80 100 120 140 160 180 200
0 0.05 1 5 10 15
mR NA expres sion le ve l 0 20 40 60 80 100 120 140 160 180 200
0 8 40 200 1000 10000
mR NA ex pr es sion le ve l 0 20 40 60 80 100 120 140 160 180 200
0 8 40 200 1000 5000
mR NA expres sion le ve l 0 20 40 60 80 100 120 140 160 180 200
0 80 400 800 2000 4000
mR NA ex pr es si on leve l 0 20 40 60 80 100 120 140 160 180 200
0 0.001 0.01 0.13 1 10
mR NA ex pr es si on leve l
Ochratoxin[µM] Potassium Bromate[µM]
Cyclosporine A [µM] Na Valproate [µM]
Acetaminophen[µM] Isonazid[µM]
ARG1, arginase 1
Diluon 1 2 3 4 5 1 2 3 4 5 1 2 3 4 5 1 2 3 4 5 1 2 3 4 5 1 2 3 4 5
RPTEC/TERT1 ##
HepaRG
Isonazid Ochratoxin A Potassium Bromate Cyclosporine A Na Valproate Acetaminophen
0 20 40 60 80 100 120 140 160 180 200
0 8 40 200 1000 5000
mR NA ex pr es sion le ve l 0 20 40 60 80 100 120 140 160 180 200
0 0.05 1 5 10 15
mR NA expres sion le ve l 0 20 40 60 80 100 120 140 160 180 200
0 8 40 200 1000 10000
mR NA ex pr es sion le ve l 0 20 40 60 80 100 120 140 160 180 200
0 8 40 200 1000 5000
mR NA expres sion le ve l 0 20 40 60 80 100 120 140 160 180 200
0 80 400 800 2000 4000
mR NA ex pr es si on leve l 0 20 40 60 80 100 120 140 160 180 200
0 0.001 0.01 0.13 1 10
mR NA ex pr es si on leve l
Ochratoxin[µM] Potassium Bromate[µM]
Cyclosporine A [µM] Na Valproate [µM]
Acetaminophen[µM] Isonazid[µM]
BAAT, bile acid-CoA:amino acid N-acyltransferase
Diluon 1 2 3 4 5 1 2 3 4 5 1 2 3 4 5 1 2 3 4 5 1 2 3 4 5 1 2 3 4 5 RPTEC/TERT1
HepaRG
Isonazid Ochratoxin A Potassium Bromate Cyclosporine A Na Valproate Acetaminophen
0 200 400 600 800 1000 1200 1400 1600 1800
0 8 40 200 1000 5000
mR NA ex pr es sion le ve l 0 200 400 600 800 1000 1200 1400 1600 1800
0 0.05 1 5 10 15
mR NA expres sion le ve l 0 200 400 600 800 1000 1200 1400 1600 1800
0 8 40 200 1000 10000
mR NA ex pr es sion le ve l 0 200 400 600 800 1000 1200 1400 1600 1800
0 8 40 200 1000 5000
mR NA expres sion le ve l 0 200 400 600 800 1000 1200 1400 1600 1800
0 80 400 800 2000 4000
mR NA ex pr es si on leve l 0 200 400 600 800 1000 1200 1400 1600 1800
0 0.001 0.01 0.13 1 10
mR NA ex pr es si on leve l
Ochratoxin[µM] Potassium Bromate[µM]
Cyclosporine A [µM] Na Valproate [µM]
Acetaminophen[µM] Isonazid[µM]
ADH1A, alcohol dehydrogenase 1A (class I), alpha polypepde
Diluon 1 2 3 4 5 1 2 3 4 5 1 2 3 4 5 1 2 3 4 5 1 2 3 4 5 1 2 3 4 5 RPTEC/TERT1
HepaRG
Isonazid Ochratoxin A Potassium Bromate Cyclosporine A Na Valproate Acetaminophen
0 1000 2000 3000 4000 5000 6000
0 8 40 200 1000 5000
mR NA ex pr es si on le ve l 0 1000 2000 3000 4000 5000 6000
0 0.05 1 5 10 15
mR NA ex pr es si on leve l 0 1000 2000 3000 4000 5000 6000
0 8 40 200 1000 10000
mR NA ex pr es si on le ve l 0 1000 2000 3000 4000 5000 6000
0 8 40 200 1000 5000
mR NA ex pr es si on leve l 0 1000 2000 3000 4000 5000 6000
0 80 400 800 2000 4000
mR NA ex pr es si on le ve l 0 1000 2000 3000 4000 5000 6000
0 0.001 0.01 0.13 1 10
mR NA ex pr es si on le ve l
Ochratoxin[µM] Potassium Bromate[µM]
Cyclosporine A [µM] Na Valproate [µM]
Acetaminophen[µM] Isonazid[µM]
EREG, epiregulin
Diluon 1 2 3 4 5 1 2 3 4 5 1 2 3 4 5 1 2 3 4 5 1 2 3 4 5 1 2 3 4 5 RPTEC/TERT1
HepaRG
Isonazid Ochratoxin A Potassium Bromate Cyclosporine A Na Valproate Acetaminophen
0 10 20 30 40 50 60 70 80
0 8 40 200 1000 5000
mR NA ex pr es sion le ve l 0 10 20 30 40 50 60 70 80
0 0.05 1 5 10 15
mR NA ex pr es si on leve l 0 10 20 30 40 50 60 70 80
0 8 40 200 1000 10000
mR NA ex pr es sion le ve l 0 10 20 30 40 50 60 70 80
0 8 40 200 1000 5000
mR NA ex pr es si on leve l 0 10 20 30 40 50 60 70 80
0 80 400 800 2000 4000
mR NA expr es sion le ve l 0 10 20 30 40 50 60 70 80
0 0.001 0.01 0.13 1 10
mR NA expr es sion le ve l
Ochratoxin[µM] Potassium Bromate[µM]
Cyclosporine A [µM] Na Valproate [µM]
Acetaminophen[µM] Isonazid[µM] B HepaRG specific
HPR, haptoglobin-related protein
Diluon 1 2 3 4 5 1 2 3 4 5 1 2 3 4 5 1 2 3 4 5 1 2 3 4 5 1 2 3 4 5
RPTEC/TERT1 HepaRG
Isonazid Ochratoxin APotassium Bromate Cyclosporine A Na Valproate Acetamin ophen 0 50 100 150 200 250 300 350
0 8 40 200 1000 5000
mRNA ex pr es si on le ve l 0 50 100 150 200 250 300 350
0 0.05 1 5 10 15
mR NA ex pr es si on le ve l 0 50 100 150 200 250 300 350
0 8 40 200 1000 10000
mRNA ex pr es si on le ve l 0 50 100 150 200 250 300 350
0 8 40 200 1000 5000
mR NA ex pr es si on le ve l 0 50 100 150 200 250 300 350
0 80 400 800 2000 4000
mR NA ex pr es si on le ve l 0 50 100 150 200 250 300 350
0 0.001 0.01 0.13 1 10
mR NA ex pr es si on le ve l
Ochratoxin[µM] Potassium Bromate[µM]
Cyclosporine A [µM] Na Valproate [µM]
Acetaminophen[µM] Isonazid[µM]
Isoniazid[μM]
Isoniazid[μM] Isoniazid[μM]
Isoniazid[μM]
Isoniazid[μM] Isoniazid[μM] Isoniazid[μM]
Isoniazid[μM] Isoniazid[μM] * # # # # # # * # # # # # # # # # # # # # # # # # # # # # # # # # # # # # # # # * # # * * * # # # # # # # # # * # * # * * * # # # # # #
except CsA. SLC7A5, which is also an ATF4 responsive gene, was induced by CsA, APAP and VALP. ME1, which
is an Nrf2 responsive gene was induced by KBrO3, CsA
and VALP. BBOX1, CLDN2, ATP1B1 and MUC1 were fre-quently decreased in chemical exposures, however, all were
induced by ISZ. AMIGO2 was induced by CsA and VALP (VALP was biphasic), whereas OTA and APAP attenuated AMIGO2.
SPP1, secreted phosphoprotein 1
Diluon 1 2 3 4 5 1 2 3 4 5 1 2 3 4 5 1 2 3 4 5 1 2 3 4 5 1 2 3 4 5 RPTEC/TERT1
HepaRG
Isonazid Ochratoxin A Potassium Bromate Cyclosporine A Na Valproate Acetaminophen
0 20000 40000 60000 80000 100000 120000 140000
0 8 40 200 1000 5000
mR NA ex pr es sion le ve l 0 20000 40000 60000 80000 100000 120000 140000
0 0.05 1 5 10 15
mR NA expres sion le ve l 0 20000 40000 60000 80000 100000 120000 140000
0 8 40 200 1000 10000
mR NA ex pr es sion le ve l 0 20000 40000 60000 80000 100000 120000 140000
0 8 40 200 1000 5000
mR NA expres sion le ve l 0 20000 40000 60000 80000 100000 120000 140000
0 80 400 800 2000 4000
mR NA ex pr es si on leve l 0 20000 40000 60000 80000 100000 120000 140000
0 0.001 0.01 0.13 1 10
mR NA ex pr es si on leve l
Ochratoxin[µM] Potassium Bromate[µM]
Cyclosporine A [µM] Na Valproate [µM]
Acetaminophen[µM] Isonazid[µM]
APP, amyloid beta precursor protein
Diluon 1 2 3 4 5 1 2 3 4 5 1 2 3 4 5 1 2 3 4 5 1 2 3 4 5 1 2 3 4 5 RPTEC/TERT1
HepaRG
Isonazid Ochratoxin A Potassium Bromate Cyclosporine A Na Valproate Acetaminophen
0 2000 4000 6000 8000 10000 12000
0 8 40 200 1000 5000
mR NA ex pr es sion le ve l 0 2000 4000 6000 8000 10000 12000
0 0.05 1 5 10 15
mR NA expres sion le ve l 0 2000 4000 6000 8000 10000 12000
0 8 40 200 1000 10000
mR NA ex pr es sion le ve l 0 2000 4000 6000 8000 10000 12000
0 8 40 200 1000 5000
mR NA expres sion le ve l 0 2000 4000 6000 8000 10000 12000
0 80 400 800 2000 4000
mR NA ex pr es si on leve l 0 2000 4000 6000 8000 10000 12000
0 0.001 0.01 0.13 1 10
mR NA ex pr es si on leve l
Ochratoxin[µM] Potassium Bromate[µM]
Cyclosporine A [µM] Na Valproate [µM]
Acetaminophen[µM] Isonazid[µM]
ATP1B1, ATPase Na+/K+ transporng subunit beta 1
Diluon 1 2 3 4 5 1 2 3 4 5 1 2 3 4 5 1 2 3 4 5 1 2 3 4 5 1 2 3 4 5
RPTEC/TERT1 HepaRG
Isonazid Ochratoxin A Potassium Bromate Cyclosporine A Na Valproate Acetaminophen
0 2000 4000 6000 8000 10000 12000
0 8 40 200 1000 5000
mRN A ex pr es si on le ve l 0 2000 4000 6000 8000 10000 12000
0 0.05 1 5 10 15
mR NA ex pr es si on leve l 0 2000 4000 6000 8000 10000 12000
0 8 40 200 1000 10000
mRN A ex pr es si on le ve l 0 2000 4000 6000 8000 10000 12000
0 8 40 200 1000 5000
mR NA ex pr es si on leve l 0 2000 4000 6000 8000 10000 12000
0 80 400 800 2000 4000
mRN A ex pr es si on le ve l 0 2000 4000 6000 8000 10000 12000
0 0.001 0.01 0.13 1 10
mRN A ex pr es si on le ve l
Ochratoxin[µM] Potassium Bromate[µM]
Cyclosporine A [µM] Na Valproate [µM]
Acetaminophen[µM] Isonazid[µM]
BBOX1, gamma-butyrobetaine hydroxylase 1
Diluon 1 2 3 4 5 1 2 3 4 5 1 2 3 4 5 1 2 3 4 5 1 2 3 4 5 1 2 3 4 5
RPTEC/TERT1 HepaRG
Isonazid Ochratoxin A Potassium Bromate Cyclosporine A Na Valproate Acetaminophen
0 200 400 600 800 1000
0 8 40 200 1000 5000
mR NA ex pr es sion le ve l 0 200 400 600 800 1000
0 0.05 1 5 10 15
mR NA expres sion le ve l 0 200 400 600 800 1000
0 8 40 200 1000 10000
mR NA ex pr es sion le ve l 0 200 400 600 800 1000
0 8 40 200 1000 5000
mR NA e xpr es sion le ve l 0 200 400 600 800 1000
0 80 400 800 2000 4000
mR NA ex pr es si on leve l 0 200 400 600 800 1000
0 0.001 0.01 0.13 1 10
mR NA ex pr es si on leve l
Ochratoxin[µM] Potassium Bromate[µM]
Cyclosporine A [µM] Na Valproate [µM]
Acetaminophen[µM] Isonazid[µM]
CLDN2, claudin 2
Diluon 1 2 3 4 5 1 2 3 4 5 1 2 3 4 5 1 2 3 4 5 1 2 3 4 5 1 2 3 4 5 RPTEC/TERT1
HepaRG
Isonazid Ochratoxin A Potassium Bromate Cyclosporine A Na Valproate Acetaminophen 0 200 400 600 800 1000
0 8 40 200 1000 5000
mR NA ex pr es sion le ve l 0 200 400 600 800 1000
0 0.05 1 5 10 15
mR NA e xpr es sion le ve l 0 200 400 600 800 1000
0 8 40 200 1000 10000
mR NA ex pr es sion le ve l 0 200 400 600 800 1000
0 8 40 200 1000 5000
mR NA expres sion le ve l 0 200 400 600 800 1000
0 80 400 800 2000 4000
mR NA ex pr es si on leve l 0 200 400 600 800 1000
0 0.001 0.01 0.13 1 10
mR NA ex pr es si on leve l
Ochratoxin[µM] Potassium Bromate[µM]
Cyclosporine A [µM] Na Valproate [µM]
Acetaminophen[µM] Isonazid[µM]
ME1, malic enzyme 1
Diluon 1 2 3 4 5 1 2 3 4 5 1 2 3 4 5 1 2 3 4 5 1 2 3 4 5 1 2 3 4 5
RPTEC/TERT1 HepaRG
Isonazid Ochratoxin A Potassium Bromate Cyclosporine A Na Valproate Acetaminophen
0 200 400 600 800 1000 1200
0 8 40 200 1000 5000
mR NA ex pr es sion le ve l 0 200 400 600 800 1000 1200
0 0.05 1 5 10 15
mR NA e xpr es sion le ve l 0 200 400 600 800 1000 1200
0 8 40 200 1000 10000
mR NA ex pr es sion le ve l 0 200 400 600 800 1000 1200
0 8 40 200 1000 5000
mR NA e xpr es sion le ve l 0 200 400 600 800 1000 1200
0 80 400 800 2000 4000
mR NA ex pr es si on leve l 0 200 400 600 800 1000 1200
0 0.001 0.01 0.13 1 10
mR NA ex pr es si on leve l
Ochratoxin[µM] Potassium Bromate[µM]
Cyclosporine A [µM] Na Valproate [µM]
Acetaminophen[µM] Isonazid[µM]
MUC1, mucin 1, cell surface associated
Diluon 1 2 3 4 5 1 2 3 4 5 1 2 3 4 5 1 2 3 4 5 1 2 3 4 5 1 2 3 4 5
RPTEC/TERT1 HepaRG
Isonazid Ochratoxin A Potassium Bromate Cyclosporine A Na Valproate Acetaminophen
0 200 400 600 800 1000 1200
0 8 40 200 1000 5000
mRN A ex pr es si on le ve l 0 200 400 600 800 1000 1200
0 0.05 1 5 10 15
mR NA ex pr es si on leve l 0 200 400 600 800 1000 1200
0 8 40 200 1000 10000
mRN A ex pr es si on le ve l 0 200 400 600 800 1000 1200
0 8 40 200 1000 5000
mR NA ex pr es si on leve l 0 200 400 600 800 1000 1200
0 80 400 800 2000 4000
mRN A ex pr es si on le ve l 0 200 400 600 800 1000 1200 1400 1600 1800 2000
0 0.001 0.01 0.13 1 10
mRN A ex pr es si on le ve l
Ochratoxin[µM] Potassium Bromate[µM]
Cyclosporine A [µM] Na Valproate [µM]
Acetaminophen[µM] Isonazid[µM]
SLC7A5, solute carrier family 7 member 5
Diluon 1 2 3 4 5 1 2 3 4 5 1 2 3 4 5 1 2 3 4 5 1 2 3 4 5 1 2 3 4 5
RPTEC/TERT1 HepaRG
Isonazid Ochratoxin A Potassium Bromate Cyclosporine A Na Valproate Acetaminophen
0 200 400 600 800 1000 1200 1400 1600 1800 2000
0 8 40 200 1000 5000
mR NA ex pr es sion le ve l 0 200 400 600 800 1000 1200 1400 1600 1800 2000
0 0.05 1 5 10 15
mR NA expres sion le ve l 0 200 400 600 800 1000 1200 1400 1600 1800 2000
0 8 40 200 1000 10000
mR NA ex pr es sion le ve l 0 200 400 600 800 1000 1200 1400 1600 1800 2000
0 8 40 200 1000 5000
mR NA expres sion le ve l 0 200 400 600 800 1000 1200 1400 1600 1800 2000
0 80 400 800 2000 4000
mR NA ex pr es si on leve l 0 200 400 600 800 1000 1200 1400 1600 1800 2000
0 0.001 0.01 0.13 1 10
mR NA ex pr es si on leve l
Ochratoxin[µM] Potassium Bromate[µM]
Cyclosporine A [µM] Na Valproate [µM]
Acetaminophen[µM] Isonazid[µM]
AMIGO2, adhesion molecule with Ig like domain 2
Diluon 1 2 3 4 5 1 2 3 4 5 1 2 3 4 5 1 2 3 4 5 1 2 3 4 5 1 2 3 4 5
RPTEC/TERT1 HepaRG
Isonazid Ochratoxin A Potassium Bromate Cyclosporine A Na Valproate Acetaminophen 0 500 1000 1500 2000 2500 3000
0 8 40 200 1000 5000
mRN A ex pr es si on le ve l 0 500 1000 1500 2000 2500 3000
0 0.05 1 5 10 15
mR NA ex pr es si on leve l 0 500 1000 1500 2000 2500 3000
0 8 40 200 1000 10000
mRN A ex pr es si on le ve l 0 500 1000 1500 2000 2500 3000
0 8 40 200 1000 5000
mR NA ex pr es si on leve l 0 500 1000 1500 2000 2500 3000
0 80 400 800 2000 4000
mRN A ex pr es si on le ve l 0 500 1000 1500 2000 2500 3000
0 0.001 0.01 0.13 1 10
mRN A ex pr es si on le ve l
Ochratoxin[µM] Potassium Bromate[µM]
Cyclosporine A [µM] Na Valproate [µM]
Acetaminophen[µM] Isonazid[µM]
C RPTEC/TERT1 specific
Isoniazid[μM]
Isoniazid[μM]
Isoniazid[μM]
Isoniazid[μM]
Isoniazid[μM] Isoniazid[μM] Isoniazid[μM]
Isoniazid[μM] Isoniazid[μM] * # * * * * * # * * * * * * * # # # # * * * * * # * * * * * * * * * * * * * * * * # * * * * * * * * * * * * * * * * * * # # * * * * * * * * # # * * * * * * * * * * * * # * * * * * * * * * * * * * # # # * * # * * * # # * * *