IN THE CONTEXT OF DESTINATION MARKETING, RECALCULATION OF THE FACTORS OF TRAVEL
AND TOURISM COMPETITION INDEX BY WEIGHTING THEM
Aziz Öztürk
Beyşehir Ali Akkanat Faculty of Business, Selçuk University, Konya, Turkey
Ramazan Göral
Beyşehir Ali Akkanat Faculty of Tourism, Selçuk University, Konya, Turkey
ABSTRACT
One of the models of destinations, developed toward measuring and assessing tourism
competitive power is the model of Travel and Tourism Competition Index (TTCI), first developed
by World Economic Forum (WEF) in 2007 and lastly updated in 2015. In this index study,
depending on 4 main groups, 14 subgroups, and 84 indicators subjecting to these, the analysis
and ordering of competitive power of 138 countries were carried out. In TTCI studies, while
competitiveness measurements of destinations are carried out, taking the unweight means of
the relevant factor values, main factor values and TTCI value were calculated. However, while
the score is calculated by using the points, in which the factors taking place destination
competitiveness models receive, the weight of each factor may not be equal. In this study,
using the significance level scores of competitiveness factors, calculated by using weighting
method, called entropy, order of priority of the destinations were made. Then, the scores and
ordering of destinations taking place in Travel and Tourism Competition Index of WEF were
compared with the scores and ordering of destinations, made according to the calculation of
weighted point. According to this, it was seen that there was a difference in terms of both the
scores destinations received and the place of destinations in ordering
INTRODUCTION
The studies toward evaluating the dimensions of advantages, weaknesses, opportunities, and
threats, which can affect the competitive advantages of tourism destinations, have been carried
out for about 30 years. One of the most important ones of these studies is the study carried out by
Crouch and Ritchie. The aim of this study is to develop a conceptual model based on the theories
of comparative advantages and competitive advantage, and also compatible with the distinction
features of destination completion (Crouch, 2011).
In the following years, Dwyer and Kim (2003) developed another competition model. The model
developed by these authors has a viewpoint considering the theories of national competition and
firm competition theories. There are three main elements of the model. The first of these are
resources. There are three sorts of resources in the main group of resources as bestowed
resources (natural and cultural resources), formed resources (tourism infrastructure, specific
activities, shopping, etc.), and supportive resources (accessibility, service quality, etc.).
Destination management is the second component of this model (Dwyer and Kim, 2003).
Another of the studies carried out to form destination competitive power model is a study
carried out by a committee formed under the headship of Dupeyras (2013), manager of OECD
Tourism Unit. The aim of this study of OECD is to define a set of indicators that are applicable in a
general framework for countries to be able to evaluate the competitive powers countries have The
study of OECD, rather than forming a tourism competition index for making the ordering of the
most competitive countries, should be viewed as a strategic instrument in analyzing country
competitiveness and informing government (Dupeyras and MacCallum, 2013).
The last carried out study toward measuring and assessing the tourism competition power of
country is the model of Travel and Tourism Competition Index (TTCI), first developed by World
Economic Forum (WEF) in 2007 and lastly updated in 2015. TTCI is tourism competitiveness model
based on in this study.
While TTCI is calculated, first, taking the weighted averages (at the scale of 1-7) of the values factor
indicators have, the values of sub factor were found. Later, taking the weighted averages of the
values of sub factor, the values of main factors were reached. TTCI was calculated (WEF, 2015).
However, when the criteria taken as a basis for evaluation is numerous, in order to calculate the
resultant of these, there is a need for the weight of each criterion. While determining the weights of
the criteria, just as the judgements of domain specialist can be referred to, the appropriate weights
can be determined by the objective methods (Savaş and Baykal, 2011). “For calculating the
2004:104). In the study of WEF Tourism Competitiveness Index there are Alternatives (countries) and
Criteria (competitiveness factors), which are the elements of decision matrix, and the data
associated with these (WEF, 2015). Hence, the weights of each factors WEF used in the
calculations of Tourism Competition Index can be calculated by the method of Entropy.
The study related to weighing the factors (Tourism Destination Competitiveness Factors and
Weighing it by the Method of Entropy) was presented in 17th National Tourism Congress in 2016. In
this paper, the effect of TICI competitiveness factors on competitive power of the destination and
order of importance was digitized.
In this study, using the digitized weights of the competitiveness factors in previously published
paper, TTCI scores of each destination were recalculated. It was evaluated whether or not there was
a difference between original TTCI scores and weighted TTCI and general ordering of countries
1.) TRAVEL AND TOURISM COMPETITION INDEX (TTCI)
Destination competitiveness is the ability of a destination to be able to present goods and services
showing better performance compared to the other destinations from the aspect of tourism
experience accepted important by tourists (Dwyer and Kim,2003:374). In other words, tourism
competitiveness is the skill to be able to be a place, in which the attractiveness regarding destination
are turned into the best state for those dwelling or not in a country (destination); be able to present
the high quality, innovative, and attractive services for tourists; and be able to obtain significant
market share in the domestic and international tourism market Dupeyras and MacCallum, 2013, 7).
From 1990s to the present days, destination competitiveness has become an area, increasingly
interested in by tourism researchers (Crouch and Ritchie, 1999; Buhalis, 2000; Dwyer and Kim,
2003). Depending on this increasing interest, also in the studies toward destination competitiveness,
a noticeable increase was experienced. Most of these studies were carried out to evaluate and
define the competitive positions of specifically selected destinations. The other studies are the ones
focused on the certain aspects of destination competition power such as destination positioning,
destination management systems, destination marketing (Buhalis, 2000), price competition, quality
management, environment, strategic management, and nature based tourism. Even though these
studies have important contribution to the literature of destination competitiveness, they are
the studies that are limited within themselves (with destination or study subject). Therefore, in
the literature, other than destination in certain regions and quality, it is seen that there is a third
study effort, which is focused on destination competiveness models or theories toward general state
One of the most important one of these studies is the study, carried out by Crouch and Ritchie. The
aim of this study is to develop a conceptual model based on the theories of comparative advantages
and competitive advantage and also compatible with the distinctive features of destination
competition (Crouch, 2011:28).
In the following years, Dwyer and Kim (2003) developed another destination competitiveness model.
The model developed by these authors has a viewpoint considering the theories of national
competition and firm competition theories. There are three main elements of the model. The first of
these are resources. There are three sorts of resources in the main group of resources as
bestowed resources (natural and cultural resources), formed resources (tourism infrastructure,
specific activities, shopping, etc. ), and supportive resources (accessibility, service quality, etc.).
Destination management is the second component of this model (Dwyer and Kim, 2003).
Another of the studies carried out to form destination competitive power model is a study
carried out by a committee formed under the headship of Dupeyras (2013), manager of OECD
Tourism Unit. The aim of this study of OECD is to define a set of indicators that are applicable in a
general framework for countries to be able to evaluate the competitive powers countries have The
study of OECD, rather than forming a tourism competition index for making the ordering of the
most competitive countries, should be viewed as a strategic instrument in analyzing country
competitiveness and informing government (Dupeyras and MacCallum, 2013).
The last carried out study toward measuring and assessing the tourism competition power of
country is is the model of Travel and Tourism Competition Index (TTCI), first developed by World
Economic Forum (WEF) in 2007 and lastly updated in 2015. TTIC is tourism competitiveness model
based on in this study.
Tourism Competitive Power Index dealt with in this study and the relevant factors are shown in
Figure 1: Conceptual Framework of Tourism Sector Competitiveness Index
As will be understood from Figure 1, Tourism Competitiveness Index four main factors toward
measuring competitive power of tourism sector of a country: Environmental Opportunities,
Tourism Policies, and Activating conditions, Infrastructure, and Natural and Cultural Resources.
The results regarding environmental factors are obtained by accessing 5 sub dimensions: Business
Environment, Security and Safety, Health and Hygiene, Human Resources and Labor Force Market,
Preparation for Information Processing Industries. This group of dimensions expresses general
arrangements that are necessary for tourism activities in a country.
In determination of Tourism Competitiveness Index, the second main factor is Tourism Policies and
Activating Conditions. There are 4 sub dimensions of this factor as Prioritizing Tourism, International
Openness, Price Competition, and Environmental Sustainability. These factors are mostly toward
assessing the specific policies related to tourism sector and strategic appearance.
The third main factor is Infrastructure and there are 3 sub dimension of this factor: Air
Transportation, Land Transportation, and Touristic Service. This factor is toward assessing the
necessary infrastructure and facilities in enabling ability to easy access to tourism attractiveness of
a country
Tourism Sector Competitiveness Index
Business Environment
Tourism Policies and Activating the
Conditions
Infrastructure Natural and Cultural Resources
Air Transportation Infrastructure Prioritizing Tourism
Cultural Resources and Business Travel
Natural Resources
Human Resources and Labor Force
Market Health and Hygiene
Preparation for Information
Processing Technologies Security and Safety
Price Competition
International Openness Land Transportation and Its Connection
Touristic Service Infrastructure Environmental
Factors
Fourth main factor are Natural and Cultural Resources. This main factor includes evaluations toward
2 sub factors (Natural Resources, Cultural Resources, and Business Travel). This factor, when the
natural and cultural factors are considered stated as touristic attractiveness, reveals how the
condition of a country is and the effect of this on competitiveness.
2. Method and Findings
In the study, analysis data were reached by means of data collecting method from the secondary
resource. As the secondary resource, the report of Travel and Tourism Competitiveness Index
(TTCI) of World Economic Forum was utilized. In the report, the scores of Travel and Tourism
Competitiveness Index of 138 countries were formed and put in order. While TTCI is calculated,
first, taking weighted average of the values (in the scale of 1-7 ) the sub factor indicators
belonging to four main factors have, the values of main factor were reached. Later, taking
weighted mean of four main factors, TTCI was calculated (WEF, 2015).
In this study, while TTCI is calculated, taking weighted average of sub factors (using factor
weights in the previously published paper in 17th National Tourism Congress) regarding four main
factors, TTCI Index was calculated.
The weights of factors calculated according to the method of entropy are: Environmental Factors,
21%; Tourism Policies and Activating Conditions, 15%; Infrastructure, 29%; and Natural and Cultural
Resources, 35% (Göral, 2016).
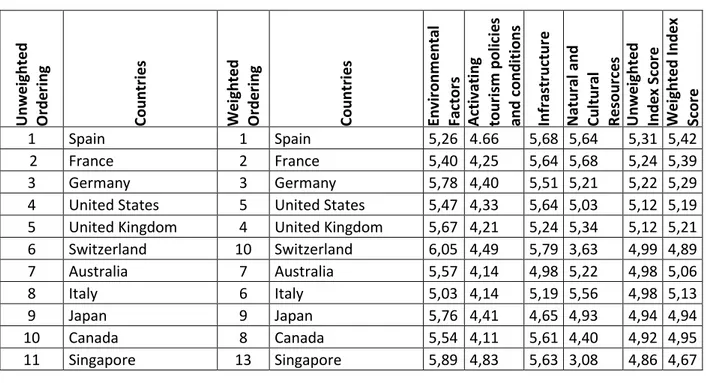
According to this, Unweighted Index Scores, Weighted Index Scores, and their orderings are seen in
Table 1.
Table 1: TTCI Index Scores of Destinations (Weighted –Unweighted) and Their Orderings
Un w e ig h ted Orde ri n g C o u n tr ie s W e ig h ted Orde ri n g C o u n tr ie s En vi ro n men ta l Fa cto rs Ac ti va ti n g to u ri sm p o lic ie s an d c o n d iti o n s In frast ru ctu re N atu ra l an d C u ltu ra l Resou rc es Un w e ig h ted In d e x S co re W e ig h ted In d e x Sc o re
1 Spain 1 Spain 5,26 4.66 5,68 5,64 5,31 5,42
2 France 2 France 5,40 4,25 5,64 5,68 5,24 5,39
3 Germany 3 Germany 5,78 4,40 5,51 5,21 5,22 5,29
4 United States 5 United States 5,47 4,33 5,64 5,03 5,12 5,19
5 United Kingdom 4 United Kingdom 5,67 4,21 5,24 5,34 5,12 5,21
6 Switzerland 10 Switzerland 6,05 4,49 5,79 3,63 4,99 4,89
7 Australia 7 Australia 5,57 4,14 4,98 5,22 4,98 5,06
8 Italy 6 Italy 5,03 4,14 5,19 5,56 4,98 5,13
9 Japan 9 Japan 5,76 4,41 4,65 4,93 4,94 4,94
10 Canada 8 Canada 5,54 4,11 5,61 4,40 4,92 4,95
12 Austria 11 Austria 5,83 4,53 5,42 3,50 4,82 4,70
13 Hong Kong 15 Hong Kong 6,06 4,24 5,31 3,11 4,68 4,54
14 Netherlands 14 Netherlands 5,78 4,32 5,24 3,35 4,67 4,56
15 Portugal 16 Portugal 5,42 4,58 4,86 3,71 4,64 4,53
16 New Zealand 18 New Zealand 5,75 4,72 4,88 3,21 4,64 4,45
17 China 12 China 4,87 3,82 3,74 5,75 4,54 4,69
18 Iceland 23 Iceland 5,79 4,70 5,10 2,58 4,54 4,30
19 Ireland 22 Ireland 5,58 4,70 5,05 2,81 4,53 4,32
20 Norway 21 Norway 5,82 4,39 4,77 3,09 4,52 4,34
21 belgium 20 belgium 5,58 4,15 5,15 3,16 4,51 4,39
22 Finland 27 Finland 6,08 4,41 4,75 2,65 4,47 4,24
23 Sweden 25 Sweden 5,75 4,30 4,71 3,07 4,45 4,29
24
United Arab
Emirates 29 United Arab Emirates 5,74 4,27 5,48 2,24 4,43 4,22
25 Malaysia 26 Malaysia 5,21 4,43 4,46 3,52 4,41 4,29
26 Luxembourg 35 Luxembourg 5,94 4,55 4,66 2,35 4,38 4,11
27 Denmark 30 Denmark 5,78 4,22 4,69 2,82 4,38 4,19
28 Brazil 17 Brazil 4,51 3,76 3,56 5,66 4,37 4,52
29 Korea, Rep. 24 Korea, Rep. 5,40 4,01 4,48 3,59 4,37 4,29
30 Mexico 19 Mexico 4,34 4,22 3,83 5,05 4,36 4,42
31 Greece 28 Greece 5,11 4,39 4,78 3,16 4,36 4,22
32 Taiwan, China 32 Taiwan, China 5,59 4,40 4,28 3,13 4,35 4,17
33 Croatia 33 Croatia 5,08 4,33 4,54 3,24 4,30 4,16
34 Panama 34 Panama 4,70 4,69 4,72 3,02 4,28 4,12
35 Thailand 31 Thailand 4,55 4,29 4,56 3,63 4,26 4,19
36 Cyprus 38 Cyprus 5,26 4,40 5,05 2,27 4,25 4,02
37 Czech Republic 41 Czech Republic 5,35 4,53 4,57 2,45 4,22 3,98
38 Estonia 45 Estonia 5,65 4,69 4,41 2,12 4,22 3,91
39 Slovenia 42 Slovenia 5,21 4,43 4,43 2,64 4,17 3,96
40 Malta 49 Malta 5,40 4,59 4,81 1,83 4,16 3,86
41 Hungary 48 Hungary 5,28 4,76 4,06 2,47 4,14 3,86
42 Costa Rica 43 Costa Rica 4,83 4,47 3,70 3,39 4,10 3,94
43 Qatar 52 Qatar 5,86 4,12 4,59 1,80 4,09 3,81
44 Turkey 40 Turkey 4,53 3,98 4,52 3,31 4,08 4,02
45 Russian Federation 39 Russian Federation 4,86 3,87 4,05 3,55 4,08 4,02
46 Barbados 51 Barbados 5,25 4,24 5,18 1,65 4,08 3,82
47 Poland 47 Poland 5,22 4,43 3,70 2,96 4,08 3,87
48 South Africa 37 South Africa 4,38 4,14 3,97 3,83 4,08 4,03
49 Bulgaria 50 Bulgaria 5,13 4,44 3,93 2,70 4,05 3,83
50 Indonesia 44 Indonesia 4,46 4,60 3,38 3,74 4,05 3,92
51 Chile 54 Chile 5,09 4,59 3,76 2,70 4,04 3,79
52 India 36 India 3,80 3,93 3,60 4,76 4,02 4,10
53 Latvia 57 Latvia 5,47 4,51 4,14 1,94 4,01 3,70
54 Seychelles 55 Seychelles 4,80 4,34 5,00 1,84 4,00 3,75
56 Argentina 46 Argentina 4,45 3,65 3,27 4,23 3,90 3,91
57 Mauritius 64 Mauritius 5,08 4,49 4,39 1,64 3,90 3,59
58 Peru 53 Peru 4,33 4,15 3,26 3,80 3,88 3,81
59 Lithuania 65 Lithuania 5,42 4,41 3,72 1,97 3,88 3,57
60 Bahrain 63 Bahrain 5,30 3,89 4,60 1,63 3,85 3,60
61 Slovak Republic 62 Slovak Republic 5,14 4,23 3,64 2,37 3,84 3,60
62 Morocco 58 Morocco 4,64 4,21 3,59 2,81 3,81 3,63
63 Sri Lanka 60 Sri Lanka 4,65 4,20 3,68 2,68 3,80 3,61
64 Saudi Arabia 61 Saudi Arabia 5,21 3,72 3,96 2,30 3,80 3,61
65 Oman 66 Oman 5,23 3,99 3,92 2,02 3,79 3,54
66 Romania 67 Romania 4,88 4,37 3,49 2,38 3,78 3,53
67 Montenegro 68 Montenegro 5,01 3,95 4,12 1,93 3,75 3,52
68 Colombia 59 Colombia 4,08 4,24 2,92 3,67 3,73 3,62
69 Trinidad and Tobago 70 Trinidad and Tobago 4,53 3,96 4,57 1,80 3,71 3,50
70 Namibia 69 Namibia 4,22 4,18 3,82 2,53 3,69 3,51
71 Georgia 76 Georgia 5,15 4,32 3,47 1,76 3,67 3,35
72 Israel 72 Israel 5,12 3,54 3,76 2,23 3,66 3,47
73 Uruguay 75 Uruguay 5,09 4,28 3,14 2,10 3,65 3,35
74 Philippines 74 Philippines 4,29 4,50 3,19 2,55 3,63 3,39
75 Vietnam 71 Vietnam 4,56 3,72 2,93 3,20 3,60 3,49
76 Jamaica 77 Jamaica 4,26 4,24 3,93 1,95 3,59 3,35
77 Jordan 81 Jordan 4,98 4,31 3,41 1,66 3,59 3,26
78 Kenya 73 Kenya 3,79 4,32 3,07 3,15 3,58 3,44
79 Tunisia 82 Tunisia 4,54 4,28 3,36 1,97 3,54 3,26
80 Guatemala 78 Guatemala 4,14 4,32 2,95 2,64 3,51 3,29
81 Dominican Republic 79 Dominican Republic 4,21 4,07 3,68 2,05 3,50 3,28
82 Macedonia, FYR 83 Macedonia, FYR 5,11 3,74 3,41 1,72 3,50 3,23
83 Egypt 80 Egypt 4,17 4,23 3,12 2,43 3,49 3,26
84 Azerbaijan 87 Azerbaijan 5,13 3,91 3,09 1,78 3,48 3,18
85 Kazakhstan 86 Kazakhstan 5,26 3,77 3,06 1,81 3,48 3,19
86 Cape Verde 88 Cape Verde 4,43 4,11 3,87 1,44 3,46 3,17
87 Botswana 85 Botswana 4,29 4,08 2,85 2,47 3,42 3,20
88 Armeni 94 Armeni 5,00 3,90 3,14 1,63 3,42 3,11
89 honduras 89 honduras 3,92 4,50 3,00 2,24 3,41 3,15
90 El Salvador 95 El Salvador 4,13 4,40 3,32 1,78 3,41 3,11
91 Nicaragua 93 Nicaragua 4,06 4,36 2,80 2,28 3,37 3,12
92 Tanzania 84 Tanzania 3,60 4,18 2,40 3,22 3,35 3,21
93 Lebanon 97 Lebanon 4,24 3,96 3,58 1,59 3,35 3,08
94 Serbia 96 Serbia 4,72 3,71 3,19 1,75 3,34 3,09
95 Lao PDR 100 Lao PDR 4,39 4,07 2,84 2,01 3,33 3,06
96 Iran 90 Iran 4,15 3,90 2,70 2,54 3,32 3,13
97 Rwanda 102 Rwanda 4,39 4,13 2,74 2,01 3,32 3,04
98 Mongolia 99 Mongolia 4,77 3,80 2,54 2,14 3,31 3,06
99 Bolivia 92 Bolivia 3,99 3,86 2,55 2,77 3,29 3,13
101 Nepal 98 Nepal 4,00 3,98 2,43 2,67 3,27 3,08
102 Kuwait 103 Kuwait 5,03 3,19 3,32 1,52 3,26 3,03
103 Guyana 107 Guyana 4,11 4,30 2,84 1,79 3,26 2,96
104 Cambodia 105 Cambodia 4,02 4,21 2,54 2,19 3,24 2,98
105 albania 106 albania 4,68 3,59 3,04 1,59 3,22 2,96
106 Zambia 104 Zambia 4,02 3,86 2,56 2,43 3,22 3,01
107 Swaziland 111 Swaziland 3,80 4,30 3,13 1,59 3,20 2,91
108 Gambia 113 Gambia 3,99 4,32 2,77 1,70 3,20 2,88
109 Venezuela 91 Venezuela 3,58 3,40 2,43 3,31 3,18 3,13
110 Moldova 114 Moldova 4,86 3,70 2,65 1,42 3,16 2,84
111 Senegal 108 Senegal 3,86 3,70 2,77 2,23 3,14 2,95
112 Paraguay 115 Paraguay 4,17 3,89 2,55 1,83 3,11 2,84
113 Uganda 109 Uganda 3,61 3,96 2,36 2,50 3,11 2,91
114 Zimbabwe 110 Zimbabwe 3,59 3,81 2,46 2,49 3,09 2,91
115 Kyrgyz Republic 118 Kyrgyz Republic 4,54 3,70 2,31 1,77 3,08 2,80
116 Cote dlvoire 112 Cote dlvoire 3,62 3,40 2,87 2,29 3,04 2,90
117 Ethiopia 116 Ethiopia 3,79 3,74 2,34 2,25 3,03 2,82
118 Ghana 117 Ghana 4,01 3,42 2,58 2,02 3,01 2,81
119 Madagascar 120 Madagascar 3,60 3,95 2,39 2,02 2,99 2,75
120 Cameroon 119 Cameroon 3,73 3,50 2,33 2,24 2,95 2,76
121 Algeria 122 Algeria 4,16 3,32 2,19 2,05 2,93 2,72
122 Gabon 123 Gabon 4,01 3,41 2,28 1,99 2,92 2,71
123 Pakistan 121 Pakistan 3,45 3,58 2,64 2,01 2,92 2,73
124 Bangladesh 124 Bangladesh 3,87 3,30 2,49 1,95 2,90 2,71
125 Malawi 125 Malawi 3,72 3,54 2,22 2,12 2,90 2,70
126 Mali 127 Mali 3,32 3,91 2,32 1,91 2,87 2,63
127 Lesotho 129 Lesotho 3,59 3,71 2,48 1,50 2,82 2,55
128 Mozambique 128 Mozambique 3,24 3,78 2,30 1,93 2,81 2,59
129 Nigeria 126 Nigeria 3,18 3,36 2,38 2,24 2,79 2,65
130 Sierra Leone 130 Sierra Leone 3,56 3,61 2,09 1,83 2,77 2,54
131 Haiti 133 Haiti 3,42 3,98 2,29 1,30 2,75 2,43
132 Myanmar 131 Myanmar 3,42 3,31 2,07 2,06 2,72 2,54
133 Burundi 134 Burundi 3,55 3,60 2,11 1,53 2,70 2,43
134 Burkina Faso 135 Burkina Faso 3,36 3,56 2,02 1,74 2,67 2,43
135 Yemen 132 Yemen 3,18 3,26 2,31 1,74 2,62 2,44
136 Angola 136 Angola 3,23 3,21 2,16 1,79 2,60 2,41
137 Guinea 137 Guinea 3,19 3,21 1,86 2,05 2,58 2,41
138 Chad 138 Chad 2,74 3,33 1,88 1,76 2,43 2,24
As will be seen from Table 1, there are differences between weighted and unweighted index
scores of destinations. However, some variations have occurred in general ordering of the
destinations. For example, while Switzerland takes place in 6th order in weighted ordering, it falls to
rose to 6th order in weighted ordering. While Turkey takes place in 44th order in unweighted
ordering, it rose to 40th order in weighted ordering.
3. CONCLUSION
In calculation of TTCI scores, unweighted average of sub factors was taken into consideration (WEF,
2015). However, factors have different weights across destination or within a specific market
segment in terms of its effect and importance on competitive power Crouch, 2011). However, when
the criteria taken as a basis for assessing are numerous, for calculating the resultant of them,
there is need for the weight of each criterion (Savaş and Baykal, 2011).
In this context, taking weighed averages of the factors previously weighted by means of the
method of entropy, ordering of Travel and Tourism Competitiveness of the destinations are again
made. As will be seen from Table 1, the general scores of countries varied. While some destinations
rise to the upper orders in the new ordering, some destinations can find place for themselves in
the lower steps.
[From the aspect of ] the limitedness that is necessary to be considered related to the study,
since the data WEF Travel and Tourism Competitiveness Index are used in the study, the
reliability and validity of the findings presented in this study depends on the reliability and
REFERENCES
Buhalis, D. (2000). Marketing the Competitive Destination of the Future, Tourism Management, 21
(1): 97-116.
Crouch, G.I. (2011). Destination Competitiveness: An Analysis of Determinant Attributes, Journal of
Travel Research, 50(1):27-45.
Crouch, G.I., ve Ritchie, B.J.R. (1999). Tourism, Competitiveness and Societal Prosperity, Journal of
Business Research, 44(3), 137-152
Çınar,Y.(2004). Çok Nitelikli Karar Verme ve Bankaların Mali Performanslarının Değerlendirilmesi
Örneği, (Yayınlanmamış Yüksek Lisans Tezi), Anakara Üniversitesi S.B.E.Ankara.
Dupeyras, A., MacCallum,N. (2013). Indicators for Measuring Competiveness in Tourism: A Guidance
Document, OECD Tourism Papers, 2013/02, OECD publishing.
Dwyer, L., Kim, C. (2003). Destination Competitiveness: Determinants and Indicators, Current Issues
in Tourism, Vol.6, No: 5: 369-414.
Göral, R. (2016). Turizm Destinasyonu Rekabetçilik Faktörleri ve Entropi Yöntemiyle
Ağırlıklandırılması, 17. Ulusal Turizm Kongresi, 11-19, Muğla/Turkiye.
Hwang, C.L., Yoon, K. (1981). Multiple Attribute Decision Making: Methods and Applications,
Springer-Verlag, Berlin/Hiedelberg.
Savaş, E. ve Baykal A. (2011). Üniversitelerin Sıradüzeni ve Sıralama ölçütlerinin Ağırlıkları,
Uluslararası Yükseköğretim Kongresi: Yeni Yönelişler ve Sorunlar, 27-29 Mayıs, İstanbul,
2458-2464.
World Economic Forum (WEF), (2015), The Travel and Tourism Competitiveness Report 2015,
Geneva
Zhang, H., Gu, C., Gu, L. ve Zhang Y. (2011). The Evaluation of Tourism Destination Competitiveness
by TOPSIS and Information Entropy–A Case in the Yangtze River Delta of China, Tourism