Sharif University of Technology
Scientia IranicaTransactions A: Civil Engineering www.scientiairanica.com
Application of resilience thinking to evaluate the urban
environments; a case study of Tehran, Iran
P. Parivar
a;, S. Faryadi
aand A. Sotoudeh
ba. Faculty of Environment, University of Tehran, Tehran, P.O. Box 14155-6135, Iran. b. School of Environment, Yazd University, Yazd, P.O. Box 89195-741, Iran.
Received 30 January 2015; accepted 5 October 2015
KEYWORDS Resilience thinking; Urban environment; Ecosystem;
Ecosystem services; Urban landscape.
Abstract. Resilience thinking has recently been proposed as a dierent way of understanding the world and a new approach to managing urban environments. This research aims to evaluate the environmental quality of Tehran-Iran using some resilience criteria. Based on the comparative analysis of the current related theories, we have extracted and classied some of the resilience criteria into four dimensions, i.e. Pattern and process of socio-economic criteria in urban landscape, responses of human society in urban landscape, pattern of biophysical structure in urban landscape, and urban ecosystem dynamic and function. We have focused on the last two ones. The results show that the composition and conguration of urban green spaces and consequently its ecosystem quality do not fulll the requirements of a resilient urban landscape. On the other hand, assessment of Tehran air quality shows that the number of unhealthy days has increased over the last decade. Also, Tehran has heavily relied on outer water basins. Besides, the proportion of impervious surfaces within a period of 22 years (1988-2010) has increased by more than two times. These results support the resilience criterion as a more realistic approach to demonstrating both the urban environments situation and the directions of future urban plans.
© 2016 Sharif University of Technology. All rights reserved.
1. Introduction
Resilience is a exible concept which is currently used as an approach in dierent elds of study [1]. The concept of resilience was originally suggested as a descriptive ecological term [2]. Resilience is referred to as a basic capacity of an ecosystem to maintain desirable services of the ecosystem confronting environ-mental changes and human exploitation [3]. In another denition, resilience is presented as the capacity of ecological-social systems to attract disorders and also to maintain the feedbacks, processes, and necessary and
*. Corresponding author.
E-mail addresses: [email protected] (P. Parivar); [email protected] (S. Faryadi); [email protected] (A. Sotoudeh)
inherent structures of the system [4]. Resilience think-ing, through the concept of multi-scale and selection of appropriate temporal and spatial scales, provides an insight to consider unpredictable future, inevitability of change, and vulnerability of such systems [5,6]. Resilience thinking provides a structured method for taking account of the complexities, uncertainties, and interdependence of systems and processes; it also paves the way for new methods of planning and more ecient application of assessment and sustainability thinking [7].
One of the most important concepts considered in resilience thinking is social-ecological system. Scholars, within the realm of resilience, have created the term `social-ecological system' which includes cities. The term `social-ecological system' elaborates on inter-dependence of human and nature, emphasizing the
concept of humans-in-nature. Social-ecological sys-tems include the integration of nature and human society with mutual feedbacks and interdependence. Although we cannot nd a recognizable social or ecological portion in such systems, we cannot separate them for the purpose of analysis [8,9]. Inuenced by the resilience thinking, new sources introduce urban ecosystems as the production of natural and social processes within which structure and performance are very closely related [10-13]. In cities and urban regions, with regard to the decisions made related to land use, we experience things such as structure changing, fragmentation and isolation of natural habitats [14], hydrological system failure [15], and changes of en-ergy ow and food cycle [10], all of which lead to a reduction in resilience in dierent spatial scales making urban systems increasingly vulnerable. Thus, it can be concluded that we can improve the ecolog-ical performance and consequently resilience in urban habitats through establishing a reform in the urban structure.
In the assessment of urban resilience, the system, as a whole, is regarded; not a specic kind of disorder or specic aspect of the system that might be aected [16]. Instead, the general performance of the system will be evaluated with regard to the resilience criterion. Dierent criteria have been developed to determine the general resilience of the system. Vanoudenhoven presented a list of social-ecological indices (criteria) for landscape resilience; however, their indices (criteria) concentrate more on agricultural landscapes [17]. In addition, some studies have been performed on the assessment of resilience in social-ecological systems with rural nature. Walker and Salt developed some criteria, presented in their book, entitled \Resilience Thinking". Nine criteria were suggested for assessment of resilience including ecological diversity; ecological variability; modularity; economic-social system di-versity (social capital); overlap in dierent levels of governance; tight feedbacks (political, social, economic, and environmental conditions); unpriced ecosystem services (diversity of such services); acknowledging slow variables; and innovation. Resilience World Alliance as well as some researchers developed some other criteria including diversity, openness, inter-relationship of feedbacks, reserves, and modularity [6,7,16].
In the present study, based on the characteristics of urban systems and interaction of subsystems in ur-ban regions [10-13,18,19], these criteria were classied into four groups including pattern of biophysical struc-ture, pattern and process of socio-economic criteria, urban ecosystem dynamic and function and responses of human society in urban landscape. Resilience crite-ria and their application in urban environment, with regard to the literature related to general resilience criteria in urban environment, are all shown in Table 1.
The current study emphasizes that assessment of general resilience of Tehran needs to take into account a lot of resilience criteria, but in this research the considered criteria include pattern of biophysical struc-ture in urban landscape and urban ecosystem dynamic and function. The composition and conguration of urban green spaces, as the most important component of urban ecosystems, and also the biophysical variables such as air, water resources, and impervious surfaces are considered as the basic factors of urban ecosystem services.
2. Material and method
The current study selected Tehran as a case study; in addition, its resilience was assessed. Based on Statistical Centre of Iran, the population of Tehran was more than 8 million in 2011, the rst most populous in Iran. According to the results of the public census in 2011, the population of the province of Tehran was about 12,183,391, which showed an average annual growth rate of about 1.44% [20].
Based on the suggestions made by the Resilience World Alliance for the assessment of resilience [16], the following steps were taken for assessment of resilience of Tehran:
1. Dening appropriate measures to assess the crite-rion (landscape metrics). Table 2 shows appropri-ate measures for each criterion;
2. Mapping measures;
3. Description of the main system with regard to the resilience assessment criteria;
4. Interpretation of Tehran's resilience based on the results achieved through metrics.
For measuring the landscape metrics or appropri-ate measures for the criteria, softwar FRAGSTAT 4.1 was used. This software makes it possible to calculate landscape metrics [21]. In the present study, FRAG-STAT 4.1 software was used to calculate landscape metrics. Using this technique can reduce the errors resulted from the calculation of the metrics through the software. In addition, it makes it easier to interpret the metrics because it shows the results of the metrics calculation as zoning map.
In this study, land cover maps in three classes of green, open, and built up area were extracted from Landsat TM images that surveyed in June, 1988 and 2010 through TM sensor. The following steps were taken in order to achieve land cover maps: after getting satellite images, the process of geometric match and also making coordination between the images through vector road maps of Tehran were performed to prepare data for the purpose of processing and exploiting of information. The second sampling was done using the
Table 1. Summary of criteria for assessment of general resilience in urban landscape.
Criteria category Criteria Feature of criteria with urban landscape
Pattern of biophysical structure in urban landscape
Diversity of structure pattern
Spatial diversity in habitat patches that are source of supply of ecosystem
services in urban landscape Modularity of
structure pattern
Spatial and temporal congurations of structure that are sources of supply of ecosystem services in urban landscape Connectivity of
structure pattern
The presence of ecological networks (greenways, green belt)
Pattern and process of sosio-economic in urban landscape
Diversity
Diversity of urban land uses Presence of institutions and social networks
Diversity of social interactions Diversity of economic opportunities
Diversity of economic resources
Social capital Presence of strong social networks in urban locals Dierent levels of
governance
Diversity of governmental structures and executive levels of urban management Modularity Flexibility and diversity in institution structures
Openness Reasonable openness of society to respond to changes
Urban ecosystem dynamic and function
Diversity of the main kinds of ecosystem services
Diversity of the types of ecosystem services or slow variables that
are good for urban landscape Regulating services Supporting services Tight feedbacks
Long-term policies and local solutions to improve ecosystem
services and reserves
Unpriced ecosystem services
To be aware of costs for monitoring and active management of Un priced ecosystem services
Internalizing external costs of loss of ecosystem services
Responses of human society in urban landscape
Ecological variability
Preparation and knowledge of society for the origin of internal and
external disturbances Innovation
Providing the context for experiencing new priorities of the
stakeholders in urban local area
Nearest Neighbor interpolation (NN) method. All the bands used here were geometrically matched using the above method with RMSE 0.47. Spectral modication of the images aimed to highlight the phenomena and also to improve the quality of the images. Then, using a combination of the bands 4, 3, and 2 we did the supervised classication through maximum likelihood method. Accuracy assessment was done after classi-cation using ground truth map; therefore, the overall accuracy index of %85 and Kappa index %89 were achieved. The results were considered satisfactory. In
the interpretation of data, the land use maps with 1:2000 scale and personal experiences of eld surveys were used. Figures 1 and 2 are of landcover in three classes of open, green, and built.
3. Results
As mentioned above, the present study aims to analyze resilience of Tehran according to pattern of biophysical structure and urban ecosystem dynamic and function criteria.
Table 2. Landscape metrics for assessing resilience of Tehran based on pattern of biophysical structure and urban ecosystem dynamic and function.
Dimensions of
urban resilience Criteria
Measurable
variables or data Metric
Pattern of biophysical structure criteria
Diversity or spatial heterogeneity
The amount of green and open patches coverage Number of green and open patches Richness of green and open patches
Patch Richness Density (PRD) Percentage of Landscape
(PLAND)
Connectivity Mean distance between each class of patches
Euclidean Nearest-Neighbor Distance (ENN) Radius of Gyration (GYRATE) Modularity
Amounts of heterogeneity or homogeneity of urban green
and open patches
Contagion index (CONTAG)
Urban ecosystem
dynamic and function Unpriced ecosystem services
Air quality The number of clean air days during the entire year Water resources The quantity of water resources Change of impervious surfaces Change in ratio of impervious
surfaces
Figure 1. Land coverage map of Tehran-Iran from Landsat satellite 2010 (landcover 2010).
The pattern of biophysical structure is related to patches originated from environmental services. For our analysis, it was based on green patches with environmental service origin. Our criteria include diversity, connectivity, and modularity. The results are presented in three parts according to these crite-ria.
3.1. Diversity (spatial heterogeneity) of the green patches in Tehran
Diversity (spatial heterogeneity) of green patches in Tehran was assessed with two metrics of patch area (PLAND) and Patch Richness Density (PRD).
Figure 2. Land coverage map of Tehran-Iran from Landsat satellite 1988 (landcover 1988).
3.1.1. The ratio of green patch areas in Tehran Patch area is one of the most important metrics to mea-sure landscape composition, specically to show how much of the target patch type (green patches) exists within the landscape (Tehran). Figure 3 shows the area of green and open patches and their distribution. As shown in Figure 3, in few parts of Tehran, the ratio of green and open patch areas is %50 or more.
3.1.2. Green patch richness density in Tehran
In this metric, we divide the number of all kinds of patches in the city by the whole area of the landscape. The unit of this metric is the number of patch types in
Figure 3. The ratio of green patch areas in Tehran (pland green).
100 ha. This metric, concerning a particular patch type (e.g. green patches in urban landscape), may aect a variety of ecological processes in this landscape, such as biodiversity. The number or density of patches is probably mostly valuable as the basis for computing other more interpretable metrics. Through this metric, we can compare dierent landscapes. As shown in Figure 4, the higher the result of this metric, the richer is that area with regard to green patches.
3.2. Connectivity of green patches in Tehran Connectivity of green and open patches in Tehran was assessed using Euclidean distance to nearest neighbor (ENN) metric and intensity of the patch (GYRATE) metric.
3.2.1. Euclidean distance to the nearest neighbor of green patches
This metric shows the average of the shortest distances between patches of the same type within the land-scape. This metric computes the shortest straight-line distance between the focal patch and its nearest neighbor of the same class. The unit of this metric is meter. This metric was computed for all the green patches of Tehran. In Figure 5, the average distance of Euclidean neighborhood of green patches in Tehran is demonstrated. As can be seen in the gure, the average neighborhood distance of green and open patches in Tehran is more than 63 meters.
3.2.2. Intensity of green patches in Tehran
This metric, for each patch, is calculated as the average distance between each cell in the patch and the center of the patch. The unit of this metric is meter. Intensity of the patch (GYRAT) is a technique to measure the extended area of patches (or their intensity). It shows how far across the landscape a patch can extend its reach. This metric, for each patch, is calculated as the
Figure 4. Green patch richness density in Tehran (prd).
Figure 5. Euclidean distance to the nearest neighbor of green and open patches (enn mn).
average distance between each cell in the patch and the center of the patch. Then, it is summarized, for all the patches or patches of the landscape, as the average of the weighted area. When aggregated at the class or landscape level, radius of gyration provides a measure of landscape connectivity. This metric is considered to be zero in scattered areas. In Figure 6, the intensity of green patches in Tehran is shown. As can be seen, the area of patches is mostly less than 28 meters. Just in some specic parts, such as region 1 or 22 and some parts in the south including agricultural lands, the intensity of the patches is 28-36 meters.
3.3. Modularity of green patches in Tehran The metric of contagion was used to analyze modular-ity in Tehran. This metric shows the composition and texture of land cover. Contagion metric measures both patch type interspersion and patch dispersion at the landscape level. Based on the result obtained from this
Figure 6. Intensity of green patches in Tehran (gyrate).
Figure 7. Modularity of green patches in Tehran (contagion).
metric, we recognized the extent to which patch types are aggregated or clumped. The unit of this metric is percentage. The metric of contagion is a measure showing green patches in Tehran, which is contagion in a cluster-like manner in an accumulative way or is scattered around the city as smaller patches. Higher values of contagion may result from landscapes with a few large contiguous patches, whereas lower values generally characterize landscapes with many small and dispersed patches [14]. In other words, if the result is close to zero, it indicates that the green patches are small and scattered and if it is close to 100, it shows that the patches are accumulated in one place and they do not have a congruent distribution in the urban landscape of the city. As can be observed in Figure 7, there is no 100 as a result of contagion metric; the places with 40-70 have acceptable contagion and there is a balance, in these places, between connectivity and
contagion. Areas with a contagion of less than 20 are the places suering from lack of connectivity, as well. 3.4. Urban ecosystem dynamic and function Urban ecosystem dynamic and function is about di-versity of types of ecosystem services or slow variables that are good for urban landscape. The biophysical variables such as air, water resources, and impervious surfaces are considered as the basic factors of urban ecosystem services.
3.4.1. Air quality of Tehran
Air pollution is one of the serious problems in Tehran. The number of clean days from 2007 to 2011 has been 23, 13, 32, and 14 days, respectively. Over these years, the healthy conditions were only observed in the 327th, 293th, 291th, and 247th days, respectively; in addition, the days considered as unhealthy were the 15th, 59th, 40th, and 103th, respectively. The very unhealthy conditions did not occur in 2007; however, in years spanning from 2008 to 2010, only one day with dangerous and unhealthy condition was experienced. Generally, concerning the PSI index from 2007 to 2009, the pollution states had a trend showing the conditions as becoming unhealthy [20].
3.4.2. Water resources quantity
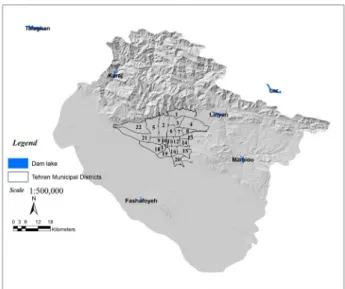
Instability situation of Tehran water resources has occurred due to the dry hydrologic conditions in Tehran region (average precipitation of about 250 millimeters per year), accompanied with high population density, changing climates, and lack of balance between wa-ter supply and demands. The trend and associated changes in the total water consumption in Tehran from 1998 to 2010 has been upward and incremental; moreover, the consumption has risen from 886 million cubic meters to 1033 million cubic meters. The average annual growth rate of this index rose by 0.74% within this time span [20]. In order to provide the fresh water supply for the urban and agricultural consumption in Tehran, several dams have been constructed on the owing rivers including Karaj (Amir Kabir dam), Lar Dam, Latian, and Taleghan Dams. It is signicant to note that Tehran has heavily relied on the outer water basins. Figure 8 shows the situation of Tehran's dams. Lar Dam and Taleghan belong to other basins.
Moreover, the ground water aquifers are consid-ered strategic resources in the arid regions. In case of Tehran, the importance of ground water aquifer, due to water shortages in the surface water, has increased substantially. The drop in annual average water level in Tehran plain is about 18 centimeters in year [20].
3.5. Change in ratio of impervious surfaces This is based on the interpretation of Landsat images taken from the city in the 2 mentioned years. The
Figure 8. The situation of Tehran dams (dam lakes).
Figure 9. The impervious surfaces in 2010.
green land area and open space areas have constantly and gradually decreased and the area has been taken by construction of buildings. In 1988, only 37% of the present area of Tehran was built on and constructed while in 2010, it increased to 61%. Figure 9 shows the impervious surfaces in 2010.
4. Conclusion
Survival of the cities as social-ecological systems de-pends on natural and ecosystem services. As a re-sult, getting to know resilience in urban environment needs interdisciplinary understanding and an analysis in dierent scales. Among the criteria dened for assessment of resilience of urban ecosystems, we can refer to diversity, connectivity, and modularity of structural elements with ecological performance (green patches); also, the main ecosystem services can be regarded as some other criteria. Based on the results
obtained from metrics of distribution diversity of open and green patches (PRD and PLAND) in Tehran, the ratio of green and open patches areas is more than 50 only in few regions and has appropriate intensity. These regions are mostly in the northern part of the city or in the south, where agricultural lands exist. The results obtained from connectivity metric (GYRATE and ENN) indicate that only in few regions the edge to edge distance between the patches is inconsiderable. The results achieved from CONTAG metric, focusing on spatial distribution of green and open patches (modularity), show that in most of the region, we experience low contagion due to low connectivity. In few regions, where the connectivity is considerable, the percentage of contagion is high. From the results achieved from three criteria of diversity, connectivity, and modularity { which in their own turn show resilience of Tehran with regard to ecosystem criteria { we can conclude that combination and spatial distribution of the green patches are not resilient in Tehran. The state of ecosystem services (air, water, and the ratio of impervious surfaces) does not fulll the requirements for a healthy urban structure to support a resilient landscape. Assessment of resilience in urban environments based on the abovementioned criteria is a guideline for authorities and decision makers to use exible and modern approaches in urban manage-ment. Consequently, the current study indicates that Tehran is not a resilient city regarding the pattern of biophysical structure and ecosystem services criteria, which means that proceedings of Tehran municipality, regarding the green space, air, water, and urban devel-opment management, have not been ecient so far and their performance cannot be guaranteed. Achieving resilience needs cooperation between and within orga-nizations, matching the organizations responsible for making decisions with ecological scale of the recognized source to prevent one sided views.
References
1. Brand, F.S. and Jax, K. \Focusing the mean-ing(s) of resilience: Resilience as a descriptive con-cept and a boundary object", Ecology and Society., 12(1), 23. [online] URL: http://www. ecologyandsoci-ety.org/vol12/iss1/art23/ (2007).
2. Holling, C.S. and Gunderson. L.H. \Resilience and adaptive cycles", in Panarchy: Understanding Trans-formations in Human and Natural Systems, L.H. Gun-derson and C.S. Holling, Eds., pp. 25-62, Island Press, Washington, D.C., USA (2002).
3. Folke, C., Carpenter, S., Walker, B., Scheer, M., Elmqvist, T., Gunderson, L. and Holling, C.S. \Regime shifts, resilience, and biodiversity in ecosys-tem management", Annual Review of Ecology, Evolu-tion, and Systematics, 35, pp. 557-581 (2004).
4. Adjer, W., Hoghes, T., Folke, C., Carpenter, S. and Rockstorm, J. \Social ecological resilience to coastal disasters", Science, 309(5737), pp. 1036-1039 (2005). 5. Faith-Ell, C. and Kalle, H. \Resilience in the SEA of
a connectivity strategy", In: IAIA'11 Impact Assess-ment and Responsible DevelopAssess-ment for Infrastructure, Business and Industry, 31st Annual Meeting of the International Association for Impact Assessment, 28 May-4 June 2011, Puebla, Mexico (2011).
6. Slootweg, R. and Jones, M. \Resilience thinking im-proves SEA: A discussion paper", Impact Assessment and Project Appraisal, 29(4), pp. 263-276 (2011). 7. Walker, B. and Salt, D., Sustaining Ecosystems and
People in a Changing World, Washington: island press (2006).
8. Berkes, F. \Understanding uncertainty and reducing vulnerability: Lessons from resilience thinking", Nat-ural Hazards., 41, pp. 283-295 (2007).
9. Berkes, F., Colding, J. and Folke, C. \Navigat-ing social-ecological systems: Build\Navigat-ing resilience for complexity and change", Cambridge University Press (2003).
10. Grimm, N.B., Grove, J.M., Pickett, S.T. and Redman, C.L. \Integrated approaches to long-term studies of urban ecological systems", BioScience, 50, pp. 571-584 (2000).
11. Pickett, S.T.A., Cadenasso, M.L., Grove, J.M., Nilon, C.H., Pouyat, R.V., Zipperer, W.C. and Costanza, R. \Urban ecological systems: Linking terrestrial ecological, physical, and socioeconomic components of metropolitan areas", Annual Review of Ecology and Systematics, 32, pp. 127-157 (2001).
12. Alberti, M., Marzlu, J.M., Shulenberger, E., Bradly, G., Rryan, C. and Zumbrunnen, C. \Integrating humans into ecology: Opportunities and challenges for studying urban ecosystems", BioScience., 53, pp. 1169-1179 (2003).
13. Alberti, M. and Marzlu, J.M. \Ecological resilience in urban ecosystems: Linking urban patterns to human and ecological functions", Urban Ecosystems, 7, pp. 241-265 (2004).
14. Marzu, J.M. \Worldwide urbanization and its eects on birds", in Avian Ecology and Conservation in an Urbanizing World, J.M. Marzlu, R. Bowman and R. Donnelly (Eds.), pp. 19-47, Kluwer: Academic Publishers (2001).
15. Arnold, C. and Gibbons, C. \Impervious surface cov-erage: Emergence of a key environmental indicator", American Planning Association., 62(2), pp. 243-258 (1996).
16. Gunderson, L., Kinzig, A., Quinlan, A. and Walker, B. \Resilience alliance. Assessing resilience in social-ecological systems", Workbook for Practitioners, Ver-sion 2.0. http://www.resalliance.org/3871.php (2010). 17. Vanoudenhoven, F.J., Mijatovic, D. and Eyzaguirre, P.B. \Social-ecological indicators of resilience in agrar-ian and natural landscapes", Management of Environ-mental Quality, 22(2), pp. 154-173 (2010).
18. Schouten, M.A.H., van der Heide, C.M., Heijman, W.J.M. and Opdam, P.F.M. \A resilience-based policy evaluation framework: Application to European rural development policies", Ecological Economics, 81, pp. 165-175 (2012).
19. Ahren, J. \From fail to safe: sustainability and re-silience in the new urban world", Landscape and Urban Planning, 100(4), pp. 341-343 (2011).
20. Tehran University, Graduate Faculty of Environment, Tehran's State of Environment (SoE), Tehran Urban Planning & Research Center (2012).
21. McGarigal, K., Cushman, S.A. and Ene, E., FRAGS-TATS v4: Spatial Pattern Analysis Program for Cat-egorical and Continuous Maps, Computer software program produced by the authors at the Univer-sity of Massachusetts, Amherst. http://www.umass. edu/landeco/research/f (2012).
Biographies
Parastoo Parivar received her PhD degree in En-vironmental Planning from Tehran University, Iran, in 2013, and is currently lecturer of Environmental Science in the Department of Environment, Faculty of Natural Resources, Yazd University, Yazd, Iran. Her coursework focuses on urban environmental assessment and planning. She has served as an environmental consultant in urban planning projects. Her research interests include urban ecological planning and design, ecological risk assessment, and environmental assess-ment.
Shahrzad Faryadi started her academic life by rst completing a Bachelor Engineering in Architecture in 1987 and then expanding it to Master (1994) and PhD programs (2002) in Urban Planning and Design. In her current role as an Associate Professor of Environmental Planning at University of Tehran, her primary interest has been on the integration of environmental quality improvements and urban planning. She has published numerous papers in refereed national and international journals and conferences in the areas of her expertise. Dr. Faryadi has developed her activities by practicing as a full member of Iranian Engineering Organization and Ontario Professional Planners Institute (RPP). Ahad Sotoudeh is a researcher and lecturer in the eld of environmental planning. He received his PhD degree in Environmental Planning from University of Tehran in 2010. He is currently an Assistant Professor in the Department of Environmental Engineering at Yazd University. His research interests include envi-ronmental impact assessment of development projects, urban ecological planning, and ecological impacts of climate change.