O R I G I N A L R E S E A R C H
Correlations between community size and student
perceptions of value
SM Anderson1, E Simanton2
1University of South Dakota, Sanford School of Medicine, Sioux Falls, SD, USA 2University of Nevada, Las Vegas School of Medicine, Maryland Parkway, Las Vegas, NV, USA
Submitted: 14 October 2016; Revised: 21 March 2017, Accepted: 26 March 2017; Published: 22 July 2017
Anderson SM, Simanton E
Correlations between community size and student perceptions of value
Rural and Remote Health 17: 4246. (Online) 2017 Available: http://www.rrh.org.au
A B S T R A C T
Introduction: The purpose of this study was to determine if medical students’ feeling of being valued was correlated to community size. The study, conducted in several communities in South Dakota, examined students’ feeling of value relating to attending physicians, healthcare teams and patients.
Methods: Student value items were added to student satisfaction surveys sent out to students at the end of their primary clinical year and data collected from two graduating classes of students (n=114). Student responses were grouped by clinical campus and mean responses by community size were calculated. Additionally, student encounter logs were reviewed for study participants to gauge participation levels during clinical encounters.
Results: The degree to which students felt valued by their physician attending, the healthcare team and the patients decreased consistently as community size increased. Differences were statistically significant between students in the smallest and largest communities. Additionally, students in the community of 15 000 felt significantly more valued than students in the community of 170 000. Furthermore, there also appears to be a relationship between the percentage of participation in patient care by students and community size. Students in the smaller, rural communities participated at a higher percentage rather than observing.
Conclusions: There appears to be a relationship between community size and the extent to which students feel value. The degree to which students felt valued decreased consistently as community size increased. Differences were statistically significant between students in the smallest communities and the two largest communities. Students in the smaller, rural communities participated at a higher percentage. Additional studies are needed to address whether students participate more as a result of feeling valued, or whether participation leads to an enhanced perception of value by students.
Introduction
Studies have indicated that medical student participation in patient care enhances students’ development as professionals1. Additionally, there has been growing interest
in understanding the specific contributions of medical students to patient care and the healthcare settings in which these students train and participate2. Not a lot of information
is available in the literature regarding students’ perception of their value to the healthcare team or if community size has an impact on that perceived value.
The University of South Dakota Sanford School Of Medicine has three primary clinical campuses and several clinical sites. The majority of the medical students spend their primary clinical training year on one of the three clinical campuses, which are located in some of the state’s largest cities. A limited number of students can elect to train in a rural community as part of the Frontier and Rural Medicine Program, the school’s rural training track. Community healthcare statistics for the different-sized communities are shown in Table 1. The purpose of this study was to determine how much the students felt valued by their attendings, the healthcare teams they worked with and the patients they cared for. This was compared with community size to see if there was any correlation.
Methods
Student value items were added to student satisfaction surveys sent out to students at the end of their primary clinical year and data collected from two graduating classes of students (n=114). Student responses were grouped by clinical campus and mean responses by community size were calculated. Analysis of variance (ANOVA) with Bonferoni post-hoc calculations were used to determine statistical significance of the differences. Additionally, student encounter logs were reviewed for study participants to gauge participation levels during clinical encounters. This provided an independent measure of student value at clinical sites.
Ethics approval
This study was approved by the University of South Dakota Institutional Review Board (#2015.216).
Results
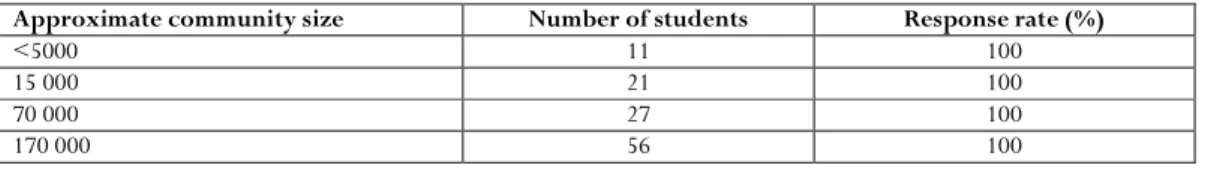
Numbers of respondents by community size are shown in Table 2. All students completed surveys (100% response rate). As community size increased, the number of students at that site also increased.
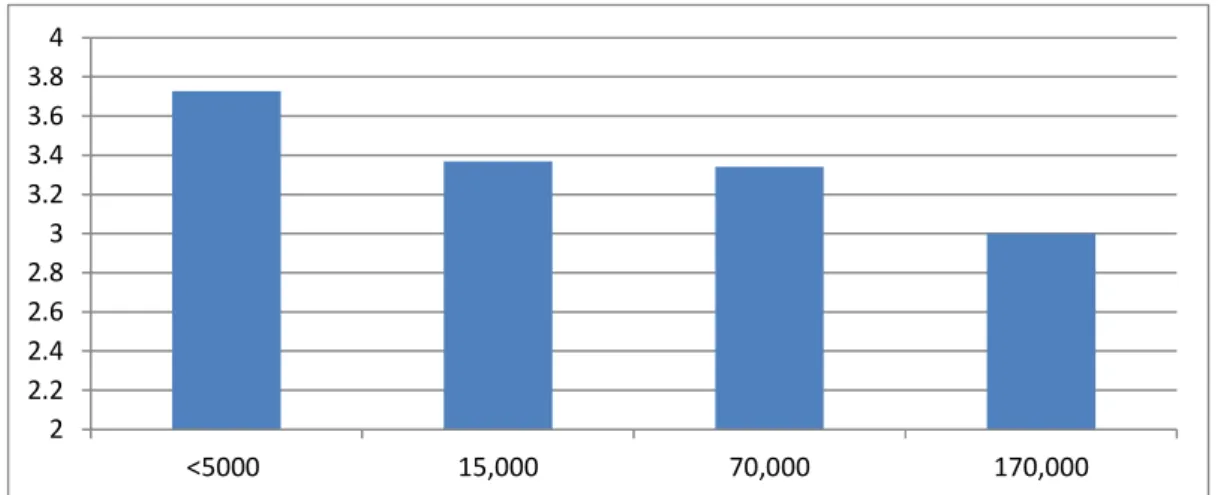
In Figure 1, mean responses are shown to the question, ‘How much did you feel valued by your attendings at your clinical site?’ Responses are based on a 1–4 Likert-type scale. The degree to which students felt valued decreased consistently as community size increased (Fig1).
Significant differences were found between student feelings of being valued by their attendings at different-sized communities (F(3,103)=5.731, p=0.001). Tukey’s honest significant difference (HSD) post-hoc tests (Table 3) indicate significance between the largest and smallest communities, with differences in middle-sized communities as non-significant.
In Figure 2, mean responses are shown to the question, ‘How much did you feel valued by the healthcare team at your clinical site?’ Responses are based on a 1–4 Likert-type scale. The degree to which students felt valued decreased consistently as community size increased.
Significant ANOVA findings were obtained (F(3,102)= 6.135, p=0.001) and Tukey’s HSD post-hoc analysis (Table 4) indicates statistical significance only between the smallest community and the others. Differences between the larger communities were non-significant.
Table 1: Healthcare statistics for study communities
Approximate community size
Number of beds Average daily
occupancy (%)
Number of admissions per year
Number of outpatient visits per
year
170 000 483 64 26 434 500 170
70 000 417 69 21 319 198 381
15 000 105 31 3400 85 574
<5000 25 30 803 56 073
Table 2: Number of respondents by community size and response rates
Approximate community size Number of students Response rate (%)
<5000 11 100
15 000 21 100
70 000 27 100
170 000 56 100
Table 3: Tukey’s honest significant difference post-hoc comparisons of value by attendings and community size
Dependent variable Community size Mean community size
difference
Standard error
p value
How much did you feel valued by your attendings at your clinical site?
5000 15 000 0.35885 0.23453 0.423
70 000 0.38112 0.22265 0.323
170 000 0.74688 0.20579 0.002**
15 000 5000 –0.35885 0.23453 0.423
70 000 0.02227 0.18683 0.999
170 000 0.38803 0.16638 0.097
70 000 5000 –0.38112 0.22265 0.323
15 000 –0.02227 0.18683 0.999
170 000 0.36576 0.14917 0.074
170 000 5000 –0.74688 0.20579 0.002**
15 000 –0.38803 0.16638 0.097
70 000 –0.36576 0.14917 0.074
* p<0.05, **p<0.01
In Figure 3, mean responses are shown to the question, ‘How much did you feel valued by patients at your clinical site?’ Responses are based on a 1–4 Likert-type scale. The degree to which students felt valued decreased consistently as community size increased.
Significant ANOVA findings were obtained (F(3,103)=7.432, p=0.000) and Tukey’s HSD post-hoc analysis (Table 5) indicates significant findings between the
two smallest communities and largest community regarding students’ feelings of being valued by patients.
Relating to issues of being valued is being granted permission by the patient, attending, and the healthcare team to participate in care. As part of student reporting of student-patient encounters, medical students report their role in the encounter as either 'Observed' or 'Participated'. The mean percentage of encounters reported as 'Participated' is shown in Figure 4 by community size.
2 2.2 2.4 2.6 2.8 3 3.2 3.4 3.6 3.8 4
<5000 15,000 70,000 170,000
Figure 1: Mean feeling of being valued by attending by community size
Table 4: Tukey’s honest significant difference post-hoc comparisons of value by healthcare team and community size
Dependent variable Community size Mean community
size difference
Standard error
p value
How much did you feel valued by the healthcare team at your clinical site?
5000 15 000 0.72727 0.27253 0.043*
70 000 0.88112 0.25613 0.005***
170 000 1.00178 0.23673 0.000****
15 000 5000 –0.72727 0.27253 0.043*
70 000 0.15385 0.21835 0.895
170 000 0.27451 0.19523 0.498
70 000 5000 –0.88112 0.25613 0.005**
15 000 –0.15385 0.21835 0.895
170 000 0.12066 0.17160 0.896
170 000 5000 –1.00178 0.23673 0.000****
15 000 –0.27451 0.19523 0.498
70 000 –0.12066 0.17160 0.896
* p<0.05, **p<0.01, ***p<0.001, ****p<0.0001
Table 5: Tukey’s honest significant difference post-hoc comparisons of value by patients and community size
Dependent variable Community size Mean community
size difference
Standard error
p value
How much did you feel valued by patients at your clinical site?
5000 15 000 0.39713 0.26623 0.446
70 000 0.74126 0.25275 0.021*
170 000 0.97504 0.23360 0.000****
15 000 5000 –0.39713 0.26623 0.446
70 000 0.34413 0.21208 0.371
170,000 0.57792 0.18887 0.015*
70 000 5000 –0.74126 0.25275 0.021*
15 000 –0.34413 0.21208 0.371
170 000 0.23379 0.16933 0.514
170 000 5000 –0.97504 0.23360 0.000****
15 000 –0.57792 0.18887 0.015*
70 000 –0.23379 0.16933 0.514
2 2.5 3 3.5 4
<5000 15,000 70,000 170,000
Figure 2: Mean feeling of being valued by healthcare team by community size
2 2.2 2.4 2.6 2.8 3 3.2 3.4 3.6 3.8 4
<5000 15,000 70,000 170,000
Figure 3: Mean feeling of being valued by patients by community size
50% 55% 60% 65% 70% 75% 80% 85% 90% 95% 100%
<5000 15,000 70,000 170,000
Table 6: Tukey’s honest significant difference post-hoc percentage of encounters where student ‘participated’ in patient care
Dependent variable Community size Mean community
size difference
Standard error
p value
Percentage of encounters where student ‘participated’ in care of the patient
5000 15 000 10.27446 5.66697 0.273
70 000 19.98081 5.44622 0.002**
170 000 23.25273 5.02893 0.000****
15 000 5000 –10.27446 5.66697 0.273
70 000 9.70635 4.43007 0.132
170 000 12.97827 3.90569 0.007**
70 000 5000 –19.98081 5.44622 0.002**
15 000 –9.70635 4.43007 0.132
170 000 3.27192 3.57788 0.797
170 000 5000 –23.25273 5.02893 0.000****
15 000 –12.97827 3.90569 0.007**
70 000 –3.27192 3.57788 0.797
* p<0.05, **p<0.01, ***p<0.001, ****p<0.0001
Significant ANOVA findings were obtained (F(3,110)= 9.257, p=0.000) and Tukey’s HSD post-hoc analysis (Table 6) indicates that, for each community, participation rates among students tended not to be significantly different from the next nearest in size but significantly different from those more different in size.
Conclusions
There appears to be a relationship between community size and the extent to which students feel value and the likelihood of students participating in patient care. The degree to which students felt valued by patients, attendings and the healthcare team decreased consistently as community size increased. This finding is likely due to differences in relationships between students, patients, attendings and team members in different-sized communities. In small communities, there are limited numbers of patients and healthcare providers. This leads to more interaction (and stronger relationships) among the same small groups of individuals. As community size increases, there become more patients and providers of both specialty and primary care and so patients and students tend to interact with a wider set of providers (and interact less frequently with any single healthcare provider). This increasing number (and decreasing quality) of relationships continues to increase from very small communities (population 5000 up to large communities (population 170 000). At some
point, communities must become large enough that the effect disappears. Additional study in larger communities are needed to determine at what community size population of community no longer impacts students’ perceptions of being valued and their ability to participate in care.
The relationship between being valued and participation in care seems obvious in that students who are well known to patients, attendings and the healthcare team are more likely to be granted permission to participate compared with students who are relatively unknown. It is likely that this more frequent granting of permission to participate instils feelings of being valued in the student. Since this tends to happen more frequently in smaller communities, students feel more valued in those same communities. More study is needed to examine the nature of relationships within health care in different-sized communities and exactly how those relationships impact the medical students being trained and the patients being served.
References
1. Smith SE, Tallentire VR, Cameron HS, Wood SM. The effects of
contributing to patient care on medical students’ workplace
learning. Medical Education 2013; 47: 1184-1196. https://doi.org/
2. Ehrenfeld JM, Spickard WA, Cutrer WB. Medical student contributions in the workplace: can we put a value on priceless?
Journal of Medical Systems 2016; 40: 128. https://doi.org/ 10.1007/s10916-016-0494-5