Sharif University of Technology
Scientia IranicaTransactions E: Industrial Engineering www.scientiairanica.com
A framework for resiliency assessment of power
communication networks
Z. Besharati Rad and A. Eshraghniaye Jahromi
Department of Industrial Engineering, Sharif University of Technology, Azadi Ave., Tehran, Iran. Received 28 April 2013; received in revised form 13 October 2013; accepted 16 December 2013
KEYWORDS Critical infrastructure; Resiliency metric; Resiliency index; Resiliency matrix; Power communication system;
Challenge; Response.
Abstract. Modern societies are strongly dependent on the continuous and ecient operation of electric power systems as a critical infrastructure. Besides, information and communication systems play a crucial role in the resiliency enhancement of the power system. As power communication systems are vulnerable against physical and cyber attack, these systems themselves can be an internal source of threat for power grids. Therefore, there is a need to identify and study the threats and weaknesses of power communication systems using a comprehensive framework. This framework helps power communication network planners evaluate all challenges and their numerous eects on the system, as a very important step towards designing such systems. In the present paper, we propose such a framework by introducing the concept of the `resiliency matrix'. In this regard, the resiliency of two alternative network plans, both of which are the solutions of a multi objective optimal design problem, is evaluated and compared using the proposed framework. The results reveal that the dened framework is capable of enhancing network resiliency and, thus, can be used as a complementary step towards designing optimal and robust power communication networks.
© 2014 Sharif University of Technology. All rights reserved.
1. Introduction
Resiliency has received considerable attention in recent years. Studies conducted on resiliency fall into a broad range of science and engineering elds, from psychol-ogy, economics, mechanical engineering, system theory and critical infrastructures to network design. Figure 1 presents the amount and growth of journal and confer-ence publications in the area of resiliency and surviv-ability over the last 5 decades [1]. As seen in the gure, the growth of research studies in this area was out-standing, following the year 2000. In this regard, one may assume that this rapid growth might be a byprod-uct of the September 11th event, occurring in 2001.
*. Corresponding author. Tel.: +98 21 66165705; Fax: +98 21 66022702
E-mail addresses: z besharatirad@ie.sharif.edu (Z. Besharati Rad); Eshragh@sharif.edu (A. Eshraghniaye Jahromi)
A power system is known to be the largest machine of the twentieth century. Therefore, reli-able, safe, and ecient operation of such a complex system is vital for maintaining the current human lifestyle in both developed and developing countries. However, transmission and distribution of electrical current mostly depends on reliable and fast operation of another system that is responsible for long distance protection, monitoring, data gathering, control, and supervision of the power system. This interdependent system is the power communication network. Figure 2 illustrates the relationship between a power system and its communication network in a framework for smart grid interoperability standards. As observed from the gure, the electric current ows from power plants to transmission lines and substations, then, to distribution lines and substations and, last, towards customer premises. The power communication system connects seven domains; generation, transmission,
dis-Figure 1. Survivability and resilience/resiliency publications per year since 1960 [1].
Figure 2. A framework for smart grid interoperability standards [2].
tribution, operation, service providing, the market and the customer, in the electrical energy environment.
The resiliency of power communication networks, as the main part of a smart electrical grid, is, nowadays, considered an attractive research area by many re-searchers around the world. In fact, rere-searchers in this eld are still faced with a number of open questions, in this respect. Among such questions are, \What is the exact denition of resiliency and how can it be measured?", \What is its relationship with reliability, survivability, robustness and other similar concepts?", and \Which methods and techniques may be used for designing resilient power communication networks?", etc.
In the same vein, the present study is aimed at proposing a denition for power system communication resiliency, specifying the measurement for its frame-work, and presenting how the measuring system can be applied to the optimal and robust designing of power communication networks.
The remainder of this paper is organized as follows.
Section 2 is devoted to a literature review on resiliency, including its denitions and classications
in various scientic disciplines, its measuring methods and some metrics as samples of resiliency measure-ments in a diversity of applications. In Section 3, more light is being shed on the concept of resiliency in power communication systems and smart grids, its necessity, objectives and its implementation challenges. In Section 4, a framework is proposed for resiliency assessment of power communication networks. In Section 5, two alternative power communication net-works are compared using the framework introduced in Section 4 and the results are described. The paper is nally concluded in Section 6, and suggestions for future research are also proposed.
2. Literature review 2.1. Resiliency denitions
A review of the literature reveals that so far, there has been a variety of denitions proposed for resiliency, either in its general sense or, specically, in various science and engineering elds. Generally, the terms has been dened as \An ability to recover from, or adjust easily to misfortune or change" [3], \The ability to prevent something bad from happening to prevent something bad from becoming worse, or the ability to recover from something bad once it has happened" [4]. Apart from these overall denitions, the term has also been dened specically in a vast number of areas. In physical sciences, for instance, \resiliency or elasticity refers to the ability of a substance or material to resume its natural shape after being distended by the application of forces. The elastic property of a material quanties the degree of deformation that may occur before the material is unable to return to its original shape, or catastrophically breaks" [5]. In economic science, resiliency is dened as \The ability to recover quickly from a shock (shock-counteraction) to withstand the eects of a shock (shock absorption), and to avoid the shock altogether (vulnerability)" [6]. In system theory, resiliency refers to \The ability of a sys-tem to maintain function and to \bounce back" quickly from a disturbance" [7]. In socio-ecological systems, the term is dened as \The magnitude of disturbance that can be tolerated before the socio-ecological system moves to a dierent region of state space controlled by a dierent set of processes" [8]. In this sense, resilience is achieved through \anticipating, preventing, mitigating, and responding expediently to minimize the extent, duration, and cost of any disruption, by learning, adapting and recovering" [9]. Regarding process industries, resiliency is dened as \The ability of a plant to tolerate and to recover from dynamic or transient disturbances" [10] and \The ability of the process to reject disturbances and prevent saturation in the manipulated variables" [11]. There are also other denitions for resiliency in water networks [12],
transportation [13], and information theory [14,15]. Given the sense associated with the term in network theory, several denitions have been so far proposed for resiliency, some of which are as follows:
- \The ability of a network to provide and maintain an acceptable level of service in the face of various challenges to normal operations" [16,17];
- \The ability of a network to (1) provide a network function when under \the application of external forces" and, (2) if unable to do so, to restore the network function" [18];
- \The ability of a network to provide and maintain an acceptable service level in the presence of random or deliberate failures. A resilient network should be able to cope with a specic amount of failure by remaining completely functional, providing connec-tivity to all its parts and providing enough capacity to fulll its task" [19];
- \A mechanism to assure service robustness, by ensuring that resources are re-established in case of failures. This re-establishment is possible due to protection (actions before failure) and/or restoration schemes (actions after failure)" [20].
2.2. Resiliency classications
Resiliency has been conceptually classied in a variety of ways, one of which is static resiliency vs. dynamic resiliency. Static resilience (also referred to as resiliency category type 1) is dened as the capability of an entity or system to maintain function even in the presence of shock. Accordingly, dynamic resilience (resiliency category type 2) refers to \the capability of an entity or system to recover rapidly from a severe shock to achieve a desired state" [21]. Taking this classication into consideration, quantifying network resiliency is a two-step process in which, rst, the network's ability to tolerate external causes of component failure is described and, second, based on this understanding, the ability of the network to restore performance can be quantied [18]. Yet another classication is that of \Holistic vs. Specic Resilience", whereby resiliency is dened in a broad vs. narrow sense. In other words, the terms can be dened both at macro as well as micro levels. At a specic /micro level, it would include both supply and demand and performance in a specic context (industry, product, service, system, network, etc.). At the holistic/macro level, it would not end at the boundaries of a specic product, service, supply chain or network, but rather would extend as far as the indirect impacts of a terrorist attack or other disaster can go, which means the economy as a whole" [7].
In addition, there are specic classications for resiliency in communication networks in the literature, including \Structural Errors vs. Transmission Errors
Resiliency Methods" [19] and \Restoration vs. Protec-tion Resiliency approaches" [19] to name a few. 2.3. Resiliency measurement
Given the measuring procedure of resiliency, there have been two main approaches in this regard, one on the basis of dening single metrics and the other on combinatorial indexes for resiliency.
Examples of single metrics, dened based on a general denition of resiliency, are found in [18] as category 1 and in [22] as category 2 resiliency measurements.
There are many specic single metrics for mea-suring resiliency in various elds. Interested readers can refer to [7] in economic science, to [7,12] in transportation, and to [19,23-26] in network sciences.
Besides, examples of resiliency indexes are men-tioned in [6,27,28] in economic, social, and environmen-tal sciences, in [7,29] in transportation infrastructures, and in [20] in communication networks.
2.4. Resiliency conceptual models
There are also some conceptual models of resiliency in the literature that help us to develop a better understanding of the concept, its components and its measurement procedure. Some of these models are reviewed below.
A general model in this respect is the resiliency as the super set combining survivability and recoverability model [1], which is presented in Figure 3:
\The Seismic Resilience of Communities" [30] is a conceptual framework to dene the seismic resilience of communities and quantitative measures of resilience that can be useful for coordinated research projects focusing on enhancing this resilience. The concep-tual framework is built upon two sets of resilience dimensions, the four R's (Robustness, Redundancy, Resourcefulness, and Rapidity) and TOSE (Technical, Organizational, Societal, and Economic).
\Transportation Resiliency Dimensions" [31] is another model which denes ten dimensions for char-acterizing transportation resiliency. These dimensions are: redundancy, diversity, eciency, autonomy
com-Figure 3. Resiliency as a combination of survivability and recoverability [1].
Figure 4. Transportation system performance hierarchy [32].
Figure 5. Transportation resiliency assessment framework [32].
ponents, strength, collaboration, adaptability, mobil-ity, safety, and the ability to recover quickly. The \Transportation System Performance Hierarchy" [32] is also a hierarchal representation of transportation system performance patterned following Maslow's hi-erarchy of human needs (Figure 4). This model is applied in the \Transportation Resiliency Assessment Framework" [32] to measure the amount of degrada-tion in transportadegrada-tion system performance when they encounter shocks (Figure 5).
\Resilience Disciplines" [17] is another conceptual model for resiliency in communication networks (Fig-ure 6).
In Figure 6, on the left side, there are challenge tolerance disciplines dealing with the design and engi-neering of systems that continue to provide service in the face of challenges. On the right side of this gure, however, there are trustworthiness disciplines, which
describe the measurable properties of resilient systems. The relationship between these two is robustness, which is formally known as the performance of a control system when perturbed, or the trustworthiness of a system when challenged.
Moreover, in order to evaluate network resilience, a resilient space state model was proposed in [17]. In this model, the service degradation is quantied, in the presence of challenges to the operational state of the network. Hence, the network is viewed as consisting of two orthogonal dimensions: one is the operational state of the network, which consists of its physical infrastructure and protocols; the second dimension is the services being provided by the network and its requirements. Both of these dimensions are multi-variant and there should be a clear mapping between the operational metrics and service parameters. In order to limit the number of states, the operational and service space of the network is divided into three regions, as shown in Figure 7. When challenges degrade the operational state of the network, the level of service being provided degrades, which, in turn, results in state transitions (S0-S1 and S0-S2). Resilience is then evaluated as the transition of the network through this state space. In the simplest case, resilience is the slope of the curve obtained by plotting P vs. N. For example, when comparing two services over a given network, the service with a smaller slope (S0-S1) is considered to be more resilient. Remediation mechanisms help drive the operational state towards improvement (S2-S3 transition), and recovery moves the operational state back to normal operation (S3-S0 transition).
Figure 6. Resilience disciplines [17].
Figure 7. Resilience state space [17].
Ad hoc Networks has been done using the resilient state space model. Both the service parameter and operational states are calculated based on a linear function of two metrics [33].
A methodology to measure the risk imposed by the various challenges threatening the system is proposed, as shown in Figure 8 [34].
Doerr and Hernandez [35] proposed a framework to measure the resiliency of a communication network based on a multilayer (related to a 7 layer OSI reference model for networks) and multidimensional (considering several metrics for resiliency calculation) concept. To this end, they developed a network simulator to study the resiliency performance of real networks. Their software explores the robustness of a network system as measured by a set of metrics for a given set of challenges using structural (topological) analysis, test bed emulation or simulation (Figure 9). This will result in an overall performance evaluation as well as an indication of \weak spots".
Figure 8. A risk assessment process for resilience, including example inputs and outputs [34].
2.5. Resiliency synonyms
Resiliency is frequently used in relation to other con-cepts. According to Castet and Saleh [1], survivability and resiliency are often compared in the technical literature, with resiliency being mostly described as a broader concept, a superset including survivability. In this regard, the authors describe resiliency as a combination of survivability and recoverability. Zhang et al. [12] used the term \Flexibility" as a synonym for resiliency in the context of water networks. Elsewhere, Whitson and Ramirez-Marquez [18] dened exibility as the ability to adapt to a range of adverse events without having to anticipate the particular response in advance. Chan and Fekri [36] described a
resiliency-Figure 9. A multi-dimensional, multi-layer network resilience analyzer [35].
connectivity metric in wireless sensor networks. West-mark [37] dened \connectivity" as the degree to which a system will perform when all nodes and links are available. In his comprehensive research on surviv-ability, Westmark [37] studied 52 research projects on network survivability and emphasized that there is no consistency between the authors on how to dene the concept. Having analyzed the related studies, he described 20 characteristics for survivability, among which were recoverability (the ability to restore services in a timely manner) and restorability (the ability of a system to recover from threat and provide services in a timely manner). It is noteworthy that other researchers included these two features as part of their denition for resiliency. Finally, he dened survivability as the ability of a given system with a given intended usage to provide a pre-specied minimum level of service in the face of one or more prespecied threats. In addition, according to the studies reviewed by him, survivability can be computed through measuring connectivity, network performance, network capacity, reliability and availability. Therefore, as mentioned in Section 2.2 above, and given the dierent denitions of resiliency and survivability, resiliency category 1 can be considered to be synonymous with survivabil-ity. In some references, resiliency category 1 (static resiliency) is dened and measured using the liter-ature on reliability. Whitson and Ramirez-Marquez [18] distinguished between resiliency and reliability, believing that in reliability, network failure sources are internal which occur due to the wear, tear or the intrinsic life of the network components. In category 1 resiliency, the failure sources are both external and internal. In fact, they are said to be external, as the components may cease to function due to man-made or natural events (events not considered under the norm and known as operating conditions) and internal, because, even in the face of external events, the components adhere to their intrinsic life characteristics. Sterbenz et al. [17] described the relation between survivability, security, reliability, and robustness with
resiliency, and emphasized that the term robustness is frequently used in a much less precise manner that is synonymous with resilience, survivability, or secu-rity. Therefore, as Henry and Ramirez-Marquez [22] also criticized, there exists a wide variety of dierent denitions, concepts and approaches many of which are not aligned with the basic meaning of resilience. Indeed, they believe that this trend makes resilience apparently just another buzzword and not an attribute of engineering systems. This, in turn, diminishes the importance attached to and, thus, the need for resilience.
2.6. Resiliency improvements strategies
A considerable amount of the literature on commu-nication networks resiliency is, in fact, devoted to proposing and testing dierent strategies for improving the resiliency behavior of these networks. Interested readers are referred to [17,19,23,25,26,38-44].
2.7. A summary of the observations made in the literature
Below is a general overview of the observations made from reviewing the literature on resiliency:
Denitions and models having been proposed re-garding the concept of resiliency are not yet stan-dard and consistent. In fact, there is a variety of general and specic denitions, models, metrics, and indexes for resiliency in various science and engineering disciplines.
Resiliency is related to the ability of a system to provide an acceptable service level in the presence of random or deliberate, internal or external forces.
Resiliency consists of the following steps: to resist a shock, to withstand the eects of a shock, to recover rapidly from a shock, and to avoid the shock through learning and adapting.
There are some classications for resiliency, based on the dierent aspects of this concept in dierent contexts.
Two main methods for resiliency assessment are dening and measuring single metrics and combi-natorial indexes. The other methods for evaluation of resiliency are space state diagrams and risk assessment processes.
Although there are many terms used synonymously for resiliency in the literature, none of them com-pletely captures its true sense.
3. Power systems and their communication network resiliency
Electrication is regarded as the most important engi-neering achievement of the 20th century [45]. In fact, modern life is strongly dependent on the continuous and ecient operation of electric power systems. How-ever, the increasing number of outages and blackouts of power systems around the world can be an indicator of the weakness of this system in completely fullling its function. In the recent decade, Smart Grids, as a two way communication system between all players in a power system, have developed to improve eciency and provide a better control for the power system. Nevertheless, this fundamental computing and com-munication network infrastructure is at a serious risk of malicious cyber and physical attacks, as well as accidental failures [46].
The trend of connecting electrical control systems to the Internet exposes all layers of a system to possible attack. Any telecommunication link that is even partially outside the control of the organization own-ing and operatown-ing power plants, Supervisory Control And Data Acquisition (SCADA) systems, or Energy Management Systems (EMSs) represents a potentially insecure pathway into the business operations of the company, as well as a threat to the grid itself [47].
Therefore being smart is not enough, power grids should be resilient and secure [48]. In other words, tomorrow's grid should be smart, exible and resilient, self healing and secure, with established standards [49]. To ensure system resiliency, it must be designed, implemented, managed, monitored, and adjusted as a holistic, systemic system [50].
3.1. Power communication system resiliency necessity and denition
Amin [49] has proposed a number of general denitions
for resiliency, and in line with that, has attempted to dene a self healing grid as \a system that uses information, sensing, control and communication tech-nologies to allow it to deal with unforeseen events and minimize their adverse impact". He further states that self healing leads into the resiliency of the power system [51].
As a result, power communication systems are both an internal source of threat to the power grid, as well as an infrastructure which enables designing and implementing resilient power systems and self healing strategies. In other words, the same information and communication technologies that enhance the resilience of the power system may also present a new set of vulnerabilities. Thus, there is a need to systematically identify and ameliorate the threats and weaknesses of communication and the control layer associated with the smart grid infrastructure [52].
Infrastructure resilience has been dened by the National Infrastructure Advisory Council of America as the ability to reduce the magnitude and/or duration of disruptive events. The resilience constructed based on this denition includes four outcome-focused abilities: (1) Robustness: The ability to absorb shocks and continue operating; (2) Resourcefulness: The ability to skillfully manage a crisis as it unfolds; (3) Rapid recovery: The ability to get services back as quickly as possible; and (4) Adaptability: The ability to incorporate lessons learned from past events to improve resilience (Figure 10) [53].
3.2. Power system and power communication system resiliency measuring and
calculation
Most of the studies conducted on power systems and power communication system resiliency are of a general and qualitative nature. There are, however, a few specic and quantitative research projects carried out in this regard, which will be reviewed below.
In one of such studies, Al-Ammar and Fisher [54] studied the degree of vulnerability of the North Amer-ican Electric Reliability Council (NERC) power com-munication network against attacks. They have dened resiliency analogous to that of `eciency' as a measure of the ratio of the weights of certain nodes/links `killed' or taken out of service to that of all nodes/links in service, as expressed mathematically with the following
formula: R =
PN
j=1(costs certain nodes `killed')
PN
j=1(costs all nodes in service)
; (1) where R is the resiliency, N is the number of nodes/links, and `costs' are the accumulated weights, which could be given in terms of distance, time delay, bit rate, or other quantitative measures [54].
Sridhar et al. [55] identied the types of cyber attack on industrial control systems. These attacks fall into ve categories: Data Integrity, Denial of Service (DoS), Replay, Timing, and De-synchronization. Ac-cordingly, they have identied the key control loops in power system operation and then determined the types of attack that will be eective against each control loop. In the end, they presented the basic concepts of attack resilient control using attack detection algorithms at the application layer.
Elsewhere, Reed et al. [56] have outlined a method to characterize the behavior of networked infrastruc-tures, with a focus on power delivery systems in the face of natural hazard events, such as hurricanes and earthquakes. They have combined the resilience measures of fragility and quality with the input-output model of 11-system infrastructures, namely: 1) Electric power delivery, 2) Telecommunications, 3) Transportation, 4) Utilities, 5) Building support, 6) Business, 7) Emergency Services, 8) Financial systems, 9) Food supplies, 10) Government, and 11) Health care infrastructure, in order to fully characterize the total functioning of the networked infrastructures and their interdependencies.
O'Rourke [57] discussed the resilience of criti-cal infrastructures, having tried to measure resilience based on the expected loss in infrastructure `quality' over recovery time. Thus, he has mathematically dened R as:
R = Z t1
t0
[100 Q(t)] dt: (2)
It is supposed that prior to a natural hazard, severe accident, or a terrorist action, Q(t) is equal to 100 percent. If the system is fully resilient, its quality remains at 100 percent after any disturbance. On the other hand, a total service loss results in a Q(t) of 0 percent. In the above formula, t0 is disturbance time
and, at time t1, the system is returned to its original
capacity. Therefore, according to T. D. O'Rourke's formula, R = 0 for a fully resilient system.
Ouyang and Due~nas-Osorio [58] have proposed a three-stage framework to analyze smart grid resiliency (Figure 11).
In Figure 11, the rst, second, and third stages, respectively, reect the resistant, absorptive, and
Figure 11. The performance response curve of a system following a disruptive event [58].
restorative capacities of a system. In each stage, a se-ries of resilience improvement strategies are introduced to realize the smart grids, and appropriate metrics are also identied and then combined to establish a Global Annual Resilience (GAR(R)) metric:
GAR(R) = RT
0 NP(t)dt
PH
h=1AIAh(R)
RT
0 NP(t)dt
; (3) where T is the time interval of a year, and its specic value is determined by the unit of t in the performance curve (Figure 11), NP(t) is the targeted performance curve during the recovery process, AIAh is the annual
impact area during hazard type h, H is the number of main hazard types, and R is the amount of recovery resources.
The metric presents the dierence between the `targeted performance area' and the `summation of annual impact area due to main hazard types', divided by the `targeted performance area'.
4. A conceptual framework for resiliency assessment of power communication networks based on resiliency matrix
The present paper mainly aims to design a framework for power communication network resiliency assess-ment, to make the designated framework operational, and to draw comparisons between dierent power com-munication network topologies based on the designed framework. This work is, in fact, a complementary step of a comprehensive research study conducted with the aim of designing optimal and robust power com-munication networks. In this section, the conceptual framework for a hypothetical network will be proposed, while in the next section, the concept is operationally presented using a real example.
4.1. An overview of the previous steps of the project conducted prior to the present one In the previous steps of this research, the optimal topological design of power communication network
was modeled, formulated, solved and tested as a multi objective problem based on a two layer (transit and access) concept for network architecture [59]. The designed model is fed by various input data and parameters (including a power network single line di-agram, communication requirements (operational and administrative trac), available communication media, and quality of service requirements) and outputs the, optimal/near to optimal, topology of power commu-nication networks. The PC/ISO model (Power Com-munication/Information System Optimization Model) and its optimal solver (Genetic Algorithm Solver) simultaneously select the set of transit nodes and links, the capacities of transit switches, the capacities and types of transit links, the set of access links and their capacities and types, and, nally, the primary routes that support network trac. The model selects the preferred design from among all available alternatives, based on a number of criteria, such as overall network cost, ideal delay performance, as well as ideal loss performance. In this model, reliability is considered in terms of a two-connectivity concept. In the rst implementation of the model, DPLC (Digital Power Line Carrier) and OPGW (Optical ber Power Ground Wire), as exclusive communication links on possession of power utilities, are considered the communication media. As the PC/ISO model is multi-objective in nature, the optimal design is not unique, and in the general form, there are many solutions for the problem, none of which dominates the others. Con-sequently, in order to obtain the nal topology among them, other criteria are to be taken into account as well.
As mentioned earlier, the recent trends in the design of communication networks tend to move to-wards building survivable, robust, and resilient net-works. Hence, resiliency is the key criterion required to complete our design process.
4.2. Reference models of this paper
To the best of our knowledge, no integrated framework has been yet introduced to measure power communi-cation network resiliency in the literature. Therefore, one of the objectives of the present study is to propose such a framework to bridge the existing gap.
In order to construct our framework, we have investigated numerous related papers, records, and theses. All of the literature reviewed in Sections 2 and 3 helped us generate and organize our purposes, objectives, ideas, denitions, and concepts in the form of a resiliency assessment framework, which we have termed the \resiliency matrix". Subse-quently, we attempted to model and calculate the elements of our framework for power communication systems.
It is noteworthy here that from all the reviewed
references, there were a few which played a more promi-nent role in our research. Our proposed framework is mainly based on research ndings in the eld of communication network resiliency and power system resiliency, especially the ones obtained in [17,35,58]. The resiliency disciplines [17] shown in Figure 6 were the basis of the challenges and responses in our frame-work. In addition, we developed and detailed the concept of resiliency state space [17], as illustrated in Figure 7, to measure the resiliency of each element in our framework. A general description of multi-layers, multi-metrics resiliency evaluation in networks is pro-vided in [35]. We have presented a formal and specic representation of the multi-metric resiliency calculation of power communication networks in a physical layer (layer 1 from the 7 layers in the ISO reference model). To calculate the resiliency elements in our framework, we have used the \performance response curve" as well as the \targeted performance area", the two concepts we have borrowed from reference [58].
Although our framework is a general one and is able to cover both resiliency category types 1 and 2 [18], the case study only deals with resiliency category type 1.
4.3. A conceptual framework for power communication network resiliency study There are multiple operational and administrative applications for power communication networks, in-cluding conventional services, such as transmission of tele-protection signals between adjacent substa-tions, centralized control of important power plants and substations, operational telephony, administrative telephony, and le transfer, etc., as well as new services, such as real time wide area protection and measurement, and administrative data communication due to deregulation and restructuring of power sys-tems. As each of these applications demands specic and dierent Quality of Service requirements (such as Reliability, Delay performance, and Integrity of Data), this dierentiation should be considered in the resiliency framework of power communication systems. (The main concept of resiliency dierentiated quality of service architecture has been described in [42].) In addition, each of the network challenges may have an impact on various network performance measures in dierent ways. As an example, removing one node or edge can destroy the all terminal reliability of a network, yet have a negligible impact on its data loss.
In this case, logically, we cannot rely on a single resiliency metric or even a combinatorial resiliency in-dex for all applications, given all service requirements. It is, thus, necessary to study the resiliency of each service performance parameter, against each challenge, for every application of the network.
In the same vein, we hereby introduce \power communication network resiliency matrix" as a tool for studying the dierent impacts of \network challenges" on what we refer to as \network response" hereafter in this paper. Each network response represents the behavior of one of the network performance parameters against a challenge. The resiliency of each response in the face of each challenge is computable regarding specic performance requirements for network applica-tions.
To have a formal representation, we assume that a power network communication system encounters challenges and produces responses. Challenges and responses may be adopted from resiliency disciplines shown in Figure 6 [17]. Each challenge inuences each response in a dierent way (or may not have an impact). Therefore, we have resiliency elements overlay to form a resiliency matrix. This concept is displayed schematically in Figure 12.
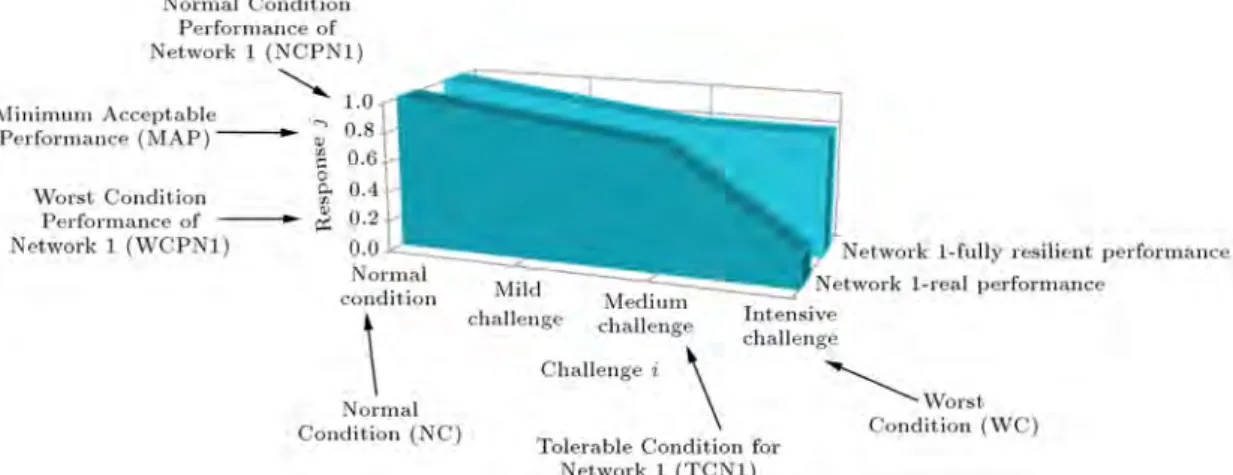
In order to calculate the elements of a resiliency matrix, the space diagram for each challenge-response state is to be drawn rst. A hypothetical example is presented in Figure 13 to show the response, j, of three networks encountering challenge i, and their resiliency and related formulas are also provided.
Figure 12. The main concept of resiliency matrix.
Figure 13. An example of callenge-response state space diagram.
It can be observed from the gure that, although network 1 shows better performance under normal conditions, its performance degrades more drastically, compared to networks 2 and 3, as the challenging condition worsens. This can highlight the importance of resiliency, besides optimality (that is based on normal situation performance calculation), in designing complex systems and networks.
Using the challenge-response state space dia-grams, we can arrive at 3 methods for calculation of resiliency matrix elements, as described below. It has to be noted that the denitions cover resiliency type 1. The formulas are written for network 1, with the abbreviations explained in Figure 13.
1. The resiliency of response i to challenge j is the proportion of tolerable challenge to maximum challenge. Tolerable challenge is the amount of challenge, i, whose response, j, meets the Minimum Acceptable Performance (MAP) of the network. Through worsening the challenge condition more than the tolerable amount, the network perfor-mance degrades in such a way that its operation will not be acceptable:
Rij =(TCNWC NC1 NC): (4)
2. The resiliency of response j against challenge i can be obtained from the proportion of response changes to challenge changes;
Rij =
1 +(NCPN1 WCPN1)(WC NC) 1
: (5) Moreover, the derivative of response j to challenge i on the response-challenge curve can be applied to estimate spot resiliency.
3. Similar to [58], the resiliency of response j to challenge i may be derived from the proportion of the area under the real performance curve to the area under the fully resilient performance curve (Figure 14).
It is worth mentioning here that the minimum acceptable performance level diers for various appli-cation services. These levels should thus be carefully dened in the integrated framework for the power communication network resiliency. Another important issue to be noted is related to measuring resiliency category type 2. In this case, we may add another dimension (time) to the challenge-response state space diagram, and measure the time the network needs to come back to its normal condition, due to corrective actions.
Figure 14. Method 3 for resiliency calculation.
5. Calculation of the power communication networks resiliency matrixes and
comparison of dierent network topologies according to their resiliency matrix - Case study
In the previous section, we developed a conceptual framework for power communication network resiliency assessment based on its resiliency matrix. In this section, this concept is detailed and operationally represented using a real example.
5.1. Problem denition
As also mentioned in Section 4.1, designing power communication networks has been formulated as a multi objective optimization problem (PC/ISO), which has been solved by a special Genetic Algorithm (GA Solver) [59]. The PC/ISO GA solver takes a single line diagram, trac needs, and performance requirement data as inputs, and, in return, yields the near to optimal communication network topologies (the set of transit nodes and links, the capacities of transit switches and links, the set of access links and, nally, the transmission media for each topology) as outputs. Here, we attempt to form and calculate the resiliency matrix for each of the networks' designed topologies, based on the framework that is conceptually developed and described in Section 4. Subsequently, comparisons will be made between the network topolo-gies using their resiliency matrixes to nd the one outperforming the others, in terms of resiliency. 5.2. Modeling and calculating the power
communication network resiliency matrix To form the resiliency matrix of the power communica-tion networks in the topology layer, the challenges and responses are chosen from the faults and performances of the physical layer in power communication networks. For this purpose and in line with resilience disciplines shown in Figure 6 [17], `random faults' and `intentional attacks' are considered network `challenges', and
`net-work connectivity', `two connectivity', `all terminals reliability', and `data loss due to physical challenges' are considered performance measures or `responses'. Having 2 challenges and 4 responses, the resiliency matrix was thus formed with 2 rows and 4 columns. 5.2.1. Network model
In the real world, communication networks involve a large number of components and considerations. As for the current research, however, real conditions and parameters have been simplied to a considerable degree. In fact, here, a communication network is modeled as an undirected and simple graph consisting of m nodes and n links. There are two groups of nodes and links, according to the two layers of the hierarchical design of the networks in our optimal designs mentioned previously. One group includes the nodes and links in the core (transit) layer, and the other are the nodes and links in the access layer [59]. The transit layer forms the mesh topology (having at least two connectivity nodes), while this condition does not apply to the access layer. The topology of the core and access layers, and the type, capacity and reliability of the links are known in advance. It is supposed that the nodes are completely reliable and have buers with innite capacities. Furthermore, the reliability of OPGW and DPLC links are considered to be 0.9999 and 0.99, respectively.
5.2.2. Random faults challenge
All of the networks encounter random and non-intentional faults. Random faults may be intrinsic or external. Intrinsic faults pertain to internal weaknesses of the materials and components of the links and nodes, whereas external faults arise due to natural and local events, mal operation, etc. The intrinsic faults of nodes and links are indicated in the gure presenting their reliability. External faults can be modeled as a challenge in our resiliency study. Very often, the nodes, especially the important ones with high degrees, are
redundant and very resistant against random faults. Hence, one of our simplifying assumptions is that the nodes do not fail and the links have two possible states; healthy or failed. We do not consider repair in this study, as we have mainly focused on resiliency type 1 (static resiliency). Faults may occur on transit links or on access links. A fault on an access link is usually more severe than a fault on a transit link, as the transit links are in mesh conguration.
5.2.3. Intentional attacks challenge
In order to illustrate intentional and terrorist attacks, we have adopted the model of LaViolette et al. [23] in this study. In their model, exactly one of the network's highest degree nodes is removed. Depending on the magnitude degree of the removed node, the challenge could be more severe. Here, 5 scales have been used to prove the hardness of the intentional attack challenge occurring as a result of removed nodes. These 5 scales are as follows: 1) One of the least degree nodes is removed, 2) One of the nodes with more than the least degree and less than medium degree is removed, 3) One of the medium degree nodes is removed, 4) One of the nodes with more than medium and less than the highest degree is removed, and 5) One of the highest degree nodes is removed.
5.2.4. Connectivity response
The connectivity of a communication network is de-ned as a quality or condition of a communication network when all of its nodes can be connected to one another. It is obvious that in a normal situation, we have a totally connected network. As the network encounters challenges, connectivity degrades in the network. That is, some nodes may be disconnected from the others when challenges arise. The percentage of disconnected nodes can be derived mathematically. Let A be the adjacency matrix of a network with m nodes. It is proved that the element in row i and column j of the Ak matrix is equal to the number
of walks of length k between nodes i and j of that network [60]. Thus, the following formula can be used to show the number of walks of length 1; 2; :::; m that exist between two nodes in the network:
B = A + A2+ A3+ ::: + Am: (6)
Since the largest number of steps it could take to go from one node to another is m steps, matrix B can help us gure out if there is any disconnectivity in the network, and, if yes, how to quantify it.
If Bij = 0, it is interpreted that nodes i and j
cannot be connected in m steps or less, and, therefore, this pair will never connect, and the graph is not connected either. The proportion of such disconnected pairs of nodes to all pairs of nodes can be dened as the disconnectivity of the network. This rate can be
calculated through some matrix calculations and using Boolean Algebra in Eq. (6).
5.2.5. Two connectivity response
Two connectivity is one of the most important proper-ties of highly reliable networks [61]. Therefore, this quality and its changes when encountering network challenges have been calculated. The percentage of at least two connected nodes can be easily derived from the adjacency matrix of a network.
5.2.6. All terminal reliability response
The all-terminal (also known as uniform or overall) reliability of a network is dened as the `probability' that every node can communicate with every other node through some (non-specied) path of arcs for a stated mission time, not allowing repair [62]. `All terminal reliability' calculation of a network is a NP-hard problem [61,62]. For this reason, for medium and large networks, `estimation' using Monte Carlo simu-lation or `approximation' using theoretical bounds has been used in the literature. In the present study, the approximation method has been utilized to calculate resiliency. In this regard, Jan [63] proposed a well known formula for upper bound reliability, as follows.
Let G be a network with degree sequences, d1; d2; ::: and dn, and q = 1 p be the unreliability
of each link in G. Then, the reliability of network G is: R(G)1
(n X
i=1
qdimi
k=1(1 qdk 1)i 1k=mi+1(1 q
dk)
) ; (7) where mi= min (di; i 1) ; i = 1; 2; :::; n.
One limitation of Jan's bounding method, how-ever, lies in the fact that it requires all links to have the same reliability, which is an unrealistic assumption for many problems, as well as the one posed in this study. Therefore, Konak and Smith's [62] upper bound formula has been employed for the purpose of this research, as it is more realistic and applicable for dierent reliabilities for dierent links. As can be viewed below, in this formula an upper bound for the all-terminal reliability of network G with m nodes is given by:
R(G) 1 Xm
i=1
[xki2Ei(1 pki)]
:i 1 j=1
1 xkj2Ej(1 pkj)
(1 pij)
; (8)
where:
G is the undirected graph that forms a network topology;
m is the number of nodes in G; R(G) is the all-terminal reliability of G;
Table 1. Substation to substation trac needs of YREC power communication system (Kbit/sec) [59]. W1
W2 16
W3 16
W4 16 8
W5 91.6 19 91.6 19
W6 8 19
W7 27 8
W8 19 8 8
W9 9.6 25.6 9.6 25.6 35 33.6 9.6 73.6
W10 19 9.6
W11 16 16 99. 6 8 8 8 17.6 8
W12 19 25.6 8 16
W13 19 9.6 8
W14 19 25.6 16
W15 19 9.6 8 8
W16 19 57.6
W17 19 41.6 8
W18 19.8 8 25.6 8 8 8
W19 19 25.6 8
W20 19 9.6 8
Substations (access nodes)
W1 W2 W3 W4 W5 W6 W7 W8 W9 W10 W11 W12 W13 W14 W15 W16 W17 W18 W19 W20
xij is the arc between nodes, i and j
(xij= xji);
pki is the reliability of the arc from node k
to node i (pki= pik); and
Ei is the set of the arcs incident to node i.
5.2.7. Data loss or data integrity response
Data loss in communication systems may occur for various software and hardware reasons. Physical disconnectivity, capacity limitations of the nodes and links, data coding methods and other similar reasons may all lead to data loss and delay. Since there are many details in this phenomena, for simplicity, we have found an upper bound for data integrity (or a lower bound for data loss) by estimating the percent of data that would be lost in the network due to physical challenges (nodes or links removal). However, if the main data center is removed, the integrity factor will be decreased remarkably, which, in turn, leads us towards strengthening the network at that point.
5.3. Implementation of the power
communication networks challenges and responses models { Case study and numerical results
In order to study the implementation of our proposed model, a case study has been conducted on one of
the Iranian Regional Electric Companies. The single line diagram and trac requirements of Yazd Regional Electric Company (YREC) are illustrated in Figure 15 and Table 1. Following the optimal topological design of power communication networks using the genetic algorithm [59], two communication network topology designs; one with least costs and the other with least delay, are then chosen, as presented in Figures 16 and 17. The capacity and reliability of links are also shown in the gures. As can be observed in Figures 16 and 17, network 2 is more centralized in comparison with network 1, having higher cost and less delay. We expose these two network topolo-gies to challenges to study their resiliency behav-iors.
The network models (topologies, trac, com-ponent reliabilities), and their challenges and re-sponses are analyzed using MATLAB software-version R2009a.
This program takes network topologies, trac requirements and component reliabilities as its inputs; exerts two kinds of challenge (`random fault' and `in-tentional attack') on them in dierent hardness levels; calculates the four kinds of responses (`connectivity', `two connectivity', `all terminal reliability' and `data loss') of the networks to challenges; and, nally, forms the resiliency matrix for each case.
Figure 15. YREC single line diagram [59].
Figure 16. YREC communication network 1 [59].
It has to be noted that all calculations are exact and not randomized. The minimum acceptable perfor-mance of responses in each case has been considered to be the same as the responses in their normal situation. The resiliency behavior of networks 1 and 2 (Figures 16 and 17) against challenges 1 and 2, based on mean
statistics, are displayed in Figures 18 and 19. The best and worst situations for network 1 behavior against challenges 1 and 2, based on minimum and maximum statistics is also shown in Figures 20 and 21. The resiliency matrix for networks 1 and 2 come in the following.
Figure 17. YREC communication network 2.
Figure 18. Responses of networks 1 and 2 to challenge 1.
Normal condition response net1 = 1:0000 0:3500 0:8952 1:0000 Normal condition response net2
= 1:0000 0:2000 0:8686 1:0000 Resiliencynet1 =
0:9683 0:9894 0:6666 0:9772 0:8285 0:8857 0:2000 0:8414 Resiliencynet2 =
0:9683 1:0000 0:6667 0:9796 0:7367 0:8750 0:2500 0:7676
Figure 19. Responses of networks 1 and 2 to challenge 2.
Figure 20. Worst and best responses of network 1 to challenge 1.
It is possible to dene \Total Network Resiliency" through combining the elements of the resiliency ma-trix. In the simplest form, total network resiliency may be dened as the sum of all elements in the resiliency matrix divided by the number of these elements. Using this denition, the total resiliency for networks 1 and 2 will be 0.7946 and 0.7805, respectively. Considering the dierent importance factors for challenges (based on their occurrence probability or other criteria), it
is possible to weigh the challenges to obtain other formulas for computing total network resiliency. 5.4. Discussion
It is evident from the results that the responses of network 1 under normal conditions outperform the ones yielded by network 2. Figures 18 and 19 also reveal the overall superiority of network 1 over network 2 under various degrees of challenges. Having studied
Figure 21. Worst and best responses of network 1 to challenge 2.
the resiliency matrix of both networks, one can ob-serve that the resiliency behavior of network 1 against challenge type 2 is better than that of network 2. In other words, network 1 is found to be more robust than network 2 against intentional attacks. The behavior of both networks against challenge type 1 (random failure), however, does not show any signicant dier-ences. It should be noted that the minimum acceptable performances of the networks are considered to be the same as their normal conditions. Thus, ideal points for the resiliency calculation of network 2 are less than those of network 1.
The exact study of the worst behavior of each response against each challenge, as shown in Figures 20 and 21 for network 1, as the superior topology, helps the designer identify weak points (nodes or links) in the network design, and, accordingly, appropriate strategies can be applied to strengthen them.
6. Conclusion and future researches
In the present study, we rst presented a literature survey related to resiliency denitions, synonyms, models, and evaluation methods. Having considered the importance of resiliency in power communication networks, we then proposed a framework for resiliency assessment of such a network using recent literature in this eld. This framework is based on dening and measuring challenges, the network responses against these challenges, and forming the resiliency matrix. As a case study, some of the challenges and responses related to the physical layer of two alternative power
communication network plans were modeled and nu-merically studied. The results indicate that this framework is potentially if use as a complementary tool in the optimal design of power communication network processes. In fact, this complementary tool helps the designer ensure the resiliency and robustness of the nal design.
This study can be enhanced if more challenges and responses are considered besides the ones related to physical layers, so that other possible threats (such as cyber attacks) and weaknesses of power communication networks are assessed and analyzed also. In addition, detailed denition and modeling of responses related to various service applications of such networks will enable us to protect more critical services, such as protection and control services, against threatening attacks.
It is noteworthy that a complete resiliency study is the one which highlights the changes in the perfor-mance of a challenged system during a time scale. As a consequence, the main extension of this work can be an attempt to measure resiliency in three dimensional space (challenges, responses, and time) based on a coherent and systematic approach.
References
1. Castet, J.F. and Saleh, J.H. \On the concept of survivability, with application to spacecraft and space-based networks", Reliability Engineering and System Safety, 99, pp. 123-138 (2012).
2. Dagle, J. \Smart grid resilience", A Presentation from: Advanced Power and Energy Systems, Pacic
Northwest National Laboratory, Presented to the ISA Richland Section, March 13 (2012).
3. Merriam-Webster Online Dictionary, Resilience (2010). http://www.merriam-webster.com/dictionary /resilience.
4. Westrum, R. \A typology of resilience situations", in E. Hollnagel, D.D. Woods, and N. Levenson (Eds.), Resilience Engineering: Concepts and Precepts, Ash-gate, Burlington, VT, pp. 55-66 (2006).
5. Serway, R. \Mechanics of solids and uids", In: Physics for Scientists and Engineers with Modern Physics, Second Edition, New York, NY: Saunders College Publishing (1986).
6. Briguglio, L., Cordina, G., Bugeja, S. and Farrugia, N. Conceptualizing and Measuring Economic Resilience, Working Paper, Economics Department, University of Malta (2005)
7. Cox, A., Prager, P. and Rose, A. \Transportation security and the role of resilience: A foundation for operational metrics", Transport Policy, 8(2), pp. 307-317 (2011).
8. Carpenter, S., Walker, B., Anderies, J.M. and Abel, N. \From metaphor to measurement: Resilience of what to what?", Ecosystems, 4(8), pp. 765-781 (2001).
9. Hilton, J., Wright, C. and Kiparoglou, V. \Building resilience into system", IEEE International Systems Conference (SysCon), Vancouver, BC, pp. 1-8 (2012).
10. Grossmann, I.E. and Morari, M. \Operability, re-siliency and exibility-process design objective for a changing world ", Proceeding of Second International Conference on Foundations of Computer Aided Process Design, Snowmass, Co, USA (1983).
11. Karafyllis, I. and Kokossis, A. \On a new measure for the integration of process design and control: The disturbance resiliency index ", Chemical Engineering Science, 57(5), pp. 873-886 (2002).
12. Zhang, Zh., Feng, X. and Qian, F. \Studies on resilience of water networks", Chemical Engineering Journal, 147(2-3), pp. 117-121 (2009).
13. Heaslip, K., Louisell, W. and Collura, J. \Quantitative evaluation of transportation resiliency for regional net-works", 88th Transportation Research Board Annual Meeting, Washington, DC (2009).
14. Zazlidniak, P., D'Amico, A. and McCallanl, D.H. \Achieving information resiliency", Information Secu-rity Technical Report, 4(3), pp. 54-62 (1999).
15. Lee, J., Chapin, S.J. and Taylor, T. \Computational resiliency", Qual Reliab Engng. Int., 18(3), pp. 185-199 (2002).
16. Xie, L., Smith, P., Baneld, M., Leopold, H., Sterbenz, J.P.G. and Hutchison, D. \Towards resilient networks using programmable networking technologies", Sev-enth Annual International Working Conference on Active and Programmable Networks (IWAN 2005), Sophia Antipolis, France (2005).
17. Sterbenz, J.P.G., Hutchison, D., Cetinkaya, E.K., Jabbar, A., Rohrer, J.P., Schollero, M. and Smith, P. \Resilience and survivability in communication networks: Strategies, principles, and survey of dis-ciplines", Computer Networks, 54(8), pp. 1245-1265 (2010).
18. Whitson, J.C. and Ramirez-Marquez, J.E. \Resiliency as a component importance measure in network re-liability", Reliability Engineering and System Safety, 94(10), pp. 1685-1693 (2009).
19. Brinkmeier, M., Fischer, M., Grau, S., Schafer, G. and Strufe, T. \Methods for improving resilience in communication networks and P2P overlays", PIK, 32(1), pp. 64-78 (2009).
20. Sousa, B., Pentikousis, K. and Curado, M. \REF: Re-silience evaluation framework", International Congress on Ultra Modern Telecommunications and Control Systems and Workshops (ICUMT), IEEE, Moscow, Russia, pp. 703-709 (2010).
21. Rose, A. \Economic resilience to natural and man-made disasters: Multi- disciplinary origins and con-textual dimensions", Environmental Hazards, 7(4), pp. 383-395 (2007).
22. Henry, D. and Ramirez-Marquez, J.E. \Generic met-rics and quantitative approaches for system resilience as a function of time", Reliability Engineering and System Safety, 99, pp. 114-122 (2012).
23. LaViolette, R.A., Beyeler, W.E., Glass, R.J., Stamber, K.L. and Link, H. \Sensitivity of the resilience of congested random networks to rollo and oset in truncated power-law degree distributions ", Physica A; Statistical Mechanics and Its Application, 368(1), pp. 287-293 (2006).
24. Kim, S., Lee, H. and Lee, W.Y. \Improving resiliency of network topology with enhanced evolving strate-gies", Proceedings of the Sixth IEEE International Conference on Computer and Information Technology (CIT'06), Seoul, Korea (2006).
25. Morehead, R. and Noore, A. \A novel hybrid miti-gation strategy for improving the resiliency of hier-archical networks subjected to attacks", Physica A: Statistical Mechanics and Its Applications, 378(2), pp. 603-612 (2007).
26. Gutfraind, A. \Optimizing topological cascade re-silience based on the structure of terrorist networks", PLoS ONE, 5(11), e13448 (2010). Doi:10.1371/ jour-nal.pone.0013448.
27. Mayunga, J. \Understanding and applying the concept of community disaster resilience: A capital-based approach", Summer Academy, Megacities: Social Vul-nerability and Resilience Building Munich, Germany, (2007).
28. Asia Regional Task Force on Urban Risk Reduction. City Prole: Climate and Disaster Resilience, Kyoto University (RTF-URR) (2008).
29. Urena Serulle, N. \Transportation network resiliency: A fuzzy systems approach", Utah State University,
MSc. Thesis (2010). http://digitalcommons.usu.edu /etd/769
30. Bruneau, M., Chang, S., Eguchi, R., Lee, G.,
O'Rourke, T., Reinhorn, A., Masanobu, S., Tierney, K., Wallace, W. and Winterfeldt, D. \A framework to quantitatively assess and enhance the seismic resilience of communities", Earthquake Spectra, 19(4), pp. 733-752 (2003).
31. Murray-Tuite, P. \A comparison of transportation network resilience under simulated system optimum and user equilibrium conditions", Proceedings of the Winter Simulation Conference, WSC 06, Monterey, CA, pp. 1398-1405 (2006).
32. Heaslip, K., Louisell, W., Collura, J. and Serulle, N.U. \A sketch level method for assessing transportation network resiliency to natural disasters and man-made events", In the Proceedings of the 89th Annual Meeting of the Transportation Research Board TRB, Washing-ton, DC (2010).
33. Jabbar, A., Narra, H. and Sterbenz, J.P.G. \An approach to quantifying resilience in mobile Ad hoc networks", 8th IEEE International Workshop on the Design of Reliable Communication Networks (DRCN), Krakow, Poland, pp. 140-147 (2011).
34. Scholler, M., Smith, P. and Hutchison, D. \Assessing risk for network resilience", IEEE, 3rd International Congress on Ultra Modern Telecommunication and Control Systems and Workshops (ICUMT), Budapest, Hungry, pp. 1-7 (2011).
35. Doerr, Ch. and Hernandez, J.M. \A
computa-tional approach to multi-level analysis of network resilience", Third International Conference on Depend-ability, IEEE Computer Society, Venice, Italy, pp. 125-132 (2010).
36. Chan, K. and Fekri, F. \A resiliency-connectivity met-ric in wireless sensor networks with key predistribu-tion schemes and node compromise attacks", Physical Communication, 1(2), pp. 134-145 (2008).
37. Westmark, V.R. \A denition for information system survivability", Proceedings of the 37th Hawaii Interna-tional Conference on System Sciences (2004).
38. Buysse, J., De Leenheer, M., Dhoedt, B. and Develder, C. \Providing resiliency for optical grids by exploiting relocation: A dimensioning study based on ILP", Computer Communications, 34(12), pp. 1389-1398 (2011).
39. Boyce, J.M. \Packet loss resilient transmission of MPEG video over the internet", Signal Processing: Image Communication, 15(1,2), pp. 7-24 (1999).
40. Bejerano, Y., Busi, I., Ciavaglia, L., Hernandez-Valencia, E., Koppol, P., Sestito, V. and Vigoureux, M. \Resilient multipoint networks based on redundant trees", Bell Labs Technical Journal, 14(2), pp. 113-130 (2009).
41. Veitch, P. and Johnson, D. \ATM Network Resilience", Network, IEEE, 11(5), pp. 26-33 (1997).
42. Autenrieth, A. and Kirstadter, A. \Engineering end-to-end IP resilience using resilience-dierentiated QoS", IEEE Communications Magazine, 11(5), pp. 26-33 (2002).
43. He, H., Jin, W., Bo, Y. and Peng, L.
\Multi-class MPLS resilience mechanism supporting trac engineering", Proceedings of the Seventh International Conference on Parallel and Distributed Computing, Applications and Technologies (PDCAT'06), IEEE, Taipei, Taiwan, pp. 393-398 (2006).
44. Autenrieth, A. \Recovery time analysis of dierenti-ated resilience in MPLS", In the Proceedings of the 4th International Workshop on Design of Reliable Com-munication Networks (DRCN), IEEE, Ban, Alberta, Canada, pp. 333-340 (2003)
45. \Electricity technology roadmap: Meeting the critical challenges of the 21st century, 2003 summary and synthesis", Electric Power Research Institute (EPRI) report, USA (2003).
46. Sanders, W.H. \Progress towards a resilient power grid infrastructure", IEEE Power and Energy Society General Meeting, Minneapolis, MN, USA, pp. 1-3 (2010).
47. Amin, S.M. and Giacomoni, A.M. \Smart grid, safe, secure, self-healing-challenges and opportunities in power system security, resiliency, and privacy", IEEE Power and Energy Magazine, pp. 33-40 (2012).
48. Critical National Need Idea: Smart is not Enough; Resilience and Securing Power Gri, this manuscript has been authored by Battelle Energy Alliance, LLC under Contract No. DE-AC07-05ID14517 with the U.S. Department of Energy,
49. Amin, S.M. \Resilience and self-healing challenges: Present/possible futures", CRITIS'08, 3rd Interna-tional Workshop on Critical Information Infrastruc-tures Security, Frascati,Rome, Italy (2008).
50. Henrie, M. \Identifying and building resilient cyber systems", ieRoadmapnews, Quarter 1 (2010).
51. Amin, S.M. \Toward resilient, smart and self-healing interdependent infrastructures", TCLEE 2009: Earth-quake Engineering in a Multi-Hazard Environment, Oakland, CA (2009).
52. Dagle, J.E. \Achieving resiliency by eliminating com-mon mode failures in the smart grid", IEEE, PES, Innovative Smart Grid Technologies (ISGT), Washing-ton, DC, pp. 1-2 (2012).
53. Berkeley, A.R. and Wallace, M. \A framework for establishing critical infrastructure resilience goals", Final Report and Recommendations by the National Infrastructure Advisory Council, USA, October 19 (2010).
54. Al-Ammar, E. and Fisher, J. \Resiliency assessment of the power system network to cyber and physical attacks", IEEE Power Engineering Society General Meeting, Montreal, Que., CA (2006).
55. Sridhar, S., Hahn, A. and Govindarasu, M. \Cyber attack-resilient control for smart grid", IEEE PES, Innovative Smart Grid Technologies (ISGT), Washing-ton, DC, USA, pp. 1-3 (2012).
56. Reed, D.A., Kapur, K.C. and Christie, R.D. \Method-ology for assessing the resilience of networked infras-tructure", IEEE Systems Journal, 3(2), pp. 174-180 (2009).
57. O'Rourke, T.D. \Critical infrastructure, interdepen-dencies, and resilience", The Bridge, 37(1), pp. 22-29 (2007).
58. Ouyang, M. and Due~nas-Osorio, L. \Resilience mod-eling and simulation of smart grids", Structures Congress, Proceeding, pp. 1996-2009 (2011).
59. Eshraghniaye Jahromi, A. and Besharati Rad, Z. \Optimal topological design of power communication network using genetic algorithm", Scientia Iranica, Transactions E: Industrial Engineering (2013).
60. West, D.B., Introduction to Graph Theory, Prentice Hall (1996).
61. Altiparmak, F. and Dengiz, B. \A cross entropy approach to design of reliable networks", European Journal of Operational Research, 199(2), pp. 542-552 (2009).
62. Konak, A. and Smith, A.E. \An improved general upper bound for all-terminal network reliability and its uses", Proceedings of the Industrial Engineering Research Conference, Ban, Canada (1998).
63. Jan, R.H. \Design of reliable networks", Computers and Operations Research, 20(1), pp. 25-34 (1993).
Biographies
Zohreh Besharati Rad received her BS degree in Electrical Engineering in 1989, and her MS and PhD degrees in Industrial Engineering respectively in 1996 and 2014, from Sharif University of Technology, Tehran, Iran. She has more than 20 years of experience in power communication system design and technology management, including consulting projects for Iranian Electric Power Utilities, and research projects for the Electrical Power Technology Research Center of Iran (MATN Co.). She has had about 28 papers in the above mentioned areas published in national and inter-national scientic journals and conference proceedings. Abdolhamid Eshraghniaye Jahromi received his PhD degree from the Polytechnic University of New York, USA, in 1992, and is currently working as As-sociate Professor in the Industrial Engineering Depart-ment at Sharif University of Technology, Tehran, Iran. His research interests include reliability engineering, methods engineering, productivity engineering, plant layout and facility location. His articles have been published in numerous journals related to the above mentioned research areas.
![Figure 1. Survivability and resilience/resiliency publications per year since 1960 [1].](https://thumb-us.123doks.com/thumbv2/123dok_us/8387890.2228687/2.892.65.421.150.338/figure-survivability-resilience-resiliency-publications-year.webp)
![Figure 3. Resiliency as a combination of survivability and recoverability [1].](https://thumb-us.123doks.com/thumbv2/123dok_us/8387890.2228687/3.892.477.831.931.1111/figure-resiliency-combination-survivability-recoverability.webp)
![Figure 5. Transportation resiliency assessment framework [32].](https://thumb-us.123doks.com/thumbv2/123dok_us/8387890.2228687/4.892.67.417.564.778/figure-transportation-resiliency-assessment-framework.webp)
![Figure 7. Resilience state space [17].](https://thumb-us.123doks.com/thumbv2/123dok_us/8387890.2228687/5.892.477.829.469.844/figure-resilience-state-space.webp)
![Figure 9. A multi-dimensional, multi-layer network resilience analyzer [35].](https://thumb-us.123doks.com/thumbv2/123dok_us/8387890.2228687/6.892.167.702.151.373/figure-multi-dimensional-multi-layer-network-resilience-analyzer.webp)
![Figure 10. Resilience construct for power system [53].](https://thumb-us.123doks.com/thumbv2/123dok_us/8387890.2228687/7.892.196.716.1008.1126/figure-resilience-construct-for-power-system.webp)
![Figure 11. The performance response curve of a system following a disruptive event [58].](https://thumb-us.123doks.com/thumbv2/123dok_us/8387890.2228687/8.892.454.808.151.355/figure-performance-response-curve-following-disruptive-event.webp)