Vertebral variation in teleostean fishes. II. The herring (Clupea harengus L.)
22
0
0
Full text
(2) 152. E. FORD. (3) As the biological groups of herrings are in many cases distinguishable by morphological characters, it is recommended that vertebral counts of selected material should be continued, additional characters such as the number of keeled scales being also studied when necessary. (4) It is recommended that a co-operative study be undertaken on the practicability of utilizing a count of separate portions of the vertebral series in such a way as to draw distinctions between morphologically distinguishable groups with a minimum of labour and material. Mr Ford accepted an invitation to prepare a scheme. Professor R. A. Fisher consented to act in an advisory capacity.. My personal associationwith resolution 4 was the outcome of my statement at the Lowestoft meeting that there is a well-differentiated group of from four to eight vertebrae at the tail-end of the herring backbone which can be counted with precision; and that the use of this much shorter count as an alternative to the more familiar" total number of vertebrae" in population analyses might perhaps give equally satisfactory results. But, since then, a study of vertebral variation among teleostean fishes in general (Ford, 1937) has revealed an embarrassing lack of information of the kind required for the effectiveuse of vertebral characters in population studies. In the pages which follow, therefore, the main effort has been to draw attention to the changes in form along the length of the herring backbone, and to illustrate by actual data the extent of individual variation which may be expected when working with statistical samples. At the same time, the ultimate purpose of the work, viz. the utilization of counts of separate portions of the vertebral series in such a way as to draw distinctions between morphologicallydistinguishable groups of herrings (vide Lowestoft resolution 4), has been borne in mind throughout. PRELIMINARY CONSIDERATIONS. There is no mistaking the backbone of a herring for that of any other fish. For despite the numerous points of agreement in anatomy with the backbones of allied species and genera within the great order Isospondyli and, indeed, with those of other orders as well, the attributes of Clupea harengus are discernible not only in the backbone as a compesite whole, but in each and every vertebral component throughout its length. There is at least the possibility that the species C. harengus exists in nature in a number of distinct subspecific forms, each with its own bodily characteristics, geographical distribution and established habits of migration, feeding and spawning. If this is so, it might be expected that the backbone, which so plainly reveals specific identity, would also afford clues to subspecific identity. That is to say, one would be able to determine from the backbone alone the particular subspecies to which any individual herritig should be referred. And this could be done just as surely for a fish caught outside the area and season of spawning as for one taken from a spawning shoal. On the other hand, the form of the herring backbone varies to a marked degree from individual to individual-so much so, that in practice it is simply.
(3) VERTEBRAL. VARIATION. IN TELEOSTEAN. FISHES. 153. a matter of routine to resolve any sample of, say, one huridred backbones into one hundred separate backbones, each visibly different in structure from all the rest. Hence, even if the species exists as a number of morphologically distinguishable subspecies, appreciable individuai variation in backbone form must be expected in each of them. Taking these facts into consideration, it becomes clear that a sharp distinction should be drawn between (a) a backbone character which, by itself, is definitely diagnostic of the species or subspecies, and (b) one which is primarily a measure of vertebral variation, and which only acquires significance as a clue to identity when it is taken in conjunction with corresponding data for other backbones. Characters of class (a) may be likened to "hallmarks", which at once establish identity in the individual and will only be seen in C. harengus, or in one particular subspecific form of C. harengus. It need hardly be said that the study of local populations of herrings and of their migrations would be rendered very much more straightforward if reliable characters of this kind could be determined. The matter has already received preliminary attention, with encouraging results, but it is as yet too early to publish a report. In the meantime, therefore, it is necessary to deal for the most part with backbone characters of class (b) which, in contrast with the positive anatomical attributes just referred to, are but statistical measurements. They are the raw data on vertebral variation of a particular kind among the particular group of individuals from which they have been derived. As such, they must be subjected to recognized statistical treatment if they are to yield the special information required. The technique is the routine one of assessing the amount of variation in statistical samples, and comparing the results. For this, counts along the vertebral series in accordance with distinct changes in form are obviously the most serviceable, and the ultimate preferment of one count over another will rest, first, on the degree of precision with which the count can be made, and secondly, on the amount of labour and material involved in its determination. Seeing that a great deal of work has already been done regarding variation in the so-called" total number of vertebrae", it may be asked why it should be necessary at this late stage to discuss the use of alternative counts? In reply it will probably be sufficient to advance three points: (I) Experience has shown that in the determination of the total count in each of, say, one hundred herrings, some doubt will arise as to the strict validity of the count in perhaps twenty individuals, because of some observed abnormality in structure (Ford, 1933). (2) Backbones composed of the same number of vertebrae may nevertheless differ in other respects; conversely, those which differ in the total may yet have other anatomical features in common. Consider, for example, the simple division of the backbone into an anterior part (a) and a posterior part (b) in accordance with a change in form at the junction of th~ two parts. The same total of 56 vertebrae is arrived at when (a) is 5° and (b) is 6, as when.
(4) 154. . E. FORD. (a) is 5 I and (b) is 5 ; alternatively, a total of 56 expressed as (so + 6) differs from a total of 55 expressed as (49 + 6), although the value of (b) is the same in both. (3) This point is suggested in part by the examples used above, namely, that in certain circumstances a much shorter count along the backbone may give as much information as the total count. Thus, the difference between a total count of 56 and a second of 55 may prove to be no more than a difference of 1 in the value of (b) which is 6 in the one backbone and 5 in the other, the value of (a) being 5° in both. When it is remembered that before any direct count along the backbone can be made, the parts to be counted must first be properly exposed to view, whether by X-ray, by dissection, by selective staining, or by preparing a whole skeleton, it will be realized that the shorter the length of backbone to be handled, the less the work of preparation and counting. Apart from this matter of practical economy in working, however, there is another sound reason for thinking that a different system of counting may sometimes yield more conclusive results. This has to do with the basic metamerism of the herring. Investigation has shown that in the anterior part of the body the basic metamerism remains to a large extent unimpaired, so that the vertebrae, ribs, myocommata and certain of the keeled scales along the mid-ventral line of the body are in step with one another. That is to say, a count of the keeled scales, provided that it begins and ends at the right place, is in effect a vertebral count. Details are given later on p. 168, and it will be sufficient here to say that such a count, being an expression of the fundamental constitution of the herring's bodily structure, is one of special interest in present considerations.. THE ANATOMY OF THE HERRING BACKBONE. The herring backbone has a characteristic form pattern in consequence of successive alterations in form from vertebra to vertebra along its length. Analysis shows that each of the vertebral components-the centrum, neural and haemal arches and their processes, the zygapophyses, etc.-changes in form from one vertebra to the next in its own appointed way, and that for the most part these form changes are evenly graded. At a number of points along the backbone, however, there is an abrupt change in the form of a component. Thus, at one point the form of the haemal arch will alter appreciably between adjacent vertebrae, while at a second point the form change will be seen in the neural arch, and so on. By determining the position of all such points along the backbone, the primary form pattern can be expressed in terms of a number of secondary patterns, each covering a well-differentiated group of vertebrae within which there is a distinctive gradation of form in at least one vertebral component. Moreover, it may be added that each of these secondary patterns is as characteristic of the herring as is the primary pattern..
(5) VERTEBRAL. VARIATION. IN TELEOSTEAN. FISHES. 155. Immediate interest centres in the number and serial position of the vertebrae over which the primary and secondary patterns are spread, since these vary from individual to individual within the range shown by the species. In Fig. I the left side of a backbone, consisting of a total of 56 vertebrae. .,. ,. 26. I(. k,,. n-. nu_n..m. k-_n__mu ,. ~. k~~~ ~~--~. , I ,. . , 27. , 30. IL-_n..-:.. ,. - 32n. :. 50. ",. 25 , D... u_u --- -- -- -:---. -h J>: C __m_m ----:--it ", . ,. :. Ah. B. n__m n'. ~:'. 2!9. 56. :. Eo. '. h___~. ~~~~-----~~~~~~~:~ ~~~::: --:- --~----~~~"---~~~::. :':"-. ~ -:~~~:~::~. G. ': ---~. :_:~::::: :--.:::: ~~::~.-:_-.~~ ~~::~--- _m- J.. '2. ;,. 5'. Fig. I. Above: profiles of key vertebrae; three alternative forms of the 32nd are shown. Centre: diagrammatic outline of backbone viewed from left side. Below: outline of two sections of backbone viewed from left side. The numbers represent serial numbers of the vertebrae: for particulars of A, B, C, D, E, F, G and T, see text, p. 156. between the skull and the terminal urostylar. segment,. is marked off in accord':'. ance with changes of pattern. It so happens that in the particular backbone represented in the figure the right side agrees with the left in the details portrayed, but it is important to note that such complete agreement between the two sides is by no means usual. The known frequency with which bilateral.
(6) E. FORD. 156. asymmetry occursrenders it necessaryin practiceto distinguish between counts along the left side and thdse along the right. Commg back to Fig. I, and remembering that in this instance the two sides are in agreement, it is seen that the backbone is composed as follows: Count denoted by ~. -. Left side Az Cz. ,. Median line B D. Fz.. Right side Ar Cr Fr. T. Group or-vertebrae counted Pre-caudal vertebrae with autogenous haemal arch Pre-caudal vertebrae with open haemal arch Vertebrae with autogenous neural arch Vertebrae with duplicated neural spine The" trunk" vertebrae, i.e. all the vertebrae except those at the tail-end in which the haemal spines are cross-tied to the centra All the vertebrae between the skull and the terminal urostylar segment. Last vertebra in count 24 25 26 29. 51 56. A further count E is not included in the above summary because it is not of the same category as those given. It marks the vertebra in which there is normally a sudden increase in the size of the haemal canal to provide housing for a blood vessel to the kidney. In the backbone figured this is seen in vert. 32. Reference should also be made here to the fact that the number of vertebrae in the "tail" group, although not specifically indicated in the summary, is given by Gz = (T - Fz) for the left side, and Gr = (T - Fr) for the right. Alternatively, of course, Gz and Gr can be direcdy determined as a separate CQunton the actual backbone. Now it can be stated without hesitation that the above series of counts is a highly discriminating description of any herring backbone. One might examine hundreds of specimens before obtaining two which did not differ in at least one respect. It could hardly be otherwise, seeing that all the counts named are subject to variation from fish to fish, even among those of the same biological group as defined in Lowestoft resolution I. In the routine determination of counts in samples of fish, certain irregularities in vertebral form are likely to be discovered which affect one or more of the counts in some 20 % of a sample. The chief of these irregularities are:. (i) Fusions of adjacent vertebrae. . (ii) Duplication of the neural and haemal spines on the two vertebrae immediately preceding the urostylar element. (ill) Irregularity in character E. The occurrence of fused vertebrae (see Fig. 2 on p. 157) has been dealt with in an earlier paper (Ford & Bull, 1926).The fusion may occur at almost any point along the backbone, although more often at some points than at others. If these fusions are counted, not as single units but as the number of vertebrae apparendy involved in the fusion, the total number of vertebrae is restored to the "normal". Duplication of neural and haemal spines on the two vertebrae immediately preceding the urostylar element (see Fig. 2 on p. 157) has also been the.
(7) VERTEBRAL. VARIATION. IN TELEOSTEAN. FISHES. 157. subject of an earlier report (Ford, 1933).The counts of the vertebrae in the "tail" group of vertebrae, i.e. counts Gz and Gr, are particularly affected by this irregularity, and it is therefore advisable in statistical work to treat such cases in a class apart from the rest.. Fig. 2. Above: double-spined vertebrae (A, B, C, D, E and F) at the tail-end of herring, from Ford (1933). In each of the diagrams the two vertebrae represented are those immediately anterior to the terminal (urostylar) segment. Below: abnormal vertebrae in the herring, from Ford & Bull (1926).. Normality in the secondary c01JIltE may be described simply~asan obvious enlargement of the haemal canal to give easy passage for a blood vessel to the kidney. In some backbones, however, either the closed haemal canal is divided into separate upper and lower compartments, or the canal is open between a large bony loop formed by the haemal arches of the two sides of the vertebra (see Fig. I). '.
(8) E. FORD. 158. INDIVIDUAL VARIATION IN VERTEBRAL COUNTS. The range of variation which may be expected in working through a sample of 100 herrings is satisfactorily indicated by actual data for a sample taken from a drift-net catch at Padstow in Cornwall in December 1935. All the counts were made on whole skeletons prepared by boiling and cleaning. Each count will be discussed in turn. Counts A I and Ar The number. of vertebrae. with autogenous. No. of vertebrae. .. A! (left side) Ar (right side) Sum. haemal arches varies as follows: Total '. no. of backbones. 22. 23. 24. 25. 12 II. 57 58. 29 29. 2 2. 23. 115. 58. 4. 100 100 A. mean=23'215. At first sight it would appear from the above summary that there is little difference in the counts along the two sides of the backbone. Actually, however, the left side count differs from that of the right side in 41 backbones, as will be seen from the alternative summary: No. of vertebrae. ~. A! (left side count) A;. (right side count) No. of backbones. ~. 22or~ ( 23. 22 4. 22 ) IS. 23. (. 39. 230r24 24 23 ) 22. ~ 24 I6. 24or25. ( 25. 24 4. ) = 100. It is seen that A I is the same as Ar in 59 backbones, and although the most,. frequently occurring value for both Al and Ar is 23, not more than 39 backbones give this count along both sides. Count B The number of vertebrae with open haemal arch varies as follows: .. 22 3. No. of vertebrae 23 26. .. 24 55. 25 15. ,. 26 1. Total. no.of. backbones 100 A. mean=23'850. This is a well-known count which has often been made in past work. Objection has been raised to it on the ground that partial bridging across the haemal arches may occur in several vertebrae anterior to the one in which the complete closure is seen. Orton (1916, p. 80), for example, in recording.
(9) VERTEBRAL. VARIATION. IN TELEOSTEAN. FISHES. 159. the serial number of the first vertebra having a complete haemal arch, considered it advisable to state in addition the number of vertebrae having an incomplete but "well-developed" arch-and an arch was recorded as "w:elldeveloped" if the haemal processes were almost as large as those of the first complete arch and possessedeven the smallest trace of an internal cross-piece. In his opinion, it is not improbable that in the living animal these incomplete but well-developed arches are closed by a cartilaginous cross-piece. Hence, he would seem to favour a statistical count of the number of vertebrae" with potentialities" for complete haemal arches,. rather than a count which includes only those vertebrae in which the haemal arch is unquestionably closed by a bony bridge. Certainly, the matter is one which should be borne in mind by any investigator proposing to use the counts in statistical work. Counts Cl and Cr The count of the number of vertebrae with autogenous neural arches varies from fish to fish and from side to side. Dealing first with the separate counts Cl and Cr: Total. .. No. of vertebrae C! (left side) Cr (right side). 24 I. 25 II. 1. -. Sum. 26. 12. 49. 27 33. 42. 39. 23. 91. 72. 28 6. no. of backbones 100. 7. 100. 13 A. mean=26'365. As with the counts A I and Ar, the extent of bilateral asymmetry is best. indicated by an alternative summary of the data: No. of vertebrae C! (left side count) c,. (right side 'Count) No. of backbones. 24 25. ~. I. 5. ~. 25. (26. or. ~). 25 12. 26 26. (27~ or ~26 ). 28. 23. ~ 27 21. (2728 or 27~ ) 7. ~ 28 3. = 100. Total of 57. The data show that Cl is the same as Cr in not more than 57 out of the total of 100 backbones. The most frequent value for both Cl and Cr is 26, yet only 28 backbones give this count along both sides. Count D. The number of vertebrae in which the neural spine is duplicated shows the following variation: No. of vertebrae 28. 29. 5. 32. 3° 55. 31 8. Total no. of backbones 100 A. mean=29.660.
(10) E. FORD. 160. Count E. As stated above, it is necessaryin making this count to anticipate instances of irregularity in the form of the haemal arch concerned. In the present sample there are I I backbones in which either the haemal canal is divided into upper and lower compartments, or the haemal arches form a large open loop. The variation in count E, shown by (a) the 89 normal backbones and (b) the I I irregular ones, is shown below:. Normal Irregular Sum. 31 2 2 4. No. of vertebrae -J 32 33 38 47 2 7 54 4°. 34 2. -. Total no. of backbones 89 A. mean = 32'449. 2. II. A.mean = 32'000. 100. A. mean = 32'4°°. Attention is drawn to the lower average value of the count in the irregular backbones. Although the number of such backbones in the present sample is much too small for statistical purposes, there is reason to believe that the lower average is not an entirely fortuitous result, since it has been observed in a number of other samples. One indication is that the irregular form of haemal arch is more common in backbones with a total of 55 vertebrae, excluding the urostyle, than in those with a total of 56, but, here again, the observation needs statistical confirmation. CountsFz and Fr It will be seen from Fig. Ion p. 155 that the backbone is divisible into the anterior and larger" trunk" group of vertebrae, followed by the posterior and much smaller group of "tail" vertebrae. Counting along the left side of the backbone, therefore, the total number of vertebrae (T) is the sum of the "trunk" count (Fz)and the "tail" count (Gz). Along the right side, (T) is the sum of (Fr) and (Gr). In the Padstow sample, only 85 backbones were "normal" in the sense that straightforward counts of "trunk", "tail" and "total" vertebrae could be made along both sides. In the remaining 15 this was not possible on account of some irregularity in vertebral form towards the posterior end of the backbone which interfered with the counts. For the normal backbones the values of Fz and Fr varied as follows: No. of vertebrae Fz (left side) Fr (right side) Sum. , 48 I I. 49 8 7 15. 50 44 38 82. 51 32 36 68. 52 I 3 4. Total no. of backbones 85 85 A. mean = 5°'347. The degree of individual discrepancy between Fz and Fr is indicated below in the same manner as before..
(11) VERTEBRAL. VARIATION. ~. FI Fr No. of backbones. 49. 49. IN TELEOSTEAN. or 5° (49 5° 49 ). 49 6. 2. 51 52 2. or i!. (5° 51 5° ). 50. 5° 36. 161. FISHES. 8. 52 52 1 =85. Total of 72. Thus, in 72 out of the total of 85 backbones, the left side count FI is the same as the right side count F" which is a greater proportion than with the counts A and C. Counts G1 and Gr The first of the "tail" group is distinguished from the last of the "trunk" group by the fact that in the former the haemal spine is cross-tied to the centrum by a bony strut (see Fig. I on p. 155). As with counts A, C and F, there is some measure of bilateral asymmetry, so that it is necessary to distinguish between the left and right side counts G1 and Gr. In the 85 normal backbones for which the values of FI and Fr have already been given, the values of G1 and Gr are as follows: Total. No. of vertebrae. -. '. 6 38 31 69. 5 43 47 9°. 4 2 2. G1 (left side) Gr (right side) Sum. 7 4 5 9. no. of backbones 85 85 A. mean = 5'5°0. and the extent of bilateral asymmetry: G1 Gr No. of backbones. 2. 6. 2. 4. 2. ). (265'or. 5 4°. 6 29. 8. ( or i) 3. 1. 7 3 =85. Total of 72. The data show that of the 72 backbones (ca. 85 % of the total of 85 examined), in which G1 is the same as G" there are 4° (ca. 47 % of the 85 examined) in which the count of "tail" vertebrae is 5 along both left and right sides. The Total Count (T) The total count (T) for the 85 normal backbones in the sample varies thus: No. of vertebrae Total .. 54 1. 55 19. 56 57. 57 8. no. of backbones 85 A. mean=55'847. With regard to the 15 "abnormal" backbones, 3 show fusions of vertebrae which make it difficult to determine (T) with certainty. In the remaining 12 .\OURN. MAR. BroL. ASSOC.vol. xxv, 1941. II.
(12) E. FORD. 162. there is duplication of the neural and haemal spines of one or both of the two vertebrae immediately preceding the terminal urostylar segment, although the centra are normal enough for an uninterrupted count of (T). The results of this count are compared with that for normal backbones:. Backbones with duplicated spines Normal backbones Sum. Total no. of backbones. No. of vertebrae --" 54 55 56 57 7 .5 I 8 19 57 I 26 62 8. 12 85 97. A. mean mean 55'417} A. 55'847 Diff . 0'43 A. mean 55"794. It is seen that duplication of spines is associated with a lowering of the total number of vertebrae (T), giving a difference of 0'43 in the value of the mean. If the number of "tail" vertebrae is considered, then it is found that the discrepancy is still more marked: Total no. of backbones. No. of "tail" vertebrae Backbones with duplicated spines. Normal backbones. G! Gr Sum G! Gr Sum. 4. 5. 6. 2 1 3. 9 10 19 43 47 90. I 1 2 38 31 69. -. 2 2. 7. 12 12 A, mean 4"958. 4 5 9. ~5 A. mean. 5'50;. l. Diff. 0'542. J. By contrast it is to be noted that the mean number of "trunk" vertebrae for the 12 abnormal backbones is 5°'459 as against 5°'347 for the normal. That is to say, abnormal and normal backbones agree approximately in the number of "trunk" vertebrae, the lowering of the mean value of (T) in association with duplication of spines being almost entirely accounted for by the reduction in the number of vertebrae in the "tail" (cf. Ford, 1933, p. 221). VARIATION FROM SAMPLE TO SAMPLE. Having given an idea of the nature and extent of backbone variation among the individuals of an average working sample, it is now proposed to compare the data for a number of different samples. The statistical material to be used in the comparisons was collected and tabulated by Dr A. G. Nichols and colleagues at the Millport Biological Station, to whom I am greatly indebted for their kindly co-operation in a tedious series of observations. The fact that the data were collected by independent workers adds to the interest, since it shows that the successive changes in form along the length of the backbone are sufficiently well defined to be recognized and used by persons other than myself. And so far as I am aware the Millport team experienced no great difficulty in determining with precision the whole series of vertebral counts required. It should be added that the four samples here to be considered were. '-~-.
(13) VERTEBRAL. VARIATION. IN. TELEOSTEAN. FISHES. J63. a deliberate selection from a total of seven which they analysed. That is to say, the comparisons to be made are not to be regarded as a critical examination of the actual herring populations occurring in the regions from which the seven samples were drawn, but rather as an illustration of the variation which investigators may expect to observe in carrying out such a regional study. General particulars of the four samples are given in Table I. TABLEI Serial no. of sample I. No. of fish examined 100. Locality Clyde. (from. Fairlie). 2. Brown Head, Arran. IIO. 3. Isle of Man. 217. 4. Isle of Man (Port Erin Bay). 105. Sexual condition. Length (em.) 21-27 (mainly 22-24) 23-28 (mainly 23-26) 22-28 (mainly 24-26) 21-28 (mainly 23-26). Mainly stage II Stage VI Stages VII-II Stage VII. It may be stated in the first place that each of the four samples included an appreciable proportion of abnormal backbones, mainly those in which there was duplication of the neural or haemal processes of the penultimate or antepenultimate vertebrae (Table II). TABLEII Serial no. of sample I 2 3 4. No. of backbones with fused vertebrae I (I %) 4 3. No. of backbones with duplicated neural and haemal spines 23 (23 %) 24 (21.8 %) 66 (3°'4 %) 15 (14'3 %). (1'9 %) (2'9 %). Remainder (normal backbones) 76 (76 %) 86 (78'2 %) 147 (67'7 %) 87 (82'9 %). In consequence of the high percentage of backbones with duplicated neural and haemal spines, the total number of vertebrae (T) for each sample is substantially lowered (Table III). TABLE III No. of vertebrae. -" Serial no. of sample I. Normal backbones Backbones with duplicated spines 2. Normal backbones Backbones with duplicated spines 3. Normal backbones Backbones with duplicated spines 4. Normal backbones Backbones with duplicated spines. 53. Total. Total count (T) arithmetic means no.rof 58 backbones and differences 76 56'132 0'436 23 55.696. 54. 55 5 7. 56 56 16. 57 15 -. -. I. 6 7. 61 17. 18 -. 4 7. 51 45. 81 12. 10 I. -. 2. 38 9. 41 6. -. 6. 86 24. 56'II6 55'708. 0'408. I. 147 66. 55'680 55'076. 0.604. -. 87 15. 55'586 55'4°0. 0'186. r. !. II-2.
(14) E. FORD. 164. TABLE IV COUNT A: No. Serial no. of sample 1 (Fairlie). 2 (Arran). 3 (LO.M.). 4 (LO.M.). OF VERTEBRAE WITH AUTOGENOUS HAEMAL ARCH Total No. of vertebrae no. of , , 21 22 Count 26 backbones A.mean 23 25 24 100 Al 13 44 40 3 II 2 100 Ar 52 35 Sum 24 96 75 5 23'305 10 62 IIO Al 33 5 10 IIO 64 32 Ar 4 Sum 20 126 65 23'286 9 3 2. Al Ar Sum. 5 2. Al Ar Sum. '. 2. 33 32. IIO 120. 64 55. 6 8. -. 1. 217 217. 1. 65. 230 49 58. II9 26 .22. 14. 25 23. 3 2. -. 48. 107. 48. 5. -. 23'173. -. 105 105 23'029. COUNT B: PRE-CAUDAL VERTEBRAE WITH OPEN HAEMAL ARCH Serial no. of sample 1 (Fairlie) 2 (Arran) 3 (LO.M.) 4 (LO.M.). 22. 4 4. COUNT C: No. Serial no. of sample 1 (Fairlie). 2 (Arran). 3 (LO.M.). 4 (LO.M.). Count 01 Or Sum Oz Or Sum Oz Or Sum 01 Or Sum. COUNT D: No. Serial no. of sample I (Fairlie) 2 (Arran) 3 (LO.M.) 4 (LO.M.). 23 27 21 81 42. No. of vertebrae - - . 24 25 47 17 58 26 107 45. 20 13. 26 7 5 5. -. 27 1. -. -. Total no. of backbones 100. A. mean 24'050. IIO 217. 24'136 23'728. 104. 23'644. OF VERTEBRAE WITH AUTOGENOUS NEURAL ARCH Total No. of vertebrae no. of r " 26 28 backbones A. mean 24 25 27 100 13 51 33 3 26 100 14 56 4 27 107 59 7 26'230 2 26 2 23 IIO 57 2 20 62 22 IIO 4 6 4 43 II9 48 26'041 1 86 23 93 14 217 II 3 19 91 93 217 186 4 177 42 25 26'429 8 9 49 39 105 2 II 39 49 4 105 2 20 12 98 78 26'371. OF VERTEBRAE WITH DUPLICATED NEURAL Total No. of vertebrae , no. of 28 27 29 30 . 31 32 backbones I 100 31 9 59 2 I IIO 44 48 15 I 2 9 78 96 31 217 1 1 41 49 7 105. SPINE. A. mean 29'800 29'718 29'705. 29'562.
(15) VERTEBRAL. VARIATION. IN. TELEOSTEAN. 165. FISHES. TABLE IV continued COUNT F: No. Serial no. of sample I (Fairlie). Count Fz Fr Sum. 2 (Arran). Fz Fr Sum. 3 (LO.M.). Fz Fr Sum Fz Fr Sum. 4 (LO.M.). , 47. I. -. I I I -. COUNT G: No.. Serial no. of sample I (Fairlie). 2 (Arran). 3 (LO.M.). 4 (LO.M.). OF VERTEBRAE IN "TRUNK" No. of vertebrae ' 49 50 48 48 IS I 13 46 28 I 94 13 46 55 IS 101 28 4. 35 44 79 20. I. 5 3 2. 22. 5. 42. 129 II7 246 60 60 120. 51 35 39 74 48 37 85 44 51 95 18 19 37. 52 2 I 3 2 3 5 5 3 8 4 2 6. OF VERTEBRAE IN THE "TAIL" NORMAL BACKBONES ONLY No.. of vertebrae. Count. 4. -. Gz Gr Sum Gz Gr Sum Gz Gr Sum GZ Gr Sum. I I 2 I I 2. THE TOTAL No. Serial no. of sample I (Fairlie) 2 (Arran) 3 (LO.M.) 4 (LO.M.). 54. -. I 4 2. 5 20. 25 45 25 24 49 69 63 132 34 31 65. 6 44 35 79. 5° 49 99 75 77 152. 5° 51 101. 7. 8. 10. 2. IS 25 II 13 24 I 6. I. 7 2 4 6. 3 -. Total no. of backbones 100 100. A.mean. 5°'25° IIO IIO 5°'291 217 217 50'048 1°5 1°5 49"986 GROUP. Total no. of backbones. 5'908 86 86. -. I. 5'855 147 147. I -. -. A. mean. 76 76. 5'568 87 87. OF VERTEBRAE. NORMAL BACKBONES ONLY Total No. of vertebrae no. of A.mean 58 backbones 56 57 55 56'132 76 5 56 15 18 86 6 61 56'II6 81 10 I 147 55.680 51 6 55"586 87 38 41. 5'638.
(16) E.FORD. 166. Table III on p. 163also showsthat the total number of vertebrae for normal backbones is higher in samples 1 and 2 than in samples 3 and 4. Thus, the arithmetic mean values of (T) for the former are approximately greater by 0'5 vertebra than those of the latter. A difference of this magnitude would certainly give grounds for suspecting a real populational difference between the fish from Fairlie and Arran and those from the Isle of Man. For whereas only 7. % of. the Fairlie and Arran fish had less than 56 vertebrae, the pro-. portion for the Isle of Man fish was over 4° %. For present purposes, however, this question is of no great moment: the main interest in the comparison is to discover the extent to which vertebral counts other than the total (T) also vary from sample to sample. Dr Nichol's determinations of the counts A, B, C, D, F and G (as described on p. 156of this paper) are summarized in Table IV on pp. 164-5, from which the mean values have been extracted (Table V). TABLEV Serial no. of sample 1. Count Diff. A B (B-A) C (C-B) D (D-C) F (F-D) G Normal T. }. backbones only. ,---'--.,. A, mean 23'3°5 24'050 26'23° 29'800 5°'250 5'908 56'132. 2 Diff, 0'745 2'I80 3'570 20'45°. ,---'--.,. A. mean 23'286 24'136 26'04I 29'718 5°'291 5'855 56'116. 1;)iff. 0'85° I'90S 3'677 20'573. 3 ~ A. mean Diff, 23'173 23'728 0'555 26'429 2'70I 29'7°5 3'276 50'048 20'343 5'568 55'680. ~4 A,mean-r>iff: 23'029 23'644 0,615 26'37I 2'727 29'562 3'191 49'986 20'424 5,638 55'586. It will be seen that there is a pairing off of the samples, 2 agreeing with 1 and 4 with 3. The mean values for counts A, B, D, F and G, as well as that for the total count (T), are all higher in 1 and 2 than in 3 and 4. The same is true of the differences in the means, viz. (B-A), (D-C) and (F-D). Admittedly, the superiority of the sub-counts in 1 and 2 over those of 3 and 4 is not as great as the difference of 0'5 vertebra between the values of the total count (T), but it is nevertheless distinct and consistent. It is interesting, too, that the mean number of" tail" vertebrae (count G) plainly confirms the difference between the pairs of samples. But perhaps the most interesting and significant fact to be learned from the above data is that the mean values of count (C) and the difference (C-B) are not higher but lower-substantially lower-in 1 and 2 than in 3 and 4. Were it not for these exceptions, the data as a whole might well have been explained by the simple hypothesis that the Fairlie and Arran samples (1 and 2) comprised a larger proportion of fish with a total of 56 or 57 vertebrae than the Isle of Man samples (3 and 4). For it would be expected that backbones with a higher total number of vertebrae would, on average, show a higher number of vertebrae in each of its component parts. As matters stand, however, it is necessary to suspect that there is a difference between the fish of the Isle of.
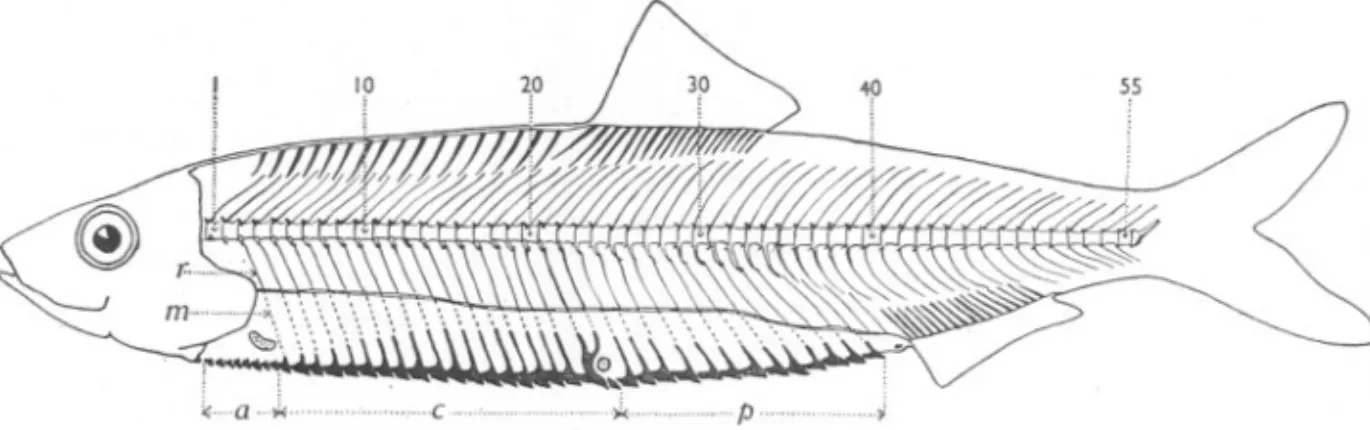
(17) VERTEBRAL. VARIATION. IN TELEOSTEAN. FISHES. 167. Man and those of Fairlie and Arran, even among those having the same total number of vertebrae. Accordingly, a comparison has been made to test this,. using backbones with a total of 56 vertebrae. The results with regard to the critical count (C) are as given in Table VI.. Serial no.. TABLE VI No. of vertebrae A. of sample I (Fairlie). Count Cl Cr Sum. 2 (Arran). Cl Cr Sum Cl Cr Sum Cl Cr Sum. 3 (Isle of Man) 4 (Isle of Man). 24 2 I 3. -. -. 25 16 14 30. 26 34 32 66. 27 9 13 22. 10. 32. 14. 9 19 7 5 12. 35 67 29 31 60 18 19 37. 3 4 7. II. 25 36. 4° 76 '16 16 32. Total no. of 28 backbones 61 I 61 I 56 I 56 I 80 8 80 4 12 4 2 6. A.mean. C=25'902. C=26'07I. C=26'550. 41 41 C=26'451. It is seen that the mean value of (C) for the Isle of Man samplesis definitely higher than that for the Fairlie and Arran samples. There is no need here to give the results of similar comparisons between backbones having a total of 55 or 57 vertebrae, although of course this would be necessary in an actual regional survey. MERISTIC AGREEMENT BETWEEN THE BACKBONE AND OTHER BODILY ORGANS. All the details and data discussed in the foregoing sections are in respect of individual variation in the form of the backbone itself, apart altogether from variation in other bodily characters. But in the herring, as in any other animal with a segmented body, the relation between successive segments of the backbone and the corresponding segments of other organs is a problem of great interest. For if the bones, muscles, and scales (among other structures) along the full length of the body, or some part of it, are in meristic conformity, then a count of the one is, in effect, a count of the other. And not this alone, for the count itself is a statistic of the basic plan upon which the whole body is organized. Such a statistic might prove of especial service and convenience in the kind of population studies with which this paper is concerned. Relevant data are given in Fig. 3, which shows the extent of agreement between the backbone, myocommata, fin-radials and keeled scales in a herring which has been dissected and stained in alizarin. It is seen that the backbone consists of 55 vertebrae between the skull and the terminal urostylar segment. Meristic agreement is to be observed in the anterior part of the body. Dorsal to the backbone, the neural spines of the 1st to the 17th vertebrae regularly.
(18) E. FORD. 168. alternate with a series of bony rods, described by Hillier* (1932, p. 98) as the root-bones of a fin now submerged. Immediately posterior to the last of these root-bones, where the first of the radials of the dorsal fin makes its appearance, the conformity with the neural spines ceases, so that the whole base of the dorsal fin lies within the span of the neural spines of the 17th to 30th vertebrae. Ventrally to the backbone, the ribs (the first of which is attached to the 3rd vertebra), myocommata, and keeled scales are in step, backward to the anus. Behind the anus, the haemal processesof the vertebrae from the 38th to the 46th or 47th, are out of step with the radials of the anal fin. 55. T. m-~~\~\~'i'~~~~»\.~"\ \\.\.\:... ~. a..,"',,,. c..,. )i<.... ""'.~.~. p. ;. Fig. 3. Left side of a herring to show the extent of meristic agreement between the backbone, fin-radials, myocommata and keeled scales (see text). T, rib. m, myocomma. a, c and p, anterior, central and posterior groups of keeled scales.. Counts of the Keeled Scales Along the ventral edge of the body of the herring from the throat backwards to the anus there is a median row of scales. These" keeled scales" have been used in the past as the basis of statistical counts in biometric studies. Usually a distinction has been drawn between the Kl scales which lie in front of the pelvic fins, and the K2 scales behind the pelvics. The K2 count is the one most generally adopted for statistical work, and the first scale to be included in the count is situated between the insertions of the pelvics (see. Johansen, 1919, Fig. 9). . Now without in the least degree criticizing the use of Kl and K2 counts as statistics of variation within the section of the body in which they are situated, it is of no little interest to consider the number and disposition of the keeled scales in relation to the myocommata, ribs and vertebrae with which they are observed to be in association. In Fig. 3 the keeled scales are marked off into three groups-an anterior group (a) of 8, a central group (c) of 20, and a posterior one (P) of 13, making a total of 41 scales in all between the throat and the anus. For purposes of description it is convenient to deal first with the scales of the central group, which begins at the 9th scale. This 9th scale is * Hillier's treatise, entitled A Theory, of the Formation of Animals, contains a very useful and detailed description of tIle anatomy of tIle herring, based on personal observations. This footnote will serve to draw attention to a work which may have escaped tIle notice of many fishery investigators..
(19) VERTEBRAL. VARIATION. IN TELEOSTEAN. FISHES. 169. seen to be in register with a myocomma, and with the first of the ribs, which is attached to the 3rd vertebra. Proceeding backwards along the series, the loth, IIth, ..., to the 26th scale are similarly associated with their respective myocommata and the successive ribs of the 4th, 5th, ... to the 20th vertebra. The 27th scale is a compound one having lateral processes which loop round the base of the pelvic fin and, at their distal end break into two and make register with two myocommata and the underlying ribs of the 21st and 22nd vertebrae. There remains the 28th scale from the throat, which appears to be attached anteriorly to the posterior end of the preceding scale. Summarizing, the 20 keeled scales from the 9th to the 28th, both inclusive, form a central group which is in meristic agreement with 20 myocommata and the ribs of 20 vertebrae from the 3rd to the 22nd. It may also be added here that the vertebrae referred to have autogenous parapophyses, the 22nd vertebra being the hindermost one to show this character. The posterior group of 13 scales commences with the 29th scale from the throat and ends with the 41st just anterior to the anus. Each of these is in register with a myocomma and a vertebra, the first being in register with the 23rd vertebra (the first to bave its haemal arches continuous with the centrum and the ribs attached by ligament-the "false" ribs of Hillier, 1932, p. 94) and the last in register with the 35th vertebra. With the central and posterior groups thus orientated, it is only necessary to state that the anterior group consists of 8 scales of comparatively small size which are without conspicuous lateral processes and are situated in front of the first rib. The foregoing data relate to a selected specimen from a sample of young herrings of the " 0" age-group caught at Plymouth. After removing the scales from the sides of the body in the neighbourhood of the pectoral fins, pelvic fins, and keeled scales, each fish was split longitudinally to expose the backbone and then stained in alizarin. Thus prepared, the keeled scales, myocommata, ribs and vertebrae could be easily counted in situ under a dissecting microscope. Only 25 fish in all were examined, but these were sufficient to show that appreciable variation from fish to fish had to be taken into account. The total number of keeled scales varied from 41 to 45, while for the three . groups into which the total may be divided the range of variation was from 7 to II in the anterior group, 19 to 21 in the central group, and 13 to 16 in the posterior group, with frequencies as shown in Table VII. But it was also found that in 15 of the total of25 fish the number of keeled scales in one or other of the central and posterior groups was greater by I than the number of myocommata (and ribs) with which the scales were in register. In each instance the breakdown 6fthe normal association of I keeled scale with I myocomma (and rib) occurred in the region adjacent to the insertion of the pelvics. In 2 of the 15 specimens the last two scales of the central group were in association with a single myocomma, while in the remaining 13 the first two scales of the posterior group were covered by one.
(20) E. FORD. 17°. myocommaonly (see Fig. 4). The significanceof these observations in connexion with the Kz count will not have escaped notice, for it implies that the Kz count is not a constant function of the number of myocommata and TABLE VII No. of keeled scales 41 6 7 I. 42 4 8 8. 43 5 9 8. 44 6 10 7. Central group. 19 I. 20 17. 21 7. Posterior group. 13 10. 14 13. 15 I. No. of specimens: Total count Anterior group. 45 4 II I. A, mean 42'92 8'96 20'24. 16 I. 13'72. vertebrae with which the keeled scales counted are in association. Whether or not this fact affects the results of any particular biometric investigation is immaterial in the present consideration, but it is nevertheless one which should be borne in mind.. m. m V. \, \. )Y,,'. :... \. ,. 20 ,. ,". //. \.,. 21 ,./'. m. 20 21. 19 20 21 .' ,. ' " , /. \. \(. '<\ /" ~/" 19 20 c. : ~ i 2 P. Fig, 4. Keeled scales in the neighbourhood of the pelvic fins. A, the last two scales of the central group (c, 19 and 20) and the first scale of the posterior group (p, I) are in register with the 19th, 20th and 21st myocommata; B, a common variation in which the last two scales of the central group (c, 19 and 20) and the first two of the posterior group (p, I and 2) are associated with the 19th, 20th and 21st myocommata; C, a less common variation in which the last two scales of the central group (c, 20 and 21) are in register with a single myocomma (20th) instead of two as normally. DISCUSSION. As a concluding section of this paper, the results given in preceding pages will be. considered in their bearing upon the Resolutions adopted by the Lowestoft meeting. An agreed scheme for the detailed study of backbone variation in as many biological groups as possible is clearly desirable. I cannot recommend that the work should be restricted to a selected few of the vertebral counts described above; because 1 firmly believe that our past persistence in doing so has prevented us from making progress at the rate commensurate. ~'--~--.
(21) VERTEBRAL. VARIATION. IN TELEOSTEAN. FISHES. 171. with the amount of solid and tedious labour expended. Long before this we should have undertaken the detailed investigation of the herring backbone in all its parts and of variation from group to group which is only now being contemplated, and without which we cannot make much headway in the future. It is not suggested that past work has been entirely unprofitable, for much useful information has been acquired concerning the variation of the total COl,IDt (T) in particular, but much of it has proceeded in the absence of an adequate knowledge of the nature aild extent of vertebral variation, with a consequent waste of effort and the accumulation of a mass of bewildering data. This, at any rate, is a personal conviction, based on personal experience. In planning the scheme, considerations of economy in labour and material must be treated as secondary to the requirements for detecting differences between the biological groups. All the alternative counts along the backbone, as well as combinations of counts and differencesbetween counts, should be examined as potential indicators of the differences between groups. The working samples should be fully representative of the biological groups from which they are drawn and large enough to enable comparisons to be made between backbones having the same total number of vertebrae. Recognized statistical methods should be followed in making the comparisons. Provided these main points are observed, the details of the scheme can with advantage be left to the discretion of the workers who are to carry it through. If all the biologicalgroups are to be studied, as eventuallythey must, numbers of workers in the different countries interested in the herring fisheries will need to co-operate, but I do not think the amount of work which each must perform should prove excessive. One worker with the aid of a laboratory attendant can prepare 25° backbones by boiling and cleaning in a single day, and the determination of the vertebral counts can be carried out at his convenience on the dried preparations, which will keep in good condition without preservation for many months if necessary. It will be found most helpful for the subsequent analysis of the data to enter all the counts for each fish on a separate card bearing the particulars of the sample and the serial number of the fish. Frequency tables according to any desired criteria can then be quickly compiled by the simple process of dealing out the cards into the correct piles and counting the number in each pile. This can be done without clerical assistance and enables the investigator to try out many alternative comparisons with the minimum of trouble and sub-tabulation. I think the question of the best use to be made of the count "ofkeeled scales is one of some importance, which should be included in any proposed scheme. The data given in this paper are, of course, inadequate for final decision; but they raise points of great interest, particularly with regard to the basic metamery of the herring and the relation between keeled scale and vertebral counts. Finally, I strongly recommend that a determined effort should be made to discover the morphological characters which have been referred to in this.
(22) 172. E. FORD. .paper as the "hallmarks" of the biological groups-those characters which will reveal sub-specific identity by inspection of individual fish, irrespective of circumstances of time and place of capture. Given a representative sample from each of the biological groups, I am of the opinion that careful comparisons, vertebra by vertebra, would bring to light differencesof the greatest interest and practical usefulness. REFERENCES CONSEILINTERNATIONAL EXPLOR.MER, 1936. Meeting of herring experts. Rapports et Proces-Verbaux, Vol. c, 2eme Partie, pp. 7-10. FORD,E., 1933. The "number of vertebrae" in the herring and its variation. Journ. Cons. Int. Explor. Mer, Vol. VIII, pp. 211-22. 1937. Vertebral variation in teleostean fishes. Journ. Mar. Biol. Assoc., Vol. XXII,pp. 1-60. FORD,E. & BULL,H. 0., 1926. Abnormal vertebrae in the herring. Journ. Mar. Biol. Assoc., Vol. XIV,pp. 5°9-17. HILLIER,W. T., 1932. A Theory of the Formation of Animals. John Wright and Sons, Ltd., and Simpkin Marshall, Ltd., London. JOHANSEN,A. C., 1919. On the large spring-spawning sea-herring (Clupea harengus L.) in the north-west European waters. Medd. fra Komm. Havunders. Ser. Fiskeri, Bind V, No.8. ORTON,J. H., 1916. An account of the researches on races of herrings carried out by the Marine Biological Association at Plymouth, 1914-15. Journ. Mar. Biol. Assoc., Vol. XI, pp. 71-121..
(23)
Figure


+4


Related documents
To continuous run a brushless dc motor in case of 30 degree mode of operation at first one N pole is developed at A1 ( Fig 4 a).From the figure it is clear that to make a N pole
According to average pain level values in 2 hours after septoplasty men were distributed as folows: 39.1% had no or mild pain, 39.1% had moderate pain, 21,7% had strong pain,
The factors noted to be associated with health risk behaviors include: age, gender, marital status, parental socioeconomic status and parental practice of same
Iron, vitamins, high temperature influence positive milk catalase activity; tannin, trichloroacetic acid and pasteurization temperature influence negative milk catalase
The introduction of seasonal variables into scoring models that take debtor behaviour into account requires a new approach to the creation of the sample for the implementation of
Thirty two species are new record for Eastern Mediterranean region, 2 species are new records for Turkey ( Hydroporus scalesianus and Hydrovatus acuminatus ),
To have an accurate and reliable model, butt weld geometries (i.e., Penetration depth, Welding zone width and Heat affected zone width) are separately estimated by using a
Time complexity of this algorithm is of the order of O (n log n). The final stage of image registration is geometrically aligning the input image with the database image. For
