Cost Reflective Pricing
Engaging with Network Tariff Reform in Victoria
A CUAC RESEARCH REPORT
June 2015
2
The Consumer Utilities Advocacy Centre Ltd. (CUAC) is a specialist consumer organisation established in 2002 to represent Victorian energy and water consumers in policy and regulatory processes.
An appropriate citation for this report is:
CUAC (2015) Cost reflective pricing: Engaging with network tariff reform in Victoria, Consumer Utilities Advocacy Centre Ltd., Melbourne
Author:
Martin Jones, Dipl. Econ., B. Com.
Consumer Utilities Advocacy Centre Ltd. (CUAC) Level 2, 172 Flinders Street Melbourne VIC 3000 P (03) 9639 7600 F (03) 9639 8966
www.cuac.org.au
i
Cost Reflective Pricing Engaging with
Network Tariff Reform in Victoria
Contents
Abbreviations ... ii
List of figures ... iii
List of tables ... iii
Executive Summary ... 1
1. Introduction and context ... 3
Context ... 4
2. Distribution Network Pricing Arrangements Rule Change... 6
Network pricing process ... 6
Network pricing principles ... 6
3. Theoretical background ... 8
Cost reflectivity ... 8
Variable and marginal costs ... 8
Fixed and residual costs ... 10
Equity and fairness ... 11
4. Tariff components ... 12
Two Part Tariff ... 13
Inclining Block/Declining Block Tariff ... 13
Seasonal Pricing ... 14
Time of Use Pricing ... 14
Capacity Tariff ... 15
Maximum Demand Tariff ... 16
Critical Peak Pricing / Critical Peak Rebate ... 16
Controlled Load Tariff ... 17
Locational pricing ... 17 5. Tariff proposals ... 18 United Energy ... 18 Jemena ... 19 Other DNSPs ... 19 6. Customer impacts ... 20
Vulnerable groups – Deloitte ... 20
Small customers – Ellipson ... 22
Residential customers – CSIRO ... 23
DNSP modelling ... 24
7. Tariff implementation and transition ... 26
8. Conclusion ... 28
ii
Abbreviations
AEMC Australian Energy Market Commission
AER Australian Energy Regulator
COAG Council of Australian Governments
CPP Critical Peak Price
CPR Critical Peak Rebate
CSIRO Commonwealth Scientific and Industrial Research Organisation
CUAC Consumer Utilities Advocacy Centre
DNSP Distributor Network Service Provider; an electricity distribution company
kVA Kilo Volt-Ampere
kW Kilowatt
kWh Kilowatt hour
LRMC Long run marginal cost
MW Megawatt
MWh Megawatt hour
SCER Standing Council on Energy and Resources
SRMC Short run marginal cost
ToU Time of Use tariff
iii
List of figures
Figure 1: Deloitte evaluation of network tariffs ... 12
Figure 2: Sample time of use periods ... 15
Figure 3: United Energy 2015 Seasonal Demand Time of Use Residential Tariff (ex-GST) ... 18
Figure 4: Average annual residential bill change (per cent) by ToU scenario ... 21
Figure 5: Distribution of customer cost effects ... 22
List of tables
Table 1: Sample two part tariff for electricity ... 13Table 2: Sample inclining block tariff for quarterly electricity ... 13
Table 3: Sample declining block tariff for quarterly electricity ... 13
Table 4: Sample seasonal price for electricity ... 14
Table 5: Sample time of use tariff for electricity ... 14
Table 6: Sample capacity tariff for electricity ... 15
Table 7: Sample monthly maximum demand tariff for electricity ... 16
Table 8: Sample Critical Peak consumption tariff for electricity ... 17
Table 9: Proportion of customers by consumption and demand segment (example) ... 24
1
Executive summary
Cost Reflective Pricing: Engaging with Network Tariff Reform in Victoria has been written to help consumers, consumer advocates, and community groups engage with electricity distribution businesses and policy makers in their development and implementation of cost reflective tariffs. Cost reflective tariffs are being developed and implemented by Distribution Network Service Providers (DNSPs) across Australia in response to a decision by the Australian Energy Market Commission. By more closely aligning the charges for electricity consumption with the costs of electricity consumption, the fairness and efficiency of the electricity distribution system can be improved.
The largest factor driving investment in electricity networks is peak demand: the highest level of usage. These levels are only reached for short periods each year. However, network costs are recovered from most consumers – particularly residential consumers – via charges on their consumption over the course of the year, rather than on their peak demand.
Current electricity prices therefore don’t reflect the real costs of using electricity during demand peaks. Nor are the costs distributed fairly: households with high demand and low consumption receive implicit subsidies from households with low demand and high consumption.
Cost reflective tariffs would allocate network costs to those who incur them, reducing the cross-subsidies between users. Where consumers are confronted with the costs of their electricity usage and decide to change their behaviour, network investment can be avoided and costs reduced. Over time, this should lead to lower network costs for all consumers than continuing with current tariffs.
Good tariffs should be efficient, equitable, provide stable bills for consumers and revenue for businesses, and be acceptable to customers. There are several types of cost reflective tariffs, and each fulfils these criteria to a greater or lesser extent. This report explains a range of cost reflective tariffs and currently public tariff proposals from Victorian distribution businesses.
While the theoretical merits of a particular tariff are important, consumers, consumer advocates, and community groups are likely to judge any new tariffs based on changes to the current situation. There is likely to be particular focus on the short term ‘winners’ and ‘losers’ of network tariff reform, though it is important to note that electricity networks will not increase their revenue through this reform: they will only redistribute their charges.
This report reviews relevant research on the customer impacts of different tariffs, and finds no clear pattern of ‘losers’ in any demographic group. Instead, the relationship between a household’s consumption and its demand is one of the biggest factors determining whether a household will be a ‘winner’ or ‘loser’ from cost reflective tariffs.
Gaining consumer acceptance and understanding of a tariff is at least as important as the choice of tariff itself. The most useful end point of network tariff reform is likely to be tariffs that trade cost reflectivity for understandability, consistency across DNSPs, and public acceptance.
2
CUAC suggests using the roll-out of digital television as a template for the introduction of cost reflective tariffs: 18+ months of communication followed by a mandatory switch-over.
Mandating uptake of cost reflective tariffs is crucial to the success of network tariff reform. If, at the conclusion of the reform, consumers are not required to have a cost reflective tariff, they will naturally seek to avoid it where it is not in their interests. Consumers whose behaviour would be more expensive under cost reflective tariffs will avoid them, and the costs they incur will continue to be borne by the broader system. This would be an inequitable outcome that damages the justification for the reform.
Understanding the psychology of consumers and the effects cost reflective tariffs will have on different consumer groups is vital to getting the best from network tariff reform. The subject is complicated, but DNSPs have a duty to consult with consumers; consumer advocates and community groups are well placed to reflect the interests and concerns of their constituents. We encourage all interested parties to use the knowledge from this report to engage with their relevant DNSP(s) and the Victorian Government to ensure network tariffs reforms are in the long term interest of consumers.
3
1.
Introduction and context
Electricity networks cost a lot to build, but comparatively little to use. A large proportion of networks is built to meet the demand peaks that occur only a few times per year. For decades, most electricity users – particularly households and small businesses – have paid for the distribution of electricity based on their consumption over the whole year, rather than their contribution to demand peaks.
However, due to changing patterns of electricity consumption and demand, this traditional model of charging is no longer adequate. Recognising this, the Council of Australian Governments (COAG) asked the Australian Energy Market Commission (AEMC), the statutory rule maker for energy markets, to reform the way electricity distribution networks charge for transporting electricity.
The AEMC’s ruling (explored in Section 2, Distribution Network Pricing Arrangements Rule
Change) requires distribution network service providers (DNSPs) to introduce tariffs that more strongly reflect their underlying costs. These are known as cost reflective tariffs.
Cost reflective tariffs are a large change for most consumers. Their successful development and implementation will require a deep understanding of how consumers think about electricity, how they use electricity, and whether/how they will engage with different types of tariffs and communication.
DNSPs across Victoria are currently developing cost reflective tariffs in their proposals for the next regulated control period, 2016–2020.1 The proposals – known as Tariff Structure Statements
(TSS) – are due in September, 2015. (Other states have similar processes with different time frames.)
The AEMC requires DNSPs to consult stakeholders during their tariff development. This provides great opportunity for consumers, consumer advocates, and community groups to influence the outcome of these reforms.
This report has been written to help consumers, consumer advocates, and community groups engage with DNSPs and policy makers in their development and implementation of cost reflective tariffs.
Section 2 of this report, Distribution Network Pricing Arrangements Rule Change, summarises the
AEMC’s determination on cost reflective pricing. Section 3, Theoretical background, explains the
economic theory underpinning network tariff structures, while Section 4, Tariff components, explores different tariff components that might be combined to form cost reflective tariffs. Draft proposals for cost reflective tariffs are presented in Section 5, Tariff proposals. Section 6,
Customer impacts, summarises research into the effects of different tariffs on different consumers, while Section 7, Tariff implementation and transition, addresses how the reform should be implemented. Section 8 concludes.
1 As monopolies, networks must submit their plans to the Australian Energy Regulator every five years for
4
The remainder of this section provides some context to electricity networks for readers unfamiliar with the sector.
Context
As stated above, electricity networks cost a lot to build but little to use. Erecting power poles and stringing wires is expensive, and a network needs a control centre and field crews to operate and maintain it in safe working condition. Actually sending electrons (electricity) along the wires doesn’t produce much wear or tear, and so is comparatively cheap; once a network has been built, whether it’s used to 10 per cent capacity or 90 per cent capacity does not greatly change its costs. Network costs increase significantly when the desired usage approaches the network’s capacity. Electricity infrastructure has physical limits, often thermal limits: putting too much power through equipment can cause it to overheat. Once the load (demand) on a network approaches its capacity, the network must be augmented or load curtailed, otherwise the network can fail. The industry term “load shedding” is used to describe forced reductions in supply – blackouts – to maintain system security.2
Electricity networks, like metropolitan freeways, aren’t used to full capacity all the time: there are ‘peak’ periods and ‘off peak’ periods. And, like freeways, capacity isn’t the same across the network: a small part of the network can be highly congested while the rest is flowing freely. However, unlike traffic, electrons can’t ‘slow down’ when there is congestion. If demand can’t be safely accommodated, it must be shed.
Electricity demand reaches its maximum levels usually only for a few days each year, and rarely for more than a few hours. A substantial portion of electricity networks is built to accommodate these maximum peaks, but sits idle the rest of the year: 5 per cent of the network is used, on average, less than 24 hours per year. 10 per cent is used less than 120 hours (five days) per year; approximately one per cent of the time.3 This mostly-idle infrastructure cost $11 billion.4
Even though most network costs come from building the infrastructure, rather than using it, that’s not how most consumers are charged for it. Many of the costs that don’t relate to usage are ‘smeared’ across charges for usage. In part this is due to consumers’ preference for usage charges over fixed charges, and partially due to networks not having a great deal of information about individual households’ consumption before the widespread installation of smart meters. Most consumers don’t realise that when they use electricity, they’re not buying just ‘the electricity’: they’re also renting the network capacity to deliver it. And while electricity is generated only when people want it, the network is available all the time, and hence must be paid for all the time; the charges are constant, or fixed.
2 (AEMO, 2014)
3 Average between 1999/2000 and 2013/2014. CUAC analysis of total demand data from the
Australian Energy Market Operator, provided by EnerNOC.
5
When consumers believe they’re paying for usage, rather than availability, fixed charges seem
unfair: they are unavoidable and don’t seem to relate to consumer behaviour. To compensate, households have traditionally been presented with artificial prices on their bills:5 while households
pay both a fixed daily charge and a charge based on their kWh of consumption, around half of
the “per kWh” price is actually network charges6 – even though these have little to do with the
kWh consumed.
This price structure worked well while electricity usage patterns were stable, and there was a strong relationship between consumers’ aggregate usage of electricity (consumption) and their highest usage at a given instant (peak demand). Recently, these underpinnings have started to
dissolve:7 consumption and demand no longer move together, driven in part by the proliferation
of new technologies.
Air conditioners place great demand on the network, but tend to be run only during hot weather, so over a year their load factor – the relationship between consumption and peak demand – is lower (worse) than that of a television or washing machine. Solar panels reduce a household’s total consumption, but do less to reduce its peak demand. While not exclusively responsible, air conditioners and solar panels have resulted in a growing gap between consumption and demand. As current electricity tariffs are based on consumption, not demand, people who consume less pay for less of the network. However, as explained above, modern low-consuming households don’t necessarily need less network capacity. A consumption tariff means such households enjoy the benefit of network capacity during peak periods (e.g. to run air conditioners during heatwaves) without paying for it during the rest of the year. Conversely, households with high consumption and low peak demand pay disproportionately highly.
Not only is this unfair, it also doesn’t accurately convey to consumers how expensive high usage during peaks really is. Consumers thus act in a way that leads to higher network capacity investment, and higher network bills, than they might choose if they knew the costs they were incurring.
Cost reflective network tariffs are a step toward showing consumers the true cost of their actions. (The manner in which consumers see these costs will depend on factors such as how energy retailers choose to represent the new tariffs in their bills.)
Cost reflective tariffs will, ideally, allow those consumers who use and value network capacity to pay for it, and those who don’t to save money.
5 Artificial in the sense that the prices do not reflect the underlying costs. 6 (Gill, 2015)
6
2.
Distribution Network Pricing Arrangements Rule Change
This section summarises the regulatory process that began the reform of network tariffs.
The AEMC’s 2012 review of energy markets, Power of Choice, identified opportunities for consumers to make more informed choices about the way they use electricity. One of the review’s recommendations was to introduce cost reflective electricity distribution network pricing structures for residential and small business consumers, leading to more efficient and flexible retail prices
and saving consumers money in the long term.8
(Large business customers already face cost reflective prices. See Section 3, Theoretical background, for an explanation of why cost reflective prices are efficient.)
The AEMC further recommended that cost reflective pricing be accompanied by improvements to DNSP consultation requirements, and by governments reviewing their concessions schemes and energy efficiency programs.9
The Council of Australian Governments’ (COAG) Energy Council10 responded to the
recommendations by asking the AEMC to address the incentives and level of guidance for DNSPs to set cost reflective network prices, as well as to address the DNSPs’ consultation processes with consumers.1112
The AEMC’s final determination on distribution network pricing arrangements was released in November 2014, containing a new network pricing process and new network pricing principles.
Network pricing process
The new network pricing process is intended to provide more meaningful engagement between consumers and DNSPs, allowing DNSPs to design network price structures that consumers can understand and respond to. Where consumers can relate their usage decisions to network prices, they will be able to make better decisions about their energy usage.13
To this end, DNSPs must describe in their proposals to the regulator how they have consulted with consumers and retailers on the design of their network tariffs.
Network pricing principles
Cost reflective
When designing their tariffs, the new network pricing principles require DNSPs to send price signals to consumers about the costs of using the network; that is, the network costs caused by using more electricity, or the costs that could be saved by using less electricity, at any given time.
8 (AEMC, 2012, pp. 147-148) 9 Ibid.
10 Formerly the Standing Council on Energy and Resources (SCER 11 (AEMC, 2014)
12 The AEMC is unable to initiate rule changes in response to its own recommendations. 13 (AEMC, 2014, p. 8)
7 As the immediate costs of using an existing network are minimal (when not approaching its limit), the usage costs should be based on the long run marginal costs of electricity usage. Long run marginal costs are explained further in Section 3, Theoretical background.
Non-distortionary
For the remainder of their costs – which are not dependent on usage levels – DNSPs are now required to recover them in a manner that minimally distorts the price signals being sent regarding usage.
Effectively, once a consumer has seen the costs of their electricity usage and made consumption choices based on those costs, any further (non-usage) costs that that consumer pays should not lead to them changing their consumption choices.
All costs the DNSP recovers must reflect efficient business operation. This assessment is made by the Australian Energy Regulator (AER).
Consumer impact
The pricing principles require DNSPs to apply a new consumer impact principle, having regard to:
Consistency: price signals should be consistent and apply for a reasonable period of time,
avoiding price shocks or significant price volatility.
Understandability: consumers must be able to make the link between their behaviour – when and how they use electricity – and the prices they pay so that they can make well informed choices.
DNSPs are allowed to depart from strictly cost reflective prices to the extent necessary to meet the
consumer impact principle, but must transparently explain how they have done so.14
It is in this balancing act that consumer and community input/advocacy is most valuable, as DNSPs have much greater experience with economic cost calculations than they do with consumer behaviour and understanding of tariffs.
Jurisdictional obligations
Finally, if DNSPs are subject to jurisdictional obligations that conflict with the network pricing principles, the principles require the DNSPs to depart from the network pricing principles to the minimum extent necessary to meet their jurisdictional obligations, i.e. any applicable state or territory laws and regulations.15
For instance, it might be cost reflective for a DNSP to charge on all customers based on their demand. Simultaneously, a state government might impose a ban on demand charges for customers who consume less than 2,000 kWh per year. The AEMC principles would allow the DNSP to construct a different, non-demand based tariff for low consuming customers in that state.
14 (AEMC, 2014, p. 23) 15 (AEMC, 2014, p. 24)
8
3.
Theoretical background
This section explains, at a high level, some of the economic theory underpinning network tariff structures. It considers cost reflectivity, variable costs (including short run and long run costs), fixed costs, and concepts of equity.
Cost reflectivity
Cost reflective pricing is when the price of a good or service reflects its cost of production.16 It has
several benefits, including:
Where a consumer values a good/service more than its cost of production, the consumer
will purchase the good/service. This is a net benefit to society, because the (production) resources used are less than the (consumer) benefits gained.
Where a consumer does not value a good/service more than its cost of production, the
consumer will not purchase the good/service. This avoids a net loss to society.
By sending signals about production costs, cost reflective prices allow consumers’ and producers’ resources to each be allocated to activities that have the greatest net benefit to society. This maximisation of welfare makes the prices efficient.
In regards to network tariffs, the AEMC suggests that cost reflectivity has three key components.17
As well as sending signals about what network costs a particular consumer’s electricity consumption would incur, and having each consumer pay for that cost, the AEMC sees cost reflective pricing as a means for DNSPs to recover (a portion of) their regulated revenues.
DNSPs’ revenues are set by regulation at a level that allows them to recover their costs, which are a mixture of fixed costs and variable costs. These are explained below.
Variable and marginal costs
Variable costs are costs that change depending on consumer behaviour.
Many goods and services are priced according to their average cost: the total cost of production divided by the number of goods produced. For example, a baker selling 200 loaves of bread might sell all of them for her total cost of baking divided by 200.
The marginal cost, however, is the cost of the very last good produced. It is the difference between the total cost of producing 200 loaves of bread and the total cost of producing 201 (or 199). The concept of marginal cost recognises that, as one moves the limits of production – the “production margin” – the costs change. Some things get cheaper when you produce more of them, some get more expensive.
Pricing goods and services at their marginal cost allows consumers to make efficient consumption decisions, as explained above under Cost reflectivity.
For many consumption decisions, in particular those involving infrastructure, there are different marginal costs in the short run and the long run.
16 In economic theory, the “cost” of production includes a reasonable amount of profit. 17 (AEMC, 2014, p. 19)
9 The economic distinction between the short run and long run is that in the short run at least one factor of production – the stock of equipment, level and quality of staff, et cetera – is fixed, and in the long run all factors are flexible. For example, in the short run the amount or type of electricity network infrastructure cannot be changed, but in the long run it can be.
When using electricity networks, the short run marginal cost (SRMC) of usage is usually quite low. This changes where usage approaches the network’s capacity. At this point, the SRMC becomes quite high: because capacity cannot be expanded, “the SRMC increases to the price level necessary to curtail demand sufficiently so that demand is exactly equal to the available capacity. This means that the SRMC includes the cost to consumers of being unable to use electricity when network capacity is insufficient to meet demand, i.e. a congestion cost.” (NERA, 2014, p. 6) In the current context of electricity demand in the National Energy Market (NEM), SRMC will be near zero for most of the year and high – potentially tens of thousands of dollars per megawatt
hour (MWh)18 – during only a few hours when demand is highest.
In the long run, network capacity can vary (by definition). The long run marginal cost (LRMC) of an electricity network therefore includes the cost (or savings) of expanding (shrinking) the network to match demand, rather than holding the network capacity fixed and using prices to match demand to the capacity as SRMC does.
The profit seeking nature of business means that, over time, the SRMC should average out to the same as the LRMC. If constraining demand in the short term is the cheapest option, businesses will do that until the average SRMC rises higher than the cost of long term investment. At that point, business will switch to investment until the LRMC rises above the SRMC. Then, they’ll switch back. Thus, a gap between LRMC and average SRMC would be inefficient, and should be naturally closed by profit-seeking businesses.
Either short run or long run marginal costs can be used to signal to consumers what costs their behaviours will incur on the system. Consumers’ responses to these prices will provide network businesses with signals of what level of future capacity to invest in.
However, while SRMC should lead to the same result as LRMC, in practice, the complex and fluctuating nature of SRMC makes the signals more difficult to respond to, particularly for consumers. Consumers are unlikely to understand or react well to wildly fluctuating prices, and may face payment difficulties.
As the AEMC notes, “in the short term consumers may be able to switch-off or turn-down some equipment and processes and SRMC will provide stronger signals for this. But larger, longer term responses typically require the user to invest in new equipment. More stable longer term price signals provide a better basis for these decisions.” (AEMC, 2014, p. 125)
The fear of high bills during periods of high SRMC could also prompt some households to inappropriately self-limit their consumption in a way that leads to negative welfare effects. For example, older consumers may limit their usage of air conditioning during heat waves and suffer
10
or exacerbate health problems as a result. For these reasons, CUAC prefers LRMC as a signal of future production costs.19
The form in which variable (marginal) costs are presented in prices differs, and some examples are presented in Section 4, Tariff components, below.
Fixed and residual costs
Fixed costs are costs that don’t change depending on consumer behaviour. Residual costs are the energy market term for the portion of a network’s costs that remain once the revenue from usage charges has been booked. Under cost reflective pricing, where usage charges should account for all variable costs, residual costs should equate to fixed costs.
For example, the AER might allow a DNSP to recover $500 million in revenue per year. If $100 million is to cover costs that vary with electricity usage, then the remaining $400 million is for the residual costs.
A large proportion of what DNSPs are allowed to collect in revenue is recovery of costs for past asset investment. A further portion is for costs that do not vary materially with electricity usage, such as DNSPs’ need to run control centres or send maintenance crews around their networks. As these costs do not vary with usage, there are no ‘price signals’ to be sent in their recovery. While consumers can use prices based on variable costs to decide whether further consumption is worth the production costs, consumers have no influence over fixed costs.
Because changes in consumer behaviour will not change the level of fixed costs, consumers should disregard fixed costs when choosing their behaviour. This does not mean that consumers should not pay for fixed costs, but that they should pay for fixed costs in a way that does not encourage them to change (distort) their behaviour.
Two main ways of non-distortionary cost recovery are Ramsey pricing and postage stamp pricing.
Ramsey pricing
The extent to which consumer behaviour responds to changing prices is known as consumers’ “price elasticity”, with a larger response equating to higher elasticity. In order to recover fixed costs while changing consumers’ behaviour as little as possible, one approach is to raise prices for those consumers with the lowest elasticity. This is known as the “inverse elasticity” approach, or “Ramsey pricing”.20
Postage stamp pricing
As an alternative, rather than charging those consumers who are least likely to change their behaviour, the charges for fixed costs could simply not vary with behaviour: all consumers could be charged a flat, unavoidable fee. Examples of such fees are the “daily charge” or “supply
19 We note that while e.g. a critical peak pricing approach also involves fluctuating prices, the fluctuations
are much less extreme. Our objection is not to fluctuating prices in principle, but to the magnitude, frequency, and predictability thereof.
11 charge” for electricity and natural gas, monthly line rental fees for telephones, and daily hire fees
for rental cars. This fixed charge approach is sometimes known as “postage stamp pricing”.21
Equity and fairness
Equity and fairness are moral and social concepts, and as such are not strictly defined. Nor can their importance relative to other goals (e.g. efficiency) be objectively assessed. The links that consumer and community organisations have with their constituencies makes them an important channel for communicating relevant issues of equity and fairness to decision makers, recognising that there is no single ‘right’ answer.
As a starting point, it is commonly regarded as fair and equitable that the beneficiaries of a service bear the costs of that service. In the case of energy networks, the beneficiaries are the users: a fair system would be “user pays”.
The “user pays” principle is at the heart of cost reflective pricing. It also aligns with the principle of horizontal equity, which proposes that consumers in the same circumstances or engaging in the same behaviour should be treated equally, i.e. pay the same.
A further principle, vertical equity, proposes that users with greater capacity to pay should pay more. The vertical equity principle is most explicitly seen in the tax system, where tax rates rise with income, but it is also seen in energy concessions for low income households.
The embodiment of vertical equity into prices is rare, instead usually being pursued via the tax/transfer system. While the pursuit of equity via taxes and transfers (welfare) is generally a more efficient and transparent process than manipulating prices, prices should still be scrutinised to ensure they are as equitable as reasonably possible.
Related to equity and fairness is the principle of agency, or self determination. Consumers value agency highly, even if they may be unlikely to exercise it. Removal of agency to levy even an equitable or efficient charge can meet resistance.
Finally, it is important that the equity of any policy be considered at a whole-of-system level. A change in prices might, in isolation, cause detriment to particular groups, but the equity of such a change should be considered in light of any compensation that could be paid to those groups (if appropriate).
12
4.
Tariff components
This section explores different tariff components that might be combined to form cost reflective tariffs. It is by providing feedback to DNSPs in their tariff development and implementation strategies that consumer and community groups can provide great value to network tariff reform. In their tariff development, DNSPs can draw from a great range of electricity tariffs used around
the world,22 as well as a long history of academic and governmental thought on how to regulate
and price network monopolies.23 The internationally recognised key principles of tariff design
have been summarised24 as:
Economic efficiency in consumption and production;
Equity between customers and between the utility company and its customers;
Revenue stability for the utility company;
Bill stability for the customer; and
Customer satisfaction.
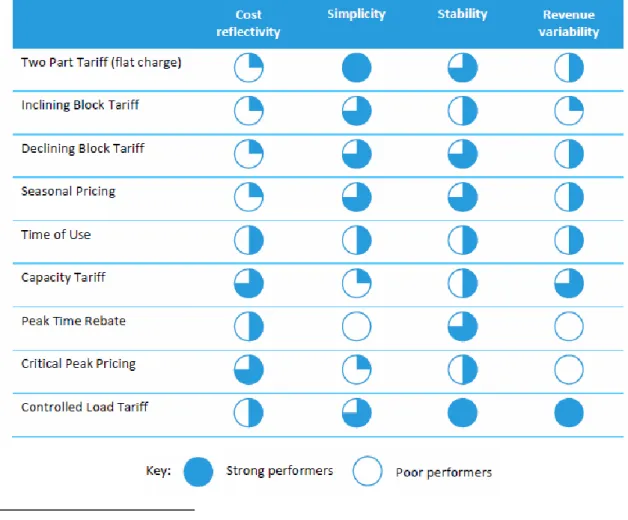
Using similar criteria, the Energy Supply Association of Australia commissioned Deloitte to review network tariffs in 2014.A summary of Deloitte’s evaluation is presented in Figure 1.
Figure 1: Deloitte evaluation of network tariffs 25
22 See, e.g. (AECOM, 2014)
23 See e.g. (CME, forthcoming) for an overview 24 (The Brattle Group, 2014, p. 3)
13 Electricity tariffs typically consist of more than one component. While each tariff explored below is kept simple, they should be considered not as separate types of tariffs, but as tariff components that can be combined. Also note that the sample tariffs represent network charges only, not final prices. Final electricity prices will be determined by how retailers choose to interpret network tariffs.
Two Part Tariff
The two parts of a ‘two part tariff’ are typically a fixed charge (e.g. per day) and a variable charge (e.g. per kWh of energy consumption). Every unit of consumption faces the same charge: the variable charge is flat (per unit of energy). This is sometimes called an “anytime energy” charge. Two part tariffs are currently the most common form of tariff for Australian households.26 They are
very simple to understand, and neither consumer bills nor DNSP revenues vary greatly compared to other tariffs. However, two part tariffs are not cost reflective, as the flat/anytime energy price cannot reflect that the cost of consuming electricity changes over time.
Table 1: Sample two part tariff for electricity
Fixed charge (per day) $1.13
Energy price (per kWh) 25.0c
Inclining Block/Declining Block Tariff
A ‘block tariff’ treat different levels of consumption differently. Consumption is split into pre-determined ‘blocks’, each with its own price. The variable charge will therefore change, either rising or falling depending on whether the tariff is inclining or declining.
In an inclining block tariff, the first block of energy used will face lower charges and latter blocks (higher levels of consumption) will face higher charges. The blocks are set by the DNSP based on the characteristics of their network and customer base. Table 2 and Table 3 provide examples of inclining and declining block tariffs, respectively.
Table 2: Sample inclining block tariff for quarterly electricity
Energy consumption
0–200 kWh 201–800 kWh 800+ kWh
Energy price (per kWh) 19.5c 22.5c 24.3c
Fixed charge (per day) $1.13
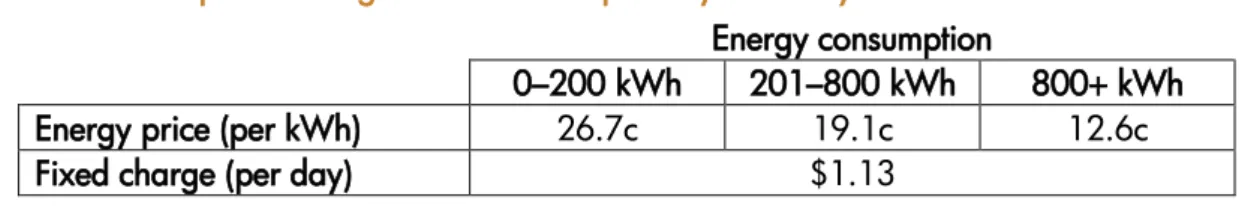
In a declining block tariff, the first block of energy used will face higher charges and latter blocks (higher levels of consumption) will face lower charges.
Table 3: Sample declining block tariff for quarterly electricity
Energy consumption
0–200 kWh 201–800 kWh 800+ kWh
Energy price (per kWh) 26.7c 19.1c 12.6c
Fixed charge (per day) $1.13
26 Confusingly, in the context of time of use pricing, a two part tariff is sometimes referred to as a “single
part tariff”, as there is one rate for usage. This is generally in juxtaposition to “two part” (peak/off peak) and “three part” (peak/shoulder/off peak) prices.
14
Inclining and declining block tariffs are usually combined with a fixed charge, and are common in residential electricity and gas markets. They are slightly more complicated than flat (two part) tariffs, but can be a little more cost reflective to the extent that the inclines or declines reflect increasing or decreasing cost of production at larger scales.
However, inclining block tariffs can also be used to provide cheaper energy for small users (users who use little energy), potentially under the assumption that small users are low income users, or to improve the marketability of an offer.
Inclining block tariffs tend to result in greater variability in customer bills and DNSP revenue than declining block tariffs, as a greater proportion of the total bill will depend on higher price blocks being reached.
Seasonal Pricing
Seasonal pricing treats consumption in different months differently. For instance, in residential gas pricing the variable charge (unit price) is commonly higher in winter than in summer. The same approach can be applied to electricity tariffs:
Table 4: Sample seasonal price for electricity
Season
Summer (Dec–Mar) Winter (Apr–Nov)
Energy price (per kWh) 27.8c 18.4c
Fixed charge (per day) $1.13
Seasonal pricing can reflect different costs in different seasons, for example that the gas network is closer to capacity in winter than in summer, or conversely that the electricity network is closer to capacity in summer than in winter.
Time of Use Pricing
Time of use (ToU) pricing treats consumption at different times of the day differently. Days are commonly split into two or three periods: peak and off peak; or peak, shoulder, and off peak. 27
ToU is cost reflective as peak periods typically correspond with the times that the network faces high load; off peak periods are times of low network load; and shoulder periods fall in between. Figure 2 illustrates the different periods, and Table 5 provides an example.
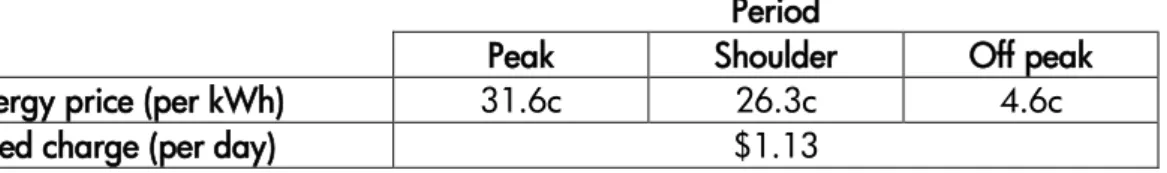
Table 5: Sample time of use tariff for electricity
Period
Peak Shoulder Off peak
Energy price (per kWh) 31.6c 26.3c 4.6c
Fixed charge (per day) $1.13
The multiple components and changes to prices every day make time of use tariffs initially challenging to understand for many consumers. ToU tariffs also require ‘interval meters’, which measure usage at regular intervals several times per day. These were not widespread in Victoria until the roll out of smart meters, which are interval meters with communication capability.
15
Figure 2: Sample time of use periods
Source: Victorian Government
Time of use pricing has been available in Victoria since the 1970s under different names. The most recent incarnation is “Flexible Pricing”, which was launched in September 2013.28 Few
Victorian households are on time of use tariffs.
Capacity Tariff
A capacity tariff includes a charge for a certain proportion of the network that is kept available for the customer. The capacity is analogous to the ‘width of the pipe’ that is made available for the consumer; in the same way that customers choose how fast they want their internet to be (in Mbps), customers choose how much electricity they want to be able to use at once (in kW).29
Capacity charges often replace the fixed charge and are typically combined with an energy consumption charge.
Table 6: Sample capacity tariff for electricity
Capacity band
4 kW 8 kW 15 kW
Capacity charge (per day) $1.01 $2.02 $3.78
Energy price (per kWh) 8.4c 8.4c 8.4c
28 See e.g. http://energyinfohub.org.au/learn-about-energy/4
29 Large users tend to be billed in kilovolt-amperes (kVA). Simplistically: electrical equipment can require
more power to be made available than it will consume. The power used (“active power”) is expressed in kW, while the power needed (“apparent power”) is expressed in kVA. The difference between the two becomes material chiefly for larger users.
16
Capacity charges are common among industrial users, and for residential users in some other countries.30 The customer pays for the capacity whether they use it or not, reflecting that they are
paying for the availability.
Should usage exceed capacity, a customer’s supply may be curtailed (as though a fuse had been tripped) or the customer may be automatically moved to a higher capacity band. If the customer is moved to a higher band, it is typically difficult to move back to a lower band. This is known as ‘ratcheting’.
Capacity tariffs can be strongly cost reflective, as they can signal to a consumer the cost of the network that consumer requires. Customer bills and DNSP revenue also tend to be very stable. However, small consumers can find it very difficult to know what capacity they use or need, and the concept of paying for availability rather than use is not common amongst households.
Maximum Demand Tariff
A maximum demand tariff includes a charge for the highest level of instantaneous usage
(“demand”, in kW) within a given time period.31 A monthly maximum demand tariff, for
example, would charge according on the highest usage day during each month. Usually only demand within certain hours (e.g. 3pm–9pm) is counted, as usage outside these times is easily handled by the network.
A household’s maximum demand will typically occur when multiple appliances are running at once. For example, in summer peak demand might be reached when running several air conditioners and an electric cooktop; in winter, perhaps by running electric heaters, an oven, and a clothes dryer.
A maximum demand tariff is similar to a capacity tariff, except that the customer does not have to choose a band in advance.
Table 7: Sample monthly maximum demand tariff for electricity
Demand charge ($/kW/month) $7.56
Energy price (per kWh) 8.4c
Customers only pay for a certain level of network capacity once they have demanded (used) it. This makes a maximum demand charge less cost reflective than a capacity charge, but also removes the need for consumers to specify their usage in advance.
Critical Peak Pricing / Critical Peak Rebate
The instances in which electricity networks come closest to being used at full capacity are called ‘critical peaks’. Under critical peak pricing (CPP), customers face relatively low electricity tariffs for most of the year, but relatively very high tariffs during the few, short critical peak periods.
30 E.g. France, Italy, Spain, and Japan. See AECOM (2014)
31 In practice, “instantaneous usage” is never measured; the highest consumption over a short period (e.g.
17 The critical peak periods are typically several hours long on a specified day, and communicated to customers at least a day in advance. DNSPs are limited in how many days per year they can declare as critical peaks (e.g. 5, 10, or 15 days per year).
A critical peak rebate (CPR) targets the same critical peak periods, but offers customers a rebate if they voluntarily reduce their consumption during the specified times. These are offered as often as the DNSP sees fit.
Critical peak prices and rebates can be applied to demand or consumption, and combined with other tariff features (e.g. time of use). Table 8 shows a simple CPP tariff based on consumption.
Table 8: Sample critical peak consumption tariff for electricity
Period
Critical Peak Off peak
Energy price (per kWh) 97.4c 8.2c
Fixed charge (per day) $0.80
Critical peak days are determined based on forecast weather and network conditions, and are rarely known more than a week in advance. The stability of customer bills and network revenue is therefore much lower under critical peak prices and rebates.
AusNet Services has had a Critical Peak Demand tariff for large business consumers since 2011, and several DNSPs have trialled or are trialling critical peak rebate schemes. Despite being amongst the most cost reflective tariffs, CPP and CPR tariffs are also amongst the most complicated.
Controlled Load Tariff
A controlled load tariff is a tariff that applies only to load (demand) that the DNSP can control, and is typically used for electric hot water systems or slab heating. In exchange for using appliances at certain times when the network is quiet, their consumption is charged at a lower rate. Controlled loads typically require additional or separate meters, sometimes known as dual element meters. Controlled loads are most appropriate for appliances that can run at any time but still serve the household. For example, even if a hot water system heats over night, with a large enough tank it can provide hot water throughout the day. The range of appliances that are appropriate for controlled loads is limited.
Locational pricing
Locational pricing is a term used to describe tariffs specific to certain geographic areas. A location-specific tariff can be used to reflect costs or target behaviour in a particular area that has different characteristics to its neighbours. This reflects the fact that network capacity is not constant across the network, but differs from suburb to suburb or town to town.
For example, one suburb within a network might be closer to reaching the network’s local capacity than other suburbs, perhaps because a new housing development has a great number of air conditioners. High electricity consumption in this suburb will cause greater network costs than similar usage in other suburbs, and a locational price would target specifically that suburb in response. The locational price might be higher charges, or discounts for reducing usage.
18
5.
Tariff proposals
The concepts from the simple tariff types discussed in the previous section can be combined, as evidenced by the currently public proposals from Victorian distribution companies. The five Victorian DNSPs are AusNet Services (formerly SP AusNet), CitiPower, Jemena, Powercor, and United Energy.
The proposals are required to be ‘revenue neutral’: new tariffs will change how much revenue a DNSP collects from a particular group, but not how much revenue it collects overall.
United Energy
United Energy’s proposed cost reflective tariff combines a flat rate (“anytime”) energy charge and a maximum demand charge that differs by season – see Figure 3. While there is no separate fixed charge, the demand charge has a minimum of 1.5kW – effectively a fixed capacity charge.
Figure 3: United Energy 2015 Seasonal Demand Time of Use Residential Tariff (ex-GST)
Source: (United Energy, 2014, p. 29)
Please note that this tariff is for distribution only, and will thus not reflect all network charges.32
Nor will this tariff structure, or its levels, necessarily be reflected in retail electricity offers.
United Energy’s network augmentation is driven by its peak demand. This is reflected in a high demand charge between 3pm and 9pm on all days during the ‘summer’ months of December to March. While customers’ peak demand during the rest of the year is less relevant, United Energy has chosen to send more regular pricing signals by continuing to charge for peak demand during non-summer months – albeit at a lower rate.
A regular, monthly price signal is more likely to be internalised by consumers; more likely to be
adopted into their daily choices and behaviour. (This, of course, assumes electricity retailers also bill monthly.)
32 Network Use of System (NUOS) charges are made up of Distribution Use of System (DUOS) charges and
Transmission Use of System (TUOS) charges.
Tariff
Name Component Description
Charging Parameter
Rate Summer (Dec-Mar)
Rate Non Summer
(Apr-Nov) Criteria Average DUOS Bill (4200KWh pa) DUoS Charge Split Billing Energy Anytime energy on any day type.
Seasonal consumption
elements. Initially same price for
Summer and Non Summer.
c/kWh 2.50 2.50 Monthly energy kWh.
Summer = Dec-Mar $105 40%
Demand $/kW/month 7.10 2.80
Max Actual demand between 3-9 PM local timefor the month. Summer =
Dec -Mar
$160 60%
Monthly Minimum of 1.5KW
Seasonal Split $/Month $27.88 $17.98 Total $265 100%
R e s id e n ti a l d e m a n d / T im e o f U s e (R E S K W T O U ) M o n th ly
Actual Max Demand on any day type between 3 - 9PM local
time. Seasonal demand elements. Price premium for
Summer reflects network constraint. Monthly Minimum of
19 United Energy’s residual costs – those costs not related to usage – are recovered in part through the minimum demand charge, but mostly through the energy charge. While this is less cost reflective than alternatives, it is also more familiar to and likely to be understood by consumers. While United Energy’s proposed tariff does not contain a CPP/CPR component, United Energy is trialling critical peak rebate schemes in those locations most likely to exceed network capacity.
Jemena
Jemena’s 2015 proposal to the AER contains draft information about their cost reflective structure and prices.33 Jemena plans to introduce their residential cost reflective tariffs in 2018, essentially
by adding a maximum demand component to their existing residential tariffs.
Tariff name Component 2017 price 2018 price
“General purpose“ Standing charge $2.28 / month $1.824 / month
Energy charge 8.675c / kWh 6.830c / kWh
Monthly demand charge N/A $2.42 / kW
“Flexible” Standing charge $2.28 / month $1.824 / month
Peak energy charge 14.695c / kWh 10.102c / kWh
Shoulder energy charge 9.323c / kWh 6.830c / kWh
Off peak energy charge 4.411c / kWh 2.714c / kWh
Monthly demand charge N/A $2.42 / kW
“Time of Use Interval Meter”
Standing charge $2.28 / month $1.824 / month
Peak energy charge 14.072c / kWh 10.102c / kWh
Off peak energy charge 2.200c / kWh 1.912c / kWh
Monthly demand charge N/A $2.42 / kW
Source: Adapted from (Jemena, 2015a) and (Jemena, 2015b)
Note: “Flexible” and “Time of Use Interval Meter” are marketing names for the tariffs. They are three part and two part time of use tariffs, respectively.
The maximum demand component would be charged monthly on the highest half-hourly usage between 10am and 8pm on weekdays, and other components would decrease in price as a result. The proposed maximum demand charge in 2018 is 50 per cent of what Jemena intends to eventually charge.
Other DNSPs
At the time of writing, none of AusNet Services, CitiPower, or Powercor had publicly released details of their cost reflective tariffs.
20
6.
Customer impacts
While the theoretical merits of a particular tariff are important, consumers, consumer advocates, and community groups are likely to judge any new tariffs based on changes to the current situation. There is likely to be particular focus on the short term ‘winners’ and ‘losers’ of network tariff reform, even if the ‘losers’ are better off in the long run.
An important starting point is to note that DNSPs are not ‘raising prices’: some consumers will pay more, and some less, but on balance a DNSP’s total revenue will not change; it is limited by the AER’s determinations. The effects of tariff changes are therefore best thought of as a redistribution between consumers – noting that the State is also involved via the welfare system. A redistribution can be judged on the direction of the flows and their magnitude: who gains or loses, and how much they gain or lose. This section summarises relevant research in this area.
Vulnerable groups – Deloitte
In 2010, the Victorian Government commissioned Deloitte to determine the potential effects on residential and small business consumers of new electricity pricing arrangements enabled by smart meters. Deloitte collected statewide usage data from DNSPs and retailers and combined it with a range of demographic factors to analyse and identify which factors explain consumer vulnerability to changes in pricing structures.34 A second stage of analysis was completed in
2012.
While Deloitte’s analysis was not conducted with the current cost reflective tariff reforms in mind, it is one of the largest and most comprehensive Australian studies publicly available.
A focus of Deloitte’s work was identifying the effects of new tariffs on groups vulnerable to potential increases in energy prices. The groups identified as potentially vulnerable included:
The elderly;
Households with low net worth;
Households with low incomes;
Households needing assistance at home;
Single parent households;
Single income households;
Agriculture, forestry, and fisheries workers (referred to as ‘regional households’);
Healthcare concession card holders; and
Pension concession card holders.35
The membership of these groups overlaps in some cases.
For each of these groups, and for all consumers, Deloitte estimated changes to bills across a range of tariffs both when customers changed their behaviour and when customers did not. The tariffs tested were a mixture of two part and time of use tariffs, some with seasonal variation and/or critical peak pricing elements. No demand or capacity tariffs were tested.
34 (Deloitte, 2012, p. 8) 35 (Deloitte, 2012, pp. 13-14)
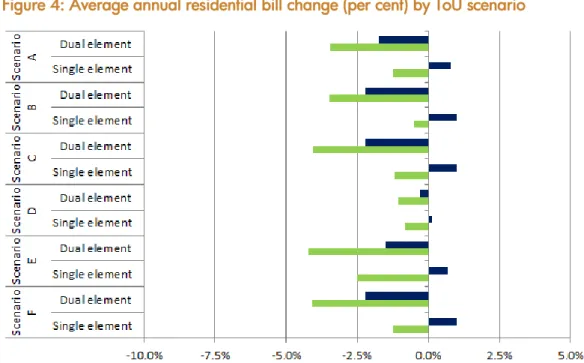
21 Deloitte’s findings included that:
The average annual bill changes for most modelled scenarios were relatively modest even
without behavioural change (see Figure 4), and no more than +2 per cent to -4 per cent for the vulnerable groups;
With behavioural change, all modelled customer groups experienced bill reductions of up
to 9 per cent;
No particular group could be expected to be consistently better or worse off across the
tariffs modelled;
While no particular group was, on average, greatly better or worse off, there could be
significant variation within groups – i.e. individual consumers could experience large bill changes; and
Belonging to a particular group is not, of itself, the most important factor in determining
the effect of a tariff change.
Figure 4: Average annual residential bill change (per cent) by ToU scenario
Source: (Deloitte, 2012, p. 40)
Notes: Dual element meters are meters where a controlled load (or other secondary load) such as an electric hot water system is measured separately. Elasticity is the degree to which behaviour changes is response to a price change. Revenue neutrality is the condition that a distributor’s total revenue (the sum of everyone’s network charges) does not change.
22
Small customers – Ellipson
In 2014, the Total Environment Centre commissioned Ellipson to investigate the implications of cost reflective tariffs on customers in NSW and Victoria, focussing on small customers.36 Ellipson
used data from Ausgrid and Endeavour (in NSW) and CitiPower/Powercor (in Victoria), considering both urban and regional/rural consumers.
Ellipson modelled bill changes for tariff components including:
Any time energy rate (reference case);
Fixed charge;
Maximum demand charge;
Time of use charge (peak, shoulder, off peak);
Seasonal time of use; and
Critical peak price.
Figure 5, below, shows the distribution of effects from the modelled tariffs. The portion of the graph to the left of centre shows the customers who see bill decreases; the portion to the right of centre shows bill increases.
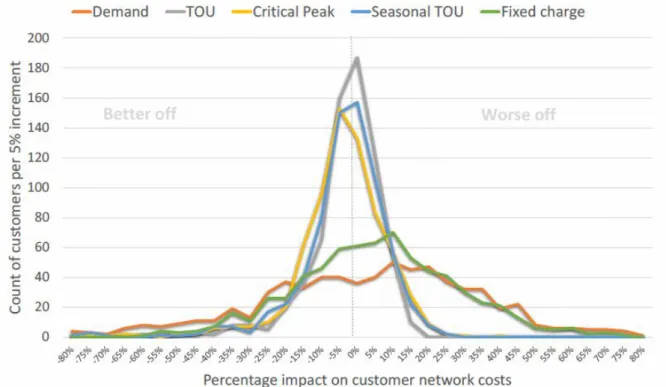
Figure 5: Distribution of customer cost effects
Source: (Ellipson, 2014, p. 32)
Ellipson found that, for a maximum demand tariff (red line), 51 per cent of households’ distribution costs changed by less than $100 per year. (This included both increases and
36 (Ellipson, 2014) “Small customers” in Victoria were defined as those with <3.5 MWh consumption per
year. The AER considers a benchmark low income Victorian household to use 4.7 MWh per year. (AER, 2014)
23 decreases.) For ToU (grey), seasonal ToU (blue), and CPP tariffs (yellow), 85–87 per cent of effects were within $100 per year, and 96–97 per cent of effects were within $200 per year. Ellipson did not analyse bill changes by customer characteristics other than consumption (i.e. they did not use income or demographic characteristics), and noted that it is not clear without further information how vulnerable customers and other customers would differ. Additionally, the
analysis assumed no behavioural response.37
Residential customers – CSIRO
A 2014 study by the Commonwealth Scientific and Industrial Research Organisation (CSIRO) used 12 months of metering data from residential households in Melbourne, Adelaide, and Brisbane to model the effects of four different tariff types. A flat tariff, inclining block tariff, time of use tariff, and critical peak price were applied to the data to see the effects on households’ bills under each scenario.38
The authors do not claim that the households used in the study are representative of the Australian population, and the small sample size limits the conclusions that can be confidently drawn for sub-groups.
The study found that the effect of time sensitive tariffs was generally similar for different household groups, with a few exceptions. Households with someone at home all day were relatively worse off than other groups, while families with preschool children or with higher numbers of children were relatively better off.
Households that used gas for heating were less affected than other households, but larger energy using households were able to obtain greater benefits by responding to new tariffs than other households. There was very little difference in the amount of bill reduction able to be achieved through demand response (behavioural change) by households of different types or locations; the effects were within 1.0 percentage point.39
The study modelled the effects of different types of demand response for each type of tariff relative to the reference case; i.e. the authors simulated how households’ bills would have changed under each tariff if households changed behaviour by reducing or shifting their load. Under the CPP tariff, modelled bills increased by 7.7 per cent on average without demand response. If households changed their behaviour, bills still increased but by less – 1.3 per cent at best.
Under the flat and inclining block tariffs, bills increased by 0.6–1.0 per cent on average without demand response. With demand response, most types of behavioural change allowed all
households to achieve lower bills than in the reference case.40 (The reference case assumed no
behavioural change, as it modelled the status quo.)
37 (Ellipson, 2014, p. 32)
38 (James, Ambrose, & Paterson, 2014)
39 (James, Ambrose, & Paterson, 2014, pp. vi-vii) 40 (James, Ambrose, & Paterson, 2014, pp. 28, 44)
24
DNSP modelling
As DNSPs have the best information on both their customers’ electricity usage and the tariffs they are considering implementing, their analysis can be one of the most important sources of information in assessing the distributional effects of proposed network tariffs. It is of great importance that the modelling be done well, and the results should be scrutinised by consumer advocates and community groups.
While all DNSPs have access to rich datasets on electricity usage, most lack demographic data to complement it; DNSPs know when and how much electricity a household uses, but not how many people live in the household, their ages, incomes, or other characteristics.
The simplest form of analysis therefore segments a DNSP’s consumers by the characteristics the DNSP plans to charge on, e.g. levels of consumption and demand:
Table 9: Proportion of customers by consumption and demand segment (example)
Consumption
Low Medium High
Dem
and Low Medium 12% 7% 48% 7% 0.1% 7%
High 0.1% 7% 12%
The effect of the DNSP’s proposed tariff, relative to the status quo, can then be calculated:
Table 10: Change in annual network charge by consumption and demand (example)
Consumption
Low Medium High
Dem
and Low Medium +$50 +$75 −$100 −$25 −$150 −$75
High +$150 +$100 +$50
Further analysis might add assumptions about each segment, drawn from census data for a particular area or other data sources. For example, a low consumption/low demand household may be an apartment dweller, while a low consumption/high demand household might be a household with solar panels. A high consumption/high demand household might be a large household with multiple children. These assumptions will differ between (and within) DNSPs customers, reflecting different demographics in different areas.
As outlined in the introduction to this report, one significant reason for network tariff reform is the decreasing link between households’ consumption and their demand. Households with high consumption and high demand, or low and consumption and low demand, could be charged for consumption instead of demand and pay roughly the same.
25 However, households with high consumption and low demand would pay arguably too much if they were charged on consumption; households with low consumption and high demand would pay too little.
In any switch from charging on consumption to charging on demand, those consumers whose consumption and demand do not ‘match’ are likely to face greater effects from new tariffs than those with high correlation. The relationship between a household’s consumption and its demand is one of the biggest factors determining whether a household will be a ‘winner’ or ‘loser’ from cost reflective tariffs.
While this is arguably fair in the general case, overlaying the changes with demographic information can help identify whether any particular groups – in particular, low disadvantaged and vulnerable groups – are unreasonably affected.
Reassuringly, the data that CUAC has reviewed does not suggest a clear pattern of ‘losers’ in any demographic group. However, we encourage further analysis of DNSPs’ information.
26
7.
Tariff implementation and transition
Gaining consumer acceptance and understanding of a tariff is at least as important as the choice of tariff itself. The most useful end point of network tariff reform is likely to be tariffs that trade cost reflectivity for understandability, consistency across DNSPs, and public acceptance.
While cost reflective prices align optimal consumption decisions with optimal production decisions, the price signals sent by electricity bills are not terribly effective. Nobody regards turning on a light switch as a purchase; nobody switches their kettle on and thinks, “Now I am buying electricity.”
Price signals work when they occur at the point of purchase, i.e. at the point of the behaviour. Electricity prices aren’t communicated this way: they are delivered in bills, up to three months after consumption, with little salient relationship to the activity. The time lag means any signals that apply to behaviour are unlikely to arrive until different conditions apply and responding to the price signals may be unnecessary. By the time the initial conditions roll around again, the price signals have been forgotten.
Because the relationship between billed price signals and behaviour is so abstract and separated, and because consumers have such little engagement with electricity, implementation of the network tariff reforms must look beyond simply implementing tariff changes and waiting for consumers to respond.
Implementation must involve adequate time to build consumer understanding and acceptance of the reforms, internalising the need for behavioural change that is then reinforced by price signals. A precondition of tariff implementation is therefore socially priming consumers for their introduction. Research by RMIT University found that consumers were often more motivated to change their behaviour when the benefits to the community – lower network investment leading to lower network prices – were communicated to them, rather than relying on individual motivations. Non-economic and non-financial understandings of energy consumption and change were also important.41
An example of a fundamental reform that was implemented with great success is the switch from analogue to digital television.
The analogue-digital switch was mandatory: on a certain date, analogue signals ceased being broadcast and consumers were required to have a digital receiver. However, the switchover didn’t rely on removing analogue signals to make consumers buy a digital receiver: the need was communicated during a lengthy information campaign, with cohort specific marketing and assistance (e.g. household visits) for those struggling with the reforms. For several years prior to the switchover, it also became increasingly difficult to purchase non-digital televisions or receivers. Switching analogue signals off reinforced a behavioural change that had, by and large, already been achieved through other means.
This could serve as a useful template for network tariff reform.