Cloud Computing
Market Maturity
Study Results
Abstract
The maturity of a product or service offering changes over time, advancing from infancy through levels of maturity before eventually reaching a plateau and decline. Cloud computing, according to participants in a 2012 study conducted jointly by the Cloud Security Alliance (CSA) and ISACA, is at the point of advancing from infancy to growth and is reaching a level of maturity at which enterprises can benefit greatly by adopting cloud infrastructure, platform or software service offerings. This report provides an understanding of the level of cloud market maturity and explores the factors that will increase growth in the market as well as those that limit acceptance and reduce the benefits that enterprises can receive from cloud computing. To enterprises involved with cloud computing, the report provides CSA’s and ISACA’s recommendations to address important cloud-related issues. The report also
201
Cloud Security Alliance
The Cloud Security Alliance (CSA) is a not-for-profit organization with a mission to promote the use of best practices for providing security assurance within Cloud Computing, and to provide education on the uses of Cloud Computing to help secure all other forms of computing. The Cloud Security Alliance is led by a broad coalition of industry practitioners, corporations, associations and other key stakeholders.
ISACA®
With more than 100,000 constituents in 180 countries, ISACA (www.isaca.org) is a leading global provider of knowledge, certifications, community, advocacy and education on information systems (IS) assurance and security, enterprise governance and management of IT, and IT-related risk and compliance. Founded in 1969, the nonprofit, independent ISACA hosts international conferences, publishes the ISACA® Journal, and develops international IS auditing and control
standards, which help its constituents ensure trust in, and value from, information systems. It also advances and attests IT skills and knowledge through the globally respected Certified Information Systems Auditor® (CISA®), Certified Information
Security Manager® (CISM®), Certified in the Governance of Enterprise IT® (CGEIT®) and Certified in Risk and Information
Systems ControlTM (CRISCTM) designations.
ISACA continually updates and expands the practical guidance and product family based on the COBIT® framework.
COBIT helps IT professionals and enterprise leaders fulfill their IT governance and management responsibilities, particularly in the areas of assurance, security, risk and control, and deliver value to the business.
Disclaimer
The Cloud Security Alliance and ISACA have designed and created 2012 Cloud Computing Market Maturity Study Results (the “Work”) primarily as an educational resource for cloud computing users, providers and those interested in cloud computing. The CSA and ISACA make no claim that use of any of the Work will assure a successful outcome. The Work should not be considered inclusive of any proper information, procedures and tests or exclusive of other information, procedures and tests that are reasonably directed to obtaining the same results. In determining the propriety of any specific information, procedure or test, security, governance and assurance professionals should apply their own professional judgment to the specific control circumstances presented by the particular systems or information technology environment.
Reservation of Rights
© 2012 ISACA. All rights reserved. No part of this publication may be used, copied, reproduced, modified, distributed, displayed, stored in a retrieval system or transmitted in any form by any means (electronic, mechanical, photocopying, recording or otherwise) without the prior written authorization of ISACA. Reproduction and use of all or portions of this publication are permitted solely for academic, internal and noncommercial use and for consulting/advisory engagements, and must include full attribution of the material’s source. No other right or permission is granted with respect to this work.
Cloud Security Alliance
General inquiries: [email protected]
Membership information: https://cloudsecurityalliance.org/csa-corp-member.pdf Media inquiries: [email protected]
ISACA
3701 Algonquin Road, Suite 1010 Rolling Meadows, IL 60008 USA Phone: +1.847.253.1545 Fax: +1.847.253.1443 Email: [email protected] Web site: www.isaca.org
The CSA and ISACA wish to recognize:
Contributors
C. Warren Axelrod, Ph.D., CISM, CISSP, USA Bhavat Bhagat, CISM, CGEIT, USA
Stefano Ferroni, CISM, Italy
Vicki Gatewood, CGEIT, CRISC, USA Masatoshi Kajimoto, CISA, CRISC, Japan Wing Ko, USA
Yves Marcel Le Roux, CISM, CISSP, France
Romulo Lomparte, MBA, CISA, CGEIT, CRISC, IRCA, Peru Marco Aurelio Maia, PMP, CRISC, BS-7799 LA, Brazil Bassil Mohammad, CISA, CISM, CRISC, CEH, LISA, Jordan Joao Souza Neto, Ph.D., CGEIT, CRISC, Brazil
Richard Norman, CISA, CISM, CGEIT, CRISC, UK Antonio Ramos, CISA, CISM, CRISC, Spain Mary Siero, CISM, CRISC, CISSP, USA Frank Simorjay, CISSP, USA
Henry St. Andre, USA
Joe Stevens, CISSP, Czech Republic
Vikrant Tanksale, CISA, CMA, ACWA, Sultanate of Oman
Reviewers
Phillip J. Lageschulte, CGEIT, CPA, USA, Chairman Dan Haley, CISA, CGEIT, CRISC, MCP, USA Yves Marcel Le Roux, CISM, CISSP, France David Lingenfelter, USA
Aureo Monteiro Tavares Da Silva, CISM, CGEIT, Brazil Jotham Nyamari, CISA, USA
Connie Lynn Spinelli, CISA, CRISC, CFE, CGMA, CIA, CISSP, CMA, CPA, USA John William Walker, CISM, CRISC, FBCS CITP, UK
Siang Jun Julia Yeo, CISA, CPA (Australia), Singapore Nikolaos Zacharopoulos, CISA, CISSP, Germany
Project Staff
Aaron Alva, CSA Intern
Luciano “J.R.” Santos, CSA Director of Research John Yeoh, CSA Research Analyst
Table of Contents
List of Figures ...5
List of Tables ...5
Cloud Market Maturity Study Highlights ...6
Introduction to the Report ...7
Defining Cloud Market Maturity ...7
Survey Participants ...8
User Perspectives on Cloud Computing ...9
Cloud Market Maturity ...12
Innovation in the Cloud ...13
Forces That Influence Innovation ...16
Confidence and Optimism in the Cloud Computing Market ...18
Confidence Barometer ...19
Service Confidence ...19
Strategy Confidence ...23
Problem Resolution Confidence ...25
Optimism Barometer ...31
Strategy Optimism ...32
Problem Resolution Optimism ...32
List of Figures
Figure 1—Geographic Participation by Region ... 9
Figure 2—Mean Scores of Business, Financial and Environmental Factors Influencing Cloud Decisions ... 11
Figure 3—Cloud Services Market Maturity Stages ... 12
Figure 4—Time for Market Maturity to Reach Growth and Maturity Levels ... 12
Figure 5—Level of Cloud Market Innovation ... 13
Figure 6—Groups Driving Cloud Innovation ... 14
Figure 7—Mean Scores of Business Group Influence on Cloud Innovation ... 14
Figure 8—Market Segment Benefit and Demand for Innovation ... 15
Figure 9—Mean Scores of Cloud Confidence and Optimism Components ... 19
List of Tables
Table 1—Cloud Market Maturity Model ... 8Table 2—Cloud Services Used and Satisfaction With Cloud ... 10
Table 3—Cloud Support for Business Goals ... 15
Table 4—Positive and Negative Influences on Cloud Adoption and Innovation ... 17
Table 5—Positive Influence Factors for Business Growth and Process Enablement ... 17
Table 6—User and Provider Perspectives on Negative Influences on Cloud Adoption and Innovation ... 18
Table 7—Confidence Barometer Summary Indicators ... 19
Table 8—Service Components in the Confidence Barometer ... 20
Table 9—Clarity of Concept Components in the Confidence Barometer ... 20
Table 10—Value Components in the Confidence Barometer ... 21
Table 11—Risk Components in the Confidence Barometer ... 21
Table 12—Role Definition Components in the Confidence Barometer ... 22
Table 13—Requirements Components in the Confidence Barometer ... 22
Table 14—Performance Monitoring Components in the Confidence Barometer ... 22
Table 15—Strategy Components in the Confidence Barometer ... 23
Table 16—Enterprise Strategy Components in the Confidence Barometer ... 23
Table 17—Strategy Components for Large and Small Enterprises in the Confidence Barometer ... 23
Table 18—Innovation Components in the Confidence Barometer ... 24
Table 19—Financial Components in the Confidence Barometer ... 24
Table 20—Alignment Components in the Confidence Barometer ... 25
Table 21—Customer Components in the Confidence Barometer ... 25
Table 22—Opportunity Components in the Confidence Barometer ... 25
Table 23—Problem Resolution Components in the Confidence Barometer ... 26
Table 24—Continuity and Availability Components in the Confidence Barometer ... 26
Table 25—Performance Components in the Confidence Barometer ... 27
Table 26—User and Provider Perspectives on Performance Components ... 27
Table 27—Problem Management Components in the Confidence Barometer ... 28
Table 28—User and Provider Perspectives on Problem Management Components ... 28
Table 29—User/Supplier Relationship Components in the Confidence Barometer ... 28
Table 30—User and Provider Perspectives on User-Supplier Relationship Components... 29
Table 31—Solution Integration Components in the Confidence Barometer ... 29
Table 32—Security and Assurance Components in the Confidence Barometer ... 29
Table 33—User and Provider Perspectives on Security and Assurance Components ... 30
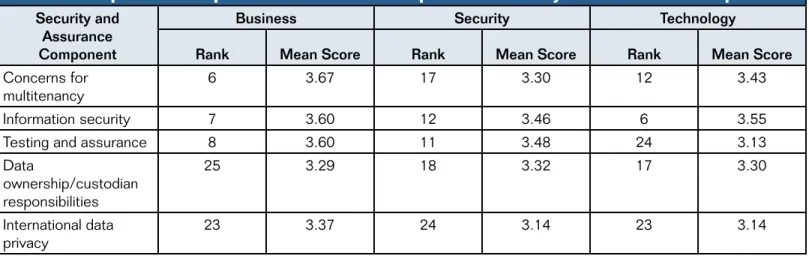
Table 34—Confidence Perspectives of Different Disciplines on Security and Assurance Components ... 30
Table 35—Contract Components in the Confidence Barometer ... 31
Table 36—User and Provider Perspectives on Contract Components ... 31
Table 37—Geographic Perspectives on Contract Components ... 31
Table 38—Regulation and Legislation Components in the Confidence Barometer ... 31
Table 39—Strategy Components in the Optimism Barometer ... 32
Table 40—Problem Resolution Components in the Optimism Barometer ... 33
Cloud Market Maturity Study Highlights
This study was undertaken in the second quarter of 2012 by the Cloud Security Alliance (CSA) and ISACA to gauge the level of maturity and innovation in the cloud market, and to encourage discussions that will facilitate a better understanding of the market and the factors that encourage or constrain market maturity. The data presented were drawn from responses provided by 252 study participants representing a global community of cloud users, service providers, integrators and consultants. The interpretation of these findings is offered by CSA and ISACA as a means of synthesizing the multiple and complex concepts addressed in the study. In addition, CSA and ISACA have identified resources that can be leveraged to address issues presented in the report. It is hoped that these resources will support supplier user organizations and individuals involved with cloud computing to advance cloud computing to its full potential.
Expectations are high for cloud computing. The prevailing belief is that cloud computing can provide significant opportunities for enterprises to innovate in ways that could disrupt established ways of providing and using information technology. However, according to the participants in the CSA/ISACA survey, the cloud market has not yet reached a level of maturity that will support this scenario. Instead, the survey participants believe that platform and infrastructure service offerings are still in the infancy stage of maturity, while software service offerings are just emerging from infancy and are in the early stages of market growth. The respondents estimate that it will take approximately three years for cloud platform and infrastructure services to be firmly placed within the growth stage, and at least two years for software services to reach that stage.
Why is that important? Because it is within the growth stage of maturity that a clear understanding of what cloud computing is can be established in the market, empowering users to appreciate how it can be leveraged to provide value, what role changes in terms of accountability and responsibility need to evolve, and how enterprises can leverage cloud to benefit from supplier-user relationships. The growth stage marks cloud computing’s evolution as a product, releasing supplier and user organizations to move beyond established ways of thinking about technology and information to explore new approaches that will enable them to more effectively use technology to reduce cost, open new markets and better align technology with strategic goals.
Participants in the CSA/ISACA study are optimistic about the future of cloud computing, but they are concerned that viewing cloud purely as a technology rather than as a business issue constrains cloud market maturity. The study reveals that the value of cloud is understood by the chief information officer (CIO) and technology management, and cloud risk is addressed as technology risk rather than a business unit or enterprise issue. Respondents report that board and executive management do not have a realistic understanding of cloud computing benefits or risk. In addition, it is difficult to monitor business performance, and enterprises have problems specifying business and technical risk within service contracts. For cloud to provide enterprise-changing capabilities and the benefits that vendors have promised, it needs to transition from a technology solution to a business resource, which entails understanding what cloud is and what it promises, incorporating business and technical requirements into contracts, monitoring performance against requirements, and appreciating cloud-related risk within the wider context of the business and enterprise risk management.
Participants are confident that cloud is helping enterprises become more virtualized and distributed; reduce IT cost; and optimize the use of IT resources in supporting business units, in particular by bringing new applications to market more quickly. They are less confident that cloud is driving business innovation, increasing customer satisfaction, opening new markets and increasing revenues.
These problems, as identified and discussed in the market, have the potential for limiting cloud maturity if they create the perception that issues outweigh advantages. Survey respondents viewed availability, business continuity and disaster recovery as cloud service advantages, to the extent that they are currently addressed in the market. Similarly, they are highly confident that cloud service performance, system outages and problem resolution—typical technology issues—are currently being addressed. They are less optimistic that issues such as provider longevity, an understanding of data ownership and custodian responsibilities, legal issues, contract lock-in, and exit strategies are being addressed to the same extent. They are also concerned that government regulations are not keeping pace with market changes—a significant limitation, given the weight of regulatory compliance on enterprises.
Many of the benefits promised by cloud computing vendors are linked to the interest and ability of users and providers to utilize cloud as a force of change in how technology is deployed and and how technology and information are leveraged as a strategic resource. However, study participants note that cloud innovation is limited because enterprises are focusing internally rather than externally. Internally, cloud is being leveraged as a means of experimenting with new technologies and providing new services to enhance employee effectiveness and efficiency. Externally oriented goals, such as taking new ideas to market or providing best-in-class capabilities, are less often in focus.
Introduction to the Report
Cloud computing broke into the consciousness of business and technology leaders with the expectation that it would change many aspects of how technology would be acquired, managed and used. There were claims that cloud computing, as a disruptive technology, would change how enterprises would leverage information and information systems, how
technology groups would acquire and support technology, and how IT departments and business units would come together to address market needs and advance strategies. Predictions rang out that chief information officers (CIOs) would evolve to become integrators of technologies, coming from within the technology organization but increasingly leveraging platforms, infrastructures and services provided through a supply chain of cloud providers. To date, these expectations describe what is still a potential, not-yet-materialized future state, due to the level of maturity within the market.
Technical innovations, even disruptive ones, must pass through various life cycle stages as they are introduced, adopted, mature and eventually decline, to be replaced by newer, more interesting and potentially more beneficial innovations. In progressing through the life cycle of infancy, growth, maturity and decline, technologies evolve and offer the potential for greater innovation to enterprises that have likewise developed the ability to adapt and leverage new capabilities and ways of interacting with information and technology. At each stage, the clarity of definition, market acceptance, potential for innovation, and level of technical and operational integration within and between enterprises and suppliers evolve. It is in the process of maturing that cloud computing’s potential will be realized, advancing the ability of enterprises to trust in and extract value from cloud solutions. Cloud computing, as a disruptive technology, has the power to change enterprises. Positive change comes as service providers deliver and support truly distinctive offerings, and as enterprises integrate these offerings into programs and products successfully.
The change promised by cloud computing does not come easily. Providers need market permission and demand to be able to offer services that extend the ability of cloud users. Users need to be able to trust that services will meet their needs and provide a stable foundation on which they can build systems that enhance internal operations and provide the leverage required to better serve their stakeholders. Both providers and users need a holistic view of the current state of cloud computing. While there are many public discussions concerning cloud and its promises and limitations, these discussions are often focused on specific aspects without addressing the wider view of what cloud is and what it can do. This, however, will come with market maturity. A market maturity perspective supports the needs of users and providers to put evolving issues and concerns into context and to enable them to focus on those aspects of cloud that will encourage the continued evolution of service offerings and product use.
CSA and ISACA offer this report to provide a view into the current state of cloud computing market maturity and the factors that enhance or limit the cloud’s ability to be truly disruptive, creating new opportunities for enterprises to innovate and explore ways of better using information to serve customers.
Defining Cloud Market Maturity
Market maturity can be approached from different perspectives. Maturity can be an aspect of market growth and development; within this approach, the maturity of the market is a measure of the extent to which cloud has penetrated the potential market and the revenue that is generated within the market. Maturity can be seen in terms of product evolution, the transition from a new product concept, through differentiation within the market, to productivity, and finally transparency as the capabilities of the product are fully developed and the product becomes widely accepted. Market maturity can also be described in terms borrowed from psychology, using the hierarchy of individual needs to describe product aspects such as survival, quality, convenience and customization. Finally, cloud market maturity can be explored in terms of provider and user processes because it is within processes that the ability to trust that services will provide expected value is achieved.
To examine the most important aspects of cloud computing (relations between suppliers and users, and current issues and requirements), CSA and ISACA have used a hybrid approach that addresses levels of product maturity from infancy to growth, maturity and eventual market decline. Within each stage there are particular elements that can be used to distinguish the different maturity levels. These distinguishing elements include:
• Market size and the diversity of products
• Clarity of definition and distinguishing factors between cloud and other outsourced arrangements • Acceptance of roles and responsibilities between users and providers and within user organizations • Level of integration between users and providers and within user organizations
• Extent of innovation in the market
• Problem resolution and the extent to which perceived problems limit adoption
• Clarity in understanding the benefits of cloud computing and the potential for an increased return on investment (ROI) Table 1 provides an overview of the maturity levels used in this study and a description of the distinguishing elements related to each.
Table 1—Cloud Market Maturity Model Stage Distinguishing Elements of the Cloud Market
Infancy The market is small with a potential for growth and innovation that has not been realized. The definition of cloud and related roles and responsibilities is not clear. ROI is uncertain. Users and providers can be considered early adopters.
Growth The market demonstrates significant adoption, rapid growth, and notable innovation in terms of product offerings and use. Definitions of cloud computing and how it can be leveraged are clear. Roles and responsibilities for cloud within the enterprise have evolved to address cloud’s unique aspects. Could computing is being integrated into core business activities. ROI is clear and examples of successful use are well known. Innovation leads to new product offerings not possible in earlier stages.
Maturity Market growth has reached its peak. The level of innovation is slowing. New entrants have a difficult time distinguishing themselves from established service providers. Organizational roles and responsibilities are stable, as are relations between users and providers. Cloud computing is business as usual.
Decline The cloud market is saturated with suppliers. Cloud computing is a commodity. Market leaders are clearly defined. There is little room for new entrants or new product offerings. Users and providers are looking for the next big opportunity.
Using the maturity model described in table 1, this report will provide insight into the following aspects of cloud computing: • The most important factors for users in making cloud decisions
• Estimates of the current market maturity
• Innovation, including the extent to which the cloud market provides opportunities for innovation, who in organizations influences innovation, and the factors that increase and limit innovation
• The measure of confidence in cloud and contributors and detractors to that confidence
• The measure of optimism that cloud will continue to evolve, providing value, strategy alignment, innovation and revenue generation
Survey Participants
A total of 252 complete surveys were received from participants representing cloud users, providers, consultants and integrators. The participants were employed in 15 different industry segments, in positions ranging from C-level executives to staff. Forty-eight countries were represented, with the majority of respondents residing in North America or Europe (figure 1).
Those who contributed to the study are a diverse group. A typical participant can be described as: • North American (120) or European (58)
• A manager (86) or vice president-level executive (70)
• Employed in an assurance role that includes specialization in information security, information systems audit, information systems risk management (129) or an information systems management or IT professional (80)
• Working in a large enterprise with more than 5,000 employees (89) or involved with cloud in a small enterprise with fewer than 100 employees (68)
Many of those who participated in the survey offer consulting or professional services (81). Other industry segments represented include technology companies (59), banking and financial services (33), government (18) and
telecommunications (15).
Figure 1—Geographic Participation by Region
User Perspectives on Cloud Computing
Of the 252 participants who contributed to the study, 213 or 84.5 percent identified themselves as cloud users. It should be noted, however, that among the full survey group, 173 identify themselves as a cloud service provider, integrator or consultant as well as a cloud user, leading to an early observation from this study: The dividing line between user and provider cannot easily be drawn. Providers appear to also leverage cloud infrastructures, platforms and services to manage their business and support their customers.
The majority of users have been involved with cloud computing for at least one year. Only 15 percent of the cloud users taking part in this study have less than one year of experience with cloud. Almost 42 percent of them have two or more years of cloud experience.
The participants were asked to identify the cloud services they are currently using, their level of satisfaction with their current services and the services they expect to use in the future. Table 2 presents a summary of current user experience with cloud computing services.
North America 120 responses 47.6% Europe 58 responses 23.0% Latin America 20 responses 7.9% Sub-Saharan Africa 2 responses 0.8% Middle East 11 responses 4.4%
Australia and Oceania
9 responses 3.6%
Asia
32 responses 12.7%
Table 2—Cloud Services Used and Satisfaction With Cloud Cloud Service Present Use Level of Satisfaction
Infrastructure as a Service (IaaS) 35.7%*
Mean score = 3.39
Platform as a Service (PaaS) 22.6%*
Mean score = 2.98
Software as a Service (SaaS) 62.3%*
Mean score = 3.66 * Some users reported using more that one type of cloud service.
In addition to reporting the types of services with which they have experience and their resulting satisfaction level, cloud users were asked to identify (from a supplied list) the factors that are most important to their enterprises in making cloud computing decisions. The factors listed included aspects that contribute to business enablement (e.g., elasticity of offerings, reliability and availability, quality of service, and the ability to move more quickly into markets) and financial factors (e.g., cost reduction, the ability to pay per use, opportunities for higher ROI, and the ability to turn capital expenses [CapEX] into operational expenses [OpEX]). Participants were also asked about the importance of reducing their environmental footprint as a factor that influenced their cloud decisions.
Business enablers, rather than financial considerations, dominated as the most important factors in making cloud decisions, while the least important factor is the ability to reduce the enterprise’s environmental footprint. Figure 2 provides the list of decision-making factors and the mean response of cloud users. Responses were recorded on a range of 0 to 5, where 0 indicates that the factor has no influence. A response of 1 indicates a minimal level of influence while 5 indicates the highest level of influence in making the cloud decision.
Overall, business enablement factors were the most important influence on cloud purchase decisions. The combined mean score for business enablement was 4.08, compared to a mean score of 3.50 for financial performance and 2.67 for environmental considerations. The standard deviation, a measure of how closely responses are grouped, is 0.71 for business
6.7% 3.7% 11.1% 23.7% 32.6% 22.2% Not Satisfied 0 Slightly Satisfied 1 2 Satisfied 3 4 Highly Satisfied 5 12% 5.6% 12.9% 26.6% 27.4% 15.3% Not Satisfied 0 Slightly Satisfied 1 2 Satisfied 3 4 Highly Satisfied 5 2.8% 2.2% 7.8% 24.4% 39.4% 23.3% Not Satisfied 0 Slightly Satisfied 1 2 Satisfied 3 4 Highly Satisfied 5
enablement factors compared to 1.06 for financial performance considerations and 1.59 for reducing the environmental footprint. Not only is business enablement significantly more important to cloud users in making cloud decisions, but the group expressing this preference is more closely aligned in establishing this as a priority factor.
Looking at the individual business enablement factors influencing cloud computing decision making, the most important factors are related to the reliability and availability of services (mean score 4.59) and quality of service (mean score 4.29). This implies a feeling of uncertainty concerning cloud computing that is consistent with cloud being seen as a new and not entirely mature service offering. Users selected those characteristics of cloud that large and well-established cloud vendors offer when they enter the market as cloud service providers. These vendors are reasonably expected to bring reliability and availability as a core part of the service.
It is more difficult to ensure agility and elasticity because these are dependent not only on the supplier offering the service, but also on the user who needs to make the service work within the enterprise. Nevertheless, agility and adaptability (mean score 3.97)
and elasticity (mean score 3.80) are other business enablement factors rated as important in making cloud decisions. It is interesting that reliability, availability, agility and elasticity are fundamental components of what cloud computing offers to enterprises; their top ranking by the participants who use cloud services supports the notion that users are more focused on general issues than specific elements unique to cloud.
Of the financial factors, the most significant for users in making cloud decisions is cost reduction (mean score 3.85), which is the only financial factor within the top five decision-making considerations. Quicker time to market (mean score 3.61) and obtaining a higher ROI (mean score 3.36) are the most important financial factors following cost reduction. Financial factors that are foundational aspects of cloud computing, such as turning capital expenses into operational expenses (mean score 3.21) and the ability to meter and pay for only those services that are used (mean score 3.14), are important but less significant than traditional decision-making financial factors.
Figure 2—Mean Scores of Business, Financial and Environmental Factors Influencing Cloud Decisions
Overall Business 4.08 Business Enablement Financial Performance Environment Agility/Adaptability 3.97 Reliability/Availability 4.59 Elasticity 3.80 Quality of Service 4.29 Overall Financial 3.50 Cost Reduction 3.85
Pay per Use 3.14
Higher ROI 3.36
Quicker Time to Market 3.61
Turn CapEX to OpEX 3.21
Reduce Environmental Footprint 2.67
Business enablement
factors figure more
prominently in making
cloud purchase
decisions than do
Cloud Market Maturity
Overall, those taking part in the study consider cloud computing a relatively immature service offering. When asked to identify the current level of cloud market maturity they placed only SaaS in the earliest stage of the growth level. Both IaaS and PaaS were positioned at the middle to upper level of market infancy (figure 3).
The placement of cloud as a whole solidly at the infancy level of maturity and SaaS in early growth has significant
implications for users and providers. In terms of the elements of maturity—innovation, market saturation, value to business, clarity of definition, clarity of roles, accountability and responsibility between users and providers, and the ability to extract value—cloud computing has a way to go before it delivers on promised results.
Because cloud is in its infancy, a clear understanding of what it is, outside of general definitions, does not yet exist. In spite of expectations that cloud will redefine relationships between technology and business units and consequently the role of the CIO will change, these outcomes remain in the category of future predictions—not yet reality. Evolution is still to occur with regard to cloud-related roles and responsibilities, accountabilities and responsibilities, relations between business and technology groups, and how information and information technology support the cloud strategy. These concepts are further explored in the portion of this report dealing with measures of confidence and optimism relative to cloud.
Figure 3—Cloud Services Market Maturity Stages
Study participants were asked to identify the point in the future when cloud would reach levels of growth, maturity and decline. Respondents could indicate that the service is already at a particular maturity level or estimate the number of years (from one to five or more) it would take for the service to reach the specific maturity level. Results are shown in figure 4.
Figure 4—Time for Market Maturity to Reach Growth and Maturity Levels SaaS
IaaS PaaS
Market Maturity Stages
Infancy Growth Maturity Decline
Mean 2.73 years Mean 3.02 years Mean 3.34 years SaaS IaaS PaaS SaaS IaaS PaaS Mean 1.18 years Mean 1.49 years Mean 1.7 years Growth Level Maturity Level 0% 24.1% 21.3% 21.3% 9.6% 23.7% 18.5% 17.3% 23.3% 16.9% 24.1% 6.8% 16.9% 30.5% 17.3% 26.5% 63.1% 16.1% 14.5% 3.6% 2.8% 52.4% 23.0% 15.9% 3.6% 5.2% 43.2% 29.6% 17.6% 5.6% 4.0% 20% 40% 60% 80% 100% 0% 20% 40% 60% 80% 100%
In each case, the time required to get to the level of maturity is less for SaaS than it is for IaaS or PaaS. As indicated in figure 4, participants estimated that IaaS and PaaS will not reach the growth stage for almost two years. Their estimates indicate that at least one year will elapse before SaaS will be solidly within the growth maturity level.
Innovation in the Cloud
Innovation should provide the foundation for enterprises as they explore different and more effective ways of using technology to expand the business and increase profits. For cloud computing to be truly disruptive, it must challenge how enterprises think about technology and information and how technology can be exploited to achieve better outcomes. Innovation is about using cloud to work differently, provide new information resources and capabilities for internal knowledge workers, and enable enterprises to strengthen relationships with customers and meet their needs in new and engaging ways. The overwhelming opinion among the 252 individuals who took part in this study is that there is a moderate level of innovation in the current cloud market (figure 5).
Forty-three percent selected that option, while 24 percent indicated that there are none or limited levels of innovation in the market and 33 percent considered the level of innovation in terms of products, services and business use as significant. Service providers feel the same: The majority perceived at least a moderate level of innovation by providers and users. Within the user community, 27 percent noted a significant amount of innovation by businesses, and almost 20 percent saw a significant level of innovation within the supplier market.
Figure 5—Level of Cloud Market Innovation
Cloud computing is both a commercial offering and a business enabler. From each market segment—customers, business line management, technology organizations and suppliers—can come different demands for innovation within the cloud market. From the survey, it appears that service and product developers have the greatest impact on innovation. When asked to identify who is currently driving cloud innovation, 39 percent of participants pointed to service and product developers as leading the charge (figure 6). The public and customers, line-of-business users, and IT organizations also appear to contribute to driving innovation, with only consultants and the analyst community seen as not having a significant impact. This is somewhat surprising because analysts typically influence market innovation by reporting leading market trends and highlighting significant areas for business performance improvement. In the same manner, consultants typically encourage innovation in enterprises by recommending practices that challenge existing behaviors, organizational structures and business solutions.
While service and
product developers
are seen as driving
cloud innovation,
it is the CIO and
IT management
who represent the
greatest influence
on innovation.
Level of Innovation Significant Moderate Limited None 42.9% 33.3% 21.4% 2.4%Figure 6—Groups Driving Cloud Innovation
Understanding that service and product developers are playing a significant role in driving cloud innovation provides only part of the answer to innovation. It is equally important to understand where the force encouraging this innovation is coming from and what desired outcome is expected. When asked about business demand for supplier innovation, 32 percent of study participants indicated at least a moderate demand by user organizations, while slightly more (39 percent) reported a significant level of demand.
To further explore the driving force for cloud innovation, survey takers were asked to rate several groups’ influence on cloud innovation on a scale from 0 (no influence) to 5 (significant influence). As illustrated in figure 7, the strongest influence originated from IT management and staff (mean score 3.84), followed by the CIO and senior business executives (mean score 3.36) and business unit management (mean score 3.18). These results are interesting because they seem to contradict a commonly held belief that business unit leaders are the driving force for cloud use and innovation while IT is sometimes left out of the decision-making process only to become involved after decisions are made and contracts signed. This survey indicates that technology organizations and the CIO significantly influence cloud innovation.
Figure 7—Mean Scores of Business Group Influence on Cloud Innovation
Based on the millions of words that have been written about what cloud computing can provide to enterprises and how it can enhance innovation, there are many expectations of cloud computing, which ultimately influence the direction and need for cloud innovation. Participants in the study were provided a list of potential outcomes and asked to indicate the extent to which each was achieved through the use of cloud computing (see table 3). These outcomes included:
• Gaining access to new technologies without having to invest in acquiring the technology • Providing new and engaging ways of working with and supporting customers
• Enhancing worker effectiveness and efficiency by providing new tools and services • Creating new ideas and bringing them to market more quickly
• Enabling better outcomes by providing best-in-class tools and capabilities
Experimenting with new technologies and providing new services to enhance worker effectiveness and efficiency share top ranking among the outcomes that cloud computing helps to achieve (mean score 3.58). These both appear to have a more internal enterprise focus than do other outcomes listed, such as using cloud to engage with customers or taking new ideas to the market. Gaining access to best-in-class tools and capabilities could be considered to have both an internal and an external focus.
Public and Customers Line-of-Business Users IT Organizations Service and Product Developers Consultants and Analyst Community
19.9% 13.1%
18.7%
39.0% 9.2%
Board and Executive Management Business Unit Management CIO and Senior Business Executives IT Management and Staff Business End Users
2.40 3.18
3.36 3.84 2.98
While experimenting with new technologies and providing new services to increase worker effectiveness and efficiency are ranked first, it is interesting to consider the strength of agreement with the statements. Since each question was presented on a scale of 0 to 5, a mean score of 3.58 represents only a moderate, less than significant, level of agreement. Perhaps cloud computing contributes more integrally to other outcomes that were not included in the study. Or, perhaps there is only a moderate feeling that cloud computing is playing a major role in achieving these outcomes. The standard deviation provides an indication of the consistency of responses. The standard deviation for both of the top-ranking options demonstrates a wide range of responses from those who participated in the study, indicating a lack of strong consensus. The moderate level of agreement and the spread of responses seem to support the idea that cloud computing is, at best, in the infancy level of market maturity. If cloud were a more mature offering, it would be clearer which outcomes are being supported by it. There would be a stronger level of agreement among respondents.
Table 3—Cloud Support for Business Goals
Goal Rank Mean Score
Experiment with new technologies 1 3.58
Provide new services to enhance worker effectiveness and efficiency 1 3.58
Experiment with new ways of engaging with customers 2 3.53
Take new ideas to market 3 3.43
Provide access to best-in-class tools and capabilities 4 3.25
Cloud computing provides opportunities to innovate for many types and sizes of enterprise. It seems logical that small and medium enterprises would adopt cloud to avoid the difficulties and expenses of building an IT infrastructure to manage the business and serve customers. Large enterprises can also benefit from cloud by taking advantage of opportunities to experiment with technologies without having to invest in their procurement and deployment. Survey participants believe that large enterprises (more than 1,000 employees) demand more product and service innovation than smaller enterprises and benefit more from it as well. Demand for and benefit from innovation seem to align with size, with large enterprises evidencing the most, then medium enterprises (100-999 employees), and finally small enterprises (fewer than 100 employees) evidencing the least (figure 8).
Figure 8—Market Segment Benefit and Demand for Innovation
Internal requirements
such as experimenting
with new technologies
and providing new
services to enhance
worker effectiveness
and efficiency
are primary
outcomes of cloud
computing adoption.
21.1% 13.2% 32.9% 38.4% 45.0% 48.4% Medium Enterprises 100-999 employees Small Enterprises 1-99 employees Large Enterprises 1,000+ employees 0% 20% 40% 60% 80%Benefit most from product
and service innovation
Demand greater product
Forces That Influence Innovation
The decision to adopt what could be considered a disruptive technology must address and resolve both encouraging and discouraging factors. While they are in their infancy, disruptive technologies may move more slowly toward adoption because of the unbalanced weight of perceived negative over positive factors and their impact on expected benefits. With maturity comes greater visibility of the positive aspects of the technology. Potential problems and limitations are minimized, solutions are found, and benefits take on greater importance in decision making.
There are many motivators that encourage enterprises to decide to innovate using cloud infrastructure, platform or software services. These motivators include the ability to better manage cost, improve customer service, meet internal and external demands, and leverage technology to enter new markets more quickly. However, there are also discouraging factors that could limit adoption. They include concerns for information security, legal and contractual complications, difficulties meeting regulatory requirements, and fear that suppliers may not be able to deliver on promised services.
Study participants were provided a list of 11 factors that are tightly connected to what cloud is and what it promises and asked to rate (on a scale of 0, no influence, to 5, significant influence) how well each positively influences the decision to adopt cloud innovation. Participants were also asked to review a provided list of 11 commonly held concerns related to cloud computing and rate (on the same 0 to 5 scale) the degree to which they may negatively influence an enterprise’s decision to adopt and use cloud to innovate. Table 4 presents the mean score and ranking for each factor.
Among the limiting factors, security and data ownership (both related to the ability to protect information assets) and factors related to legal issues, contracts and regulatory compliance topped the list. The fifth factor, information assurance, is significant because it is related to the transparency of cloud offerings and management’s ability to gain comfort that information is protected to the required degree. Among the factors considered to most influence cloud adoption and innovation areas which could be considered as most related to innovation, access to new technologies, meeting changing customer demand, use of technical resources, and entering new markets were the lowest items in the ranking suggesting that time tested basic business issues such as maintaining cost, efficiency and productivity are most significant in forming decisions to adopt cloud solutions.
When a disruptive technology such as cloud computing is first introduced, factors that limit adoption can provide a strong negative effect on the market. As the product or technology matures, evolves and is further clarified, it gains wider acceptance, use is encouraged and greater innovation follows. Cloud will surely follow this same path, ultimately leading to offerings that truly disrupt established ways of using and deploying technology and leveraging information assets. As illustrated in table 4, the mean scores for the factors that encourage and limit adoption have almost reached equilibrium although limitations are still a larger concern. While no previous study exists to provide comparative data on positive and negative influences, the nearly equal mean scores of the opposing factors support the notion that limiting factors may no longer hold enterprises back from adopting cloud for business innovation.
An imbalance in
perceived risk over
promised benefits
influences cloud
adoption decisions.
Table 4—Positive and Negative Influences on Cloud Adoption and Innovation Positive Influence on Cloud
Adoption/Innovation Mean Score Rank Negative Influence on Cloud Adoption/Innovation Mean Score Rank
Cost management 3.77 1 Information security 4.22 1
Agility 3.75 2 Data ownership/custodian
responsibilities 4.12 2
Time to market 3.73 3 Legal and contractual issues 4.04 3
Efficiency 3.65 4 Regulatory compliance 4.01 4
Productivity 3.61 5 Information assurance 3.77 5
Business unit demand 3.55 6 Longevity of suppliers 3.44 6
Resilience 3.52 7 Contract lock-in 3.42 7
New technology 3.46 8 Performance standards 3.30 8
Customer demand 3.42 9 Disaster recovery/business
continuity 3.25 9
Technical resources 3.37 10 Performance monitoring 3.21 10
New markets 3.33 11 Technology stability 3.10 11
Summary Mean 3.56 Summary Mean 3.62
The 11 factors that positively influence cloud adoption and innovation support growth or process enhancement. The study participants rated the factors in the two general categories as almost equally important in influencing cloud adoption and innovation. Table 5 lists these factors and provides their ranking and position in supporting business growth or process enhancement.
Table 5—Positive Influence Factors for Business Growth and Process Enablement
Business Growth Influence Mean Score Rank Enhancement InfluenceProcess Mean Score Rank
Agility 3.75 1 Cost management 3.77 1
Time to market 3.73 2 Efficiency 3.65 2
Business unit demand 3.55 3 Productivity 3.61 3
New technology 3.46 4 Resilience 3.52 4
Customer demand 3.42 5 Technical resources 3.37 5
New markets 3.33 6
Summary Mean 3.54 Summary Mean 3.59
Users and providers hold different opinions of the 11 factors that negatively influence cloud adoption and use (table 6). Users evidence a more cautionary perspective than providers, as illustrated by a comparison of the mean scores. Although the scores of the users (overall mean score 3.76) and the providers (overall mean score 3.51) are not widely divergent, they do reflect a difference in perspective. Most notable in this regard is the result relating to disaster recovery and business continuity; users reported a more negative perspective, ranking it as the eighth most limiting factor as compared to the providers, who ranked it tenth. Users also saw contract lock-in as being a more limiting factor. Not surprisingly, providers saw this as a less significant negative influence on cloud adoption.
Table 6—User and Provider Perspectives on Negative Influences on Cloud Adoption and Innovation Negative Influence on Cloud Adoption/Innovation
User Perspective Provider Perspective Mean Score Rank Mean Score Rank
Information security 4.23 1 4.21 1
Data ownership/custodian responsibilities 4.18 2 4.09 2
Regulatory compliance 4.05 3 3.99 4
Legal and contractual issues 4.04 4 4.05 3
Information assurance 3.87 5 3.73 5
Contract lock-in 3.50 6 3.39 7
Longevity of suppliers 3.50 7 3.41 6
Disaster recovery/business continuity 3.47 8 3.16 10
Performance standards 3.40 9 3.25 8
Performance monitoring 3.32 10 3.16 9
Technology stability 3.14 11 3.09 11
Summary Means 3.76 3.51
Confidence and Optimism in the Cloud Computing Market
Cloud market maturity is a reflection or outcome of many things:• User and provider perspectives on the state of cloud computing • Innovation by those who deliver services and those who use them • How clearly cloud computing is defined and understood
• How roles and responsibilities are defined and the extent to which they are accepted within the market • Forces that limit adoption and use
• Evolving confidence that cloud services will enable new relationships and have a positive impact on enterprises
Confidence, as a current measure, must be supported by optimism for the future. Without a belief that current limitations can be overcome and concerns will be resolved, cloud computing will not be able to progress into levels of maturity at which exceptional value is not only promised, but also delivered.
To gain insight into cloud confidence and optimism, three series of statements about cloud computing features and issues were presented to the study participants and they were asked to rate their level of agreement with each (on a scale from 0, no agreement, to 5, full agreement). The higher the rating, the greater the respondent’s level of confidence that cloud issues are currently being addressed.
The first series of statements addressed important service-related issues such as value capture, how risk is addressed, role definition and acceptance, the extent to which requirements are met, and how effectively performance is monitored by users and providers. Similar series of statements related to strategy and problem resolution were also presented to survey participants for rating.
The responses to the three series of statements were grouped into higher-level descriptors and rolled up into a summary confidence barometer. In addition, survey participants were asked to rate their level of confidence that each service, strategy and problem resolution issue would be addressed in the future. This future-oriented measure is termed “optimism” (figure 9).
Figure 9—Mean Scores of Cloud Confidence and Optimism Components
The responses revealed that there is a guarded level of current confidence that cloud can deliver on promises and issues and that concerns are being addressed. There is greater optimism that issues and concerns will be addressed and resolved in the future.
Confidence Barometer
The market is moderately confident that cloud services are meeting service and strategy expectations and problems are being addressed. The confidence barometer brings together 60 different measures grouped into the three categories (service, strategy and problem resolution). As indicated in table 7, the level of confidence on the 0 (no confidence) to 5 (full confidence) scale hovers near the midpoint for each of the three indicator measures and overall.
Table 7—Confidence Barometer Summary Indicators
Confidence Indicator Mean Score
Service Confidence 2.19
Strategy Confidence 3.04
Problem Resolution Confidence 2.38
Confidence Barometer 2.54
Service Confidence
The first six elements incorporated into the confidence barometer are drawn from 16 statements about cloud computing service features and issues, about which survey participants were asked to indicate their degree of agreement (on a scale of 0, no agreement, to 5, full agreement). Based on the way the statements were written, a higher agreement rating implies a higher degree of confidence that the issue is currently being addressed. The statements touched on essential elements of cloud services, including:
• The perceived value of cloud to internal business audiences • How cloud risk is addressed
• Role definitions between suppliers and users • Cloud requirements and service level agreements • The clarity of cloud concept in enterprises • Performance monitoring
Confidence Barometer Optimism Barometer
Service Confidence
▪
Value▪
Risk▪
Role Definition▪
Requirements Satisfaction▪
Clarity of Concept▪
Performance Monitoring▪
Solution Integration▪
Continuity/Availability▪
Performance▪
Problem Management▪
Supplier Relations▪
Security/Assurance▪
Regulation and Legislation▪
Contract Issues▪
Strategy▪
Innovation▪
Finance▪
Alignment▪
Customer Support▪
Opportunity Strategy ConfidenceProblem Resolution Confidence 2.54 Current indicator of cloud market confidence 3.47 Current prediction of optimism in the cloud market
The overall confidence level for the six service elements is 2.19. The service elements, their mean scores and their rankings are presented in table 8.
Table 8—Service Components in the Confidence Barometer
Service Component Mean Score Rank
Value 2.45 1 Risk 2.22 2 Role definition 2.16 3 Requirements 2.12 4 Clarity of concept 2.08 5 Performance monitoring 1.95 6 Overall 2.19 Clarity of Concept
Having a clear and commonly understood definition of cloud computing is fundamental to being able to benefit from cloud service offerings. While the clarity of cloud concepts is not the highest ranking among the six service components, it is addressed first since the other service components are dependent on the clarity of the cloud computing concept in the market.
For cloud computing to gain wider acceptance and fully enter into the growth stage of market maturity, cloud concepts must be clearly understood and differentiated from other outsourcing arrangements. If cloud computing is perceived as just a newer version of outsourcing, then the unique benefit that has been ascribed to cloud cannot be achieved. Clarity of concept, which has an overall mean score of 2.08, includes measures relating to cloud as a technology being clearly defined and understood, and cloud products and services being clearly distinguished from outsourced offerings.
Responses indicate that cloud is not currently distinguished from outsourcing in the market, nor is cloud in general clearly defined and understood (table 9). Differentiation from outsourcing seems to be especially misunderstood; that statement ranked 11th among the 16 service-related statements presented for rating.
Table 9—Clarity of Concept Components in the Confidence Barometer
Clarity of Concept Component Mean Score
Cloud computing as a technology is clearly defined and understood. 2.12
Cloud products and services are clearly distinguished from other outsourced offerings. 2.05
Overall 2.08 Value
If having a common definition of cloud presents a challenge, then it would seem even more difficult to foster
understanding of the value cloud brings. However, understanding the value of cloud to the enterprise received the highest confidence rating among the six service confidence measures (see table 8). In this case, though, top ranking does not equate to a high score; its mean score was only 2.45, under the midpoint on the confidence scale.
The value category includes measures of clarity on the value of cloud computing by executive management, business unit management, and the CIO and technology management. In a previous section of this publication it was reported that cloud innovation is led by the technology management and staff and that the CIO and senior business executives play a secondary role. Therefore, it could reasonably be expected that the CIO and technology management in enterprises would better understand the value that cloud brings. In fact, of the three value indicators (table 10), the CIO and technology management group has a mean score of 3.10 on a scale of 0 to 5, indicating strong consensus among participants. Between the other two groups, participants believe that business unit leaders (mean score 2.23) outstrip executive management (mean score 2.04) in their understanding of the value of cloud. The relatively low score for executive management indicates a troubling consensus that there is a potential deficit in understanding of cloud value within the very group that needs that understanding in order for their enterprises to capture the full benefits. If cloud is truly a disruptive technology, then the board and executive management must understand how to exploit its transformative capabilities.
Table 10—Value Components in the Confidence Barometer
Value Component Mean Score
The value of cloud to the business is clearly understood by the CIO and technology management. 3.10 The value of cloud to the business is clearly understood by business unit management. 2.23
The value of cloud to the business is clearly understood by executive management. 2.04
Overall 2.45 Risk
A deficit in understanding the value cloud promises implies a difficulty in properly addressing the risk cloud introduces. Three risk-related statements were included in the survey for participant rating:
• Treating cloud-related business risk as part of enterprise risk management • Addressing technical cloud risk as part of business unit risk
• Addressing technical cloud risk as part of technical risk
The survey responses indicate that cloud computing is most often addressed as a technology-related risk (table 11). This may be consistent with leadership in cloud and a clearer understanding of the value of cloud residing within the technology organization. The value of cloud and risk related to cloud can be considered two sides of the same coin because taking a risk is required for enterprises to receive value.
There is not so much agreement that cloud risk should be addressed as a business risk and even less that cloud should be addressed as part of the enterprise risk program. Treating cloud risk as a technology risk—without considering the risk to the business unit or to the enterprise—demonstrates the narrow thinking many enterprises display around cloud computing. If cloud is addressed only as a technology, then the true value that cloud can bring will be missed and opportunities for true innovation lost. More flexible thinking about cloud is needed enterprisewide, to understand what it is, what value it brings, and what risk is associated with new ways of managing and using information and information technology. From an enterprise view, the board needs to develop a firm understanding of cloud, articulate a vision of cloud benefits, and communicate risk down into business units and technology departments.
Table 11—Risk Components in the Confidence Barometer
Risk Component Mean Score
Technical risk relative to cloud computing is considered a part of technical risk management. 2.71 Business risk relative to cloud computing is considered as part of enterprise risk management. 2.30 Technical risk relative to cloud computing is considered as part of business unit risk management. 2.25 Board and executive management make business decisions concerning cloud computing based on a
realistic understanding of risk. 1.65
Overall 2.22 Role Definition
The clear assignment and acceptance of roles and responsibilities within enterprises and with service providers is essential. Yet, for cloud computing, there is little agreement that IT, supplier, user enterprises, and business unit roles and responsibilities are clearly defined and coordinated (table 12). The failure to define where responsibility and accountability are placed provides opportunities for confusion under the best conditions. A crisis can result from even simple incidents when
responsibilities are not clearly understood. This is a problem between suppliers and users, but it is even more significant when IT and business units have not come to an agreement as to who is responsible for aspects of cloud relationship and solution management.
Table 12—Role Definition Components in the Confidence Barometer
Role Definition Component Mean Score
IT staff roles and responsibilities are clearly defined and coordinated. 2.28
Supplier and user roles and responsibilities are clearly defined and coordinated. 2.12
Roles and responsibilities between business units and IT are clearly defined and coordinated. 2.08
Overall 2.16 Requirements
Business requirements need to be identified and incorporated into contracts and service level agreements. Both of these concepts were addressed within the survey. For the statement on how well business and technical requirements are incorporated into contracts, responses indicate inadequate incorporation of requirements into agreements (table 13). The study did not differentiate between business requirements and technical requirements in the statement regarding contracts. However, it may be assumed—based on the deeper understanding of cloud by the CIO and technology management and the predilection for treating cloud risk as a technical issue—that technical requirements are better understood than business requirements. Supporting this is the participants’ response to the statement that service level requirements are clearly defined. That statement’s mean score is 2.23, a higher level of agreement than for contracts, at a mean score of 2.02, but hardly a resounding vote of confidence that technical requirements are clearly understood or incorporated in some manner in service level agreements. Service level agreements are the basis for describing and enforcing user expectations relative to cloud, documenting what providers will offer, and enforcing the terms of the user-provider agreement. If business and technical requirements are not well documented and service level agreements are not well defined, then the basis of the relationship between providers and users may be in peril.
Table 13—Requirements Components in the Confidence Barometer
Requirements Component Mean Score
Service level requirements are clearly defined. 2.23
Business and technical requirements are clearly defined and incorporated into contracts. 2.02
Overall 2.12 Performance Monitoring
Of the 16 cloud service indicators included in the study, the items related to performance monitoring ranked lowest in terms of agreement. Yet one item—that service providers effectively monitor and report against service level requirements—is an essential part of forming a working user-provider relationship. Its low rating (mean score 2.02) by the participants indicates a troublingly low degree of confidence that providers effectively monitor performance against service level requirements. Agreement with another statement—that users monitor provider performance against service level agreements—is even lower (1.88). The overall mean score is 1.95, the lowest among the six service-specific items (table 14). This indicates a potentially serious problem for both providers and users since performance monitoring is an essential part of cloud service effectiveness.
Table 14—Performance Monitoring Components in the Confidence Barometer
Performance Monitoring Component Mean Score
Service providers effectively monitor and report against service level requirements. 2.02
Users monitor provider performance against service level agreements. 1.88
Overall 1.95 Combined, these service-specific measures present a significant indicator of the level of maturity within the cloud computing market. The maturing of the cloud market is dependent on several factors:
• The clarity of cloud concepts
• An understanding of roles and responsibilities
• An appreciation for the value that cloud can bring and clarity on how risk is addressed on an enterprise level • Effective documentation of expectations in agreements
Based on the less-than-robust confidence levels assigned to these service factors by survey participants, cloud computing has to evolve significantly before it can reach a higher level of maturity. The failures to define cloud, understand value, address risk, document requirements and monitor performance are characteristic of a new product entry into a market. Until these issues are addressed, cloud cannot move to the level of general acceptance that accrues to the growth level of market maturity.
Strategy Confidence
The second component of the confidence barometer, demonstrating strategy confidence, includes 16 items combined into six measures indicating the extent that cloud meets expectations concerning strategy alignment, innovation, financial considerations, business and IT alignment, customer satisfaction and opportunity achievement (table 15).
Table 15—Strategy Components in the Confidence Barometer
Strategy Component Mean Score Rank
Enterprise strategy 3.16 1 Innovation 3.05 2 Finance 3.05 2 Alignment 3.01 3 Customer 2.92 4 Opportunity 2.82 5 Overall 3.03 Enterprise Strategy
Strategy in relation to meeting expectations is a combination of general and specific measures: cloud’s ability to support the business strategy (general) and its ability to bring new applications to market more quickly (specific). The more general measure— the ability to support the business strategy—received mild consensus among study participants, scoring a 3.08 on the 0 to 5 scale, indicating that respondents are hovering between feeling that cloud only minimally meets expectations and it significantly meets expectations (table 16). The more specific indicator of strategy success—moving new applications to market more quickly— received a slightly more positive mean score (3.23). This would seem to indicate that enterprises are achieving strategy success to a greater extent in leveraging cloud for new application development and bringing new applications to market sooner. This question ranked second among the 16 general strategy confidence measures for all survey takers.
The responses of users and suppliers were about the same, supporting the industrywide consensus that cloud is helping enterprises to introduce new applications more quickly, an important component of what cloud promises.
Table 16—Enterprise Strategy Components in the Confidence Barometer
Enterprise Strategy Component Mean Score
Bring new applications to market faster 3.23
Support the business strategy 3.08
Overall 3.16 It might be expected that small enterprises would be more inclined than large enterprises to leverage cloud to provide applications for internal use and customer engagement, and the survey results support this expectation (table 17). Bringing new applications to market ranks second for enterprises with fewer than 100 employees (mean score 3.34) and fourth for enterprises with more than 5,000 employees (mean score 3.17). It is interesting to note there was less consensus among study participants that midsize enterprises (100 to 4,999 employees) can leverage cloud for bringing applications to market more quickly. This middle group of enterprises ranks this element ninth, with a mean score of 3.23.
Table 17—Strategy Components for Large and Small Enterprises in the Confidence Barometer Strategy Component Small Enterprise Mean Score Large Enterprise Mean Score
Bring new applications to market faster 3.34 3.17