Systematic assessment of cancer missense mutation
clustering in protein structures
Atanas Kamburov, Michael Lawrence, Paz Polak, Ignaty Leshchiner, Kasper Lage, Todd R. Golub, Eric S. Lander, Gad Getz
Supplemental Methods
Collapsing consecutive mutated residues
To examine the effect of consecutive mutated residues on CLUMPS results, we implemented
a variant of CLUMPS where two or more mutated residues, which were consecutive in the
protein sequence, were combined to a single "meta-residue". The 3-D location of the centroid
of the new meta-residue [used for Euclidean distance measurements to other mutated (meta-)
residues] was calculated based on the 3-D locations of the individual member residues and
also depended linearly on their mutational recurrence. For example, if both residues P[k] and
P[k+1] of protein P are found mutated and P[k] is mutated much more frequently than P[k+1],
then the centroid of the new meta-residue P[k:k+1] will be closer to the centroid of P[k] than to
the centroid of P[k+1]. Unlike in the original CLUMPS implementation, (meta-) residues were
not allowed to be immediately next to each other in the protein sequence during the
permutations.
Comparison of methods for cancer gene identification
Per-gene
p
-values calculated with MutSig and its components MutSig-CL, MutSig-FN and
MutSig-CV were obtained from the original PanCancer study [1]. To enable comparison of the
per-gene
p
-values calculated with these methods with the CLUMPS
p
-values (calculated per
structure), we considered the smallest CLUMPS
p
-value of the representative structures for
each protein
Protein interaction interfaces
Information about human protein residues forming interaction interfaces with other human
proteins, small molecule/ion ligands, DNA or RNA (based on co-complex structures from PDB)
was obtained from the PDBsum database [2] on 27.07.2014. All residues of a protein
predicted by PDBsum to be involved in any type of contact (e.g., hydrogen or disulphide
bonds or non-bonded contacts) with the interaction partner were considered interface
residues. Only interfaces with at least one mutation were analyzed. In cases where multiple
co-complex structures were available for a given pair of interactors, we selected the structure
maximizing interface size and sequence coverage of the protein interactor(s), as well as the
number of mutations at the interface. As expected, factoring the number of mutations in
interaction interfaces into the selection process and especially restricting the analysis to
interfaces with at least one observed mutation led to some inflation in a Q-Q plot (SI Appendix,
Fig. S12); however, we aimed to avoid missing interesting biological interactions due to
false-negative contact residue predictions in PDBsum. Mutually similar (in terms of interface
residues) protein-ligand interfaces were grouped together and from each group, only one
representative interface was analyzed (i.e., the one comprising most residues). This was
done to avoid testing separately interfaces like KRAS-GTP, KRAS-GDP, KRAS-inhibitor, etc.
In the case of protein-protein interactions, we focused only on heteromers since for many
homomeric co-complex structures, it is unclear whether the corresponding protein forms
oligomers in solution or if the observed residue contacts are attributable only to the way the
protein was crystallized ("crystal-packing interactions") [3]. Moreover, in many instances one
of the interactors was not annotated with a UniProt identifier in PDB/SIFTS despite the
existence of a non-standard protein name annotation. To recover missing UniProt annotations,
we aligned all non-annotated sequences that were found in protein complexes with human
proteins against UniProt/SwissProt-human using WU-BLAST
(http://www.ebi.ac.uk/Tools/sss/wublast/). A given query sequence was annotated with the
UniProt reference identifier corresponding to the smallest BLASTP alignment
p
-value but only
if at least 90% of the query was aligned to the reference with at least 90% sequence identity.
Protein/RNA expression and copy number data
Matched TCGA RPPA, RNAseq and copy number data from endometrial [4] and colorectal
tumor samples [5] (used for quantifying the expression of SPOP substrates and CCNE1,
respectively) were downloaded from the Broad GDAC portal (http://gdac.broadinstitute.org/).
The samples were divided into several groups according to SPOP/FBXW7 mutation and
substrate copy number statuses (SI Appendix, Fig. S6 B and Main Text Fig. 5). Before
plotting, protein and RNA expression levels in each sample were normalized by subtracting
the median and dividing by the standard deviation of the corresponding expression level
distributions of samples with no SPOP/FBXW7 somatic mutations and no substrate copy
number changes. A gene was considered amplified/deleted if it was in a genomic segment,
supported by at least 3 SNP probes, with mean above 0.3/below -0.3 in the copy number data.
References
1. Lawrence MS et al. (2014) Discovery and saturation analysis of cancer genes across 21
tumour types. Nature 505:495-501.
2. de Beer TAP, Berka K, Thornton JM, Laskowski RA (2014) PDBsum additions. Nucleic
Acids Res. 42:D292-296.
3. Janin J (1997) Specific versus non-specific contacts in protein crystals. Nat. Struct. Biol.
4:973-974.
4. The Cancer Genome Atlas Network (2013) Integrated genomic characterization of
endometrial carcinoma. Nature 497:67-73.
5. The Cancer Genome Atlas Network (2012) Comprehensive molecular characterization of
human colon and rectal cancer. Nature 487:330-337.
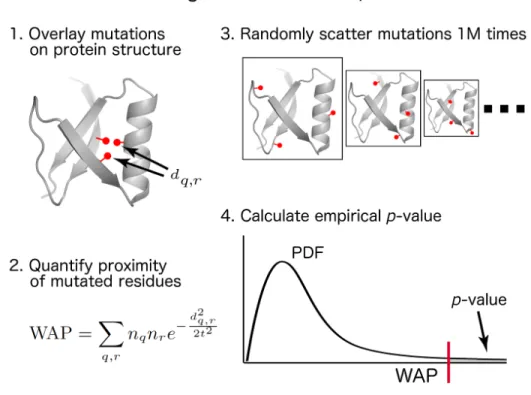
Figure S1. Overview of our CLUMPS approach for identifying significant mutation clustering in protein structures. WAP: weighted average proximity score; dq,r: spatial (Euclidean) distance between the
centroids of residues q and r ; nq and nr: normalized number of samples with missense mutations
impacting residues q and r, respectively; t: “soft” distance threshold (see Materials and Methods in the Main Text for details).
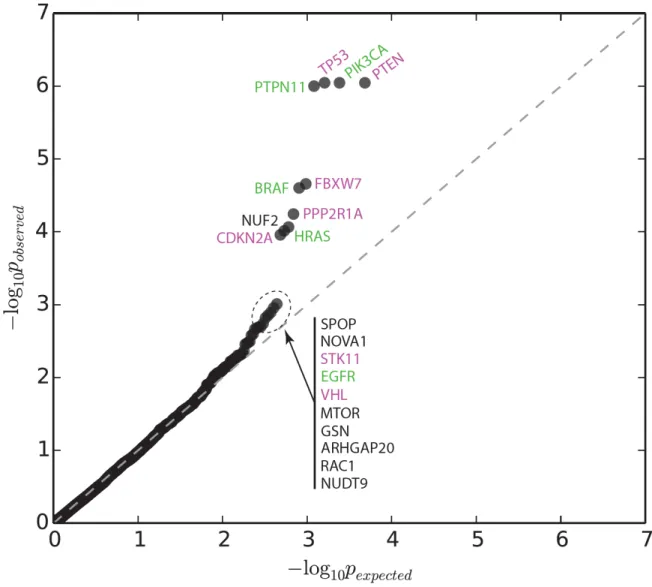
Figure S2: Quantile-quantile plot of empirical p-values calculated with CLUMPS for all tested
(representative) protein structures (Dataset 1). Significant and near-significant protein structures are labeled; purple label color indicates tumor suppressors and green color indicates oncoproteins.
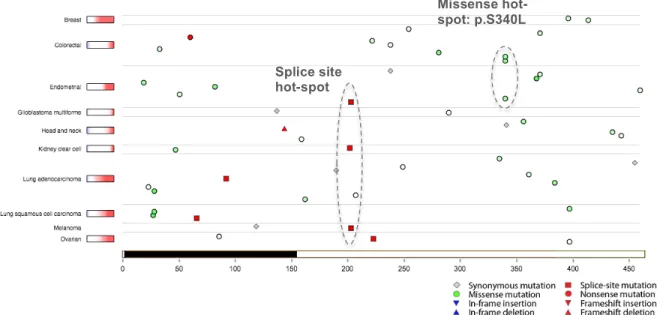
Figure S3: TumorPortal (http://tumorportal.org) screenshot showing the positions of mutations in NUF2. Missense mutations are shown as green circles, with color intensity scaling with evolutionary conservation. The portion of the NUF2 protein sequence covered by the structure shown in Fig. 3 (Main Text) is highlighted in black.
1 Missense hot-spot: p.S340L 2 Splice site hot-spot
A
B
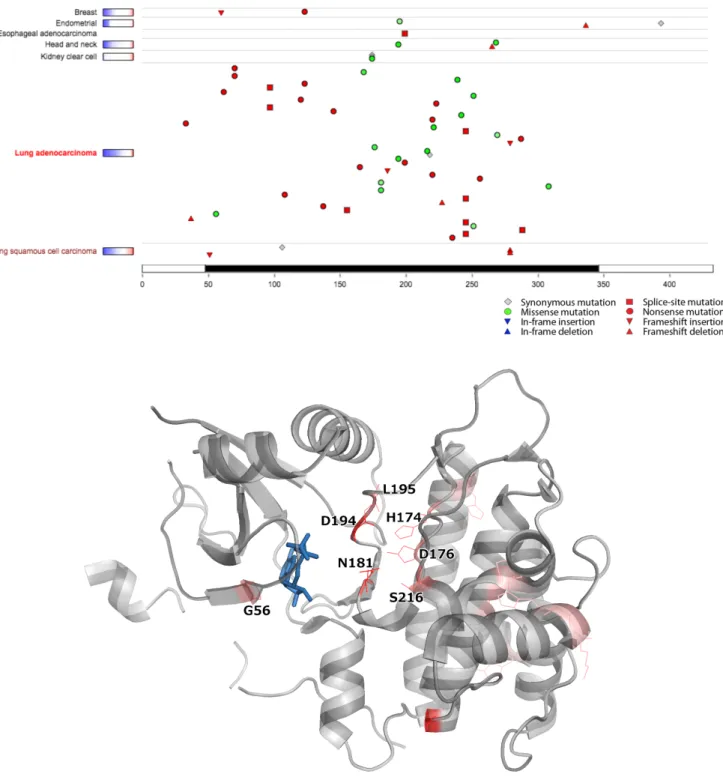
Figure S4: Several non-recurrent mutations in STK11 impact residues at the active site, forming a spatial (3-D) cluster. A) TumorPortal (http://tumorportal.org) screenshot showing the positions of mutations in the linear STK11 protein sequence. Missense mutations are shown as green circles, with color intensity scaling with evolutionary conservation. B) Structure of STK11 (PDB: 2WTK) with mutated residues shown as red lines. Mutations that cluster together at the active site are labeled; p.N181 and p.D194 were found mutated in two samples each, the rest of the labeled residues – in one sample each. Shown in blue is phosphoaminophosphonic acid-adenylate ester, an analog of
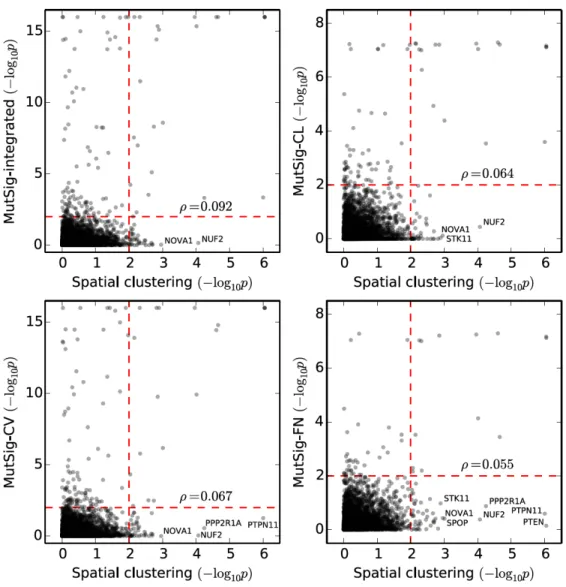
Figure S5: Comparison of CLUMPS p-values (denoted “Spatial clustering”) against p-values calculated for the corresponding genes using the MutSig suite of tools for detecting cancer genes. MutSig provides three p-values corresponding to three different statistical tests (MutSig-CL: linear clustering of mutations; MutSig-CV: overall mutation burden, taking into account covariates like replication timing and expression level; and MutSig-FN: the relative frequency of mutations at evolutionarily conserved and likely functional DNA bases), as well as a combined p-value (MutSig-integrated). The plots correspond to a comparison of each of these four MutSig p-values against the CLUMPS p-value for the corresponding gene (the most significant CLUMPS p-value is considered if there are multiple representative protein structures). Spearman’s correlation coefficient ρ is provided in each figure. Dashed red lines correspond to nominal significance thresholds (p=0.01). Genes detected as significant or near-significant with CLUMPS, but not with MutSig or its separate components, are labeled.
A
B
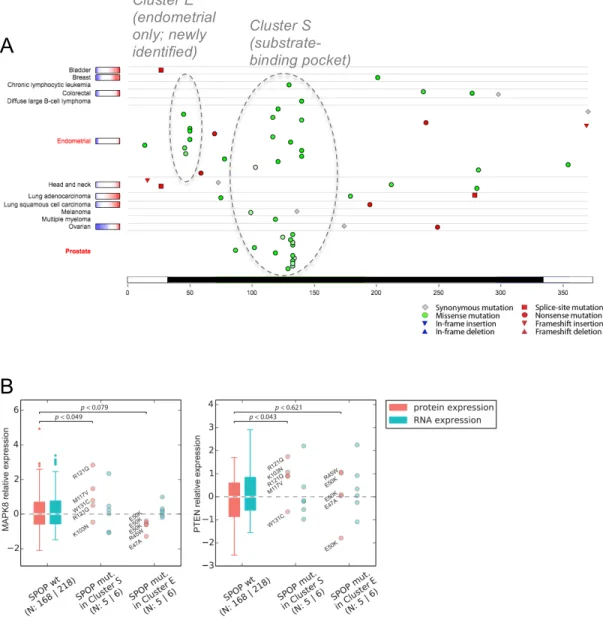
Figure S6: Clusters of endometrial and prostate cancer mutations in SPOP. A) TumorPortal
(http://tumorportal.org) screenshot showing the positions of mutations in SPOP. Missense mutations
are shown as green circles, whose color intensity scales with evolutionary conservation. The portion of the SPOP protein sequence covered by the structure shown in Fig. 4 (Main Text) is highlighted in black. B) Protein and RNA levels of the SPOP substrates MAPK8 and PTEN in endometrial tumors with mutations from both Clusters E and S compared to SPOP-wildtype endometrial tumors (protein and RNA expression levels correspond to RPPA and RNAseq measurements by TCGA, respectively).
Cluster E (endometrial only; newly identified) Cluster S (substrate-binding pocket)
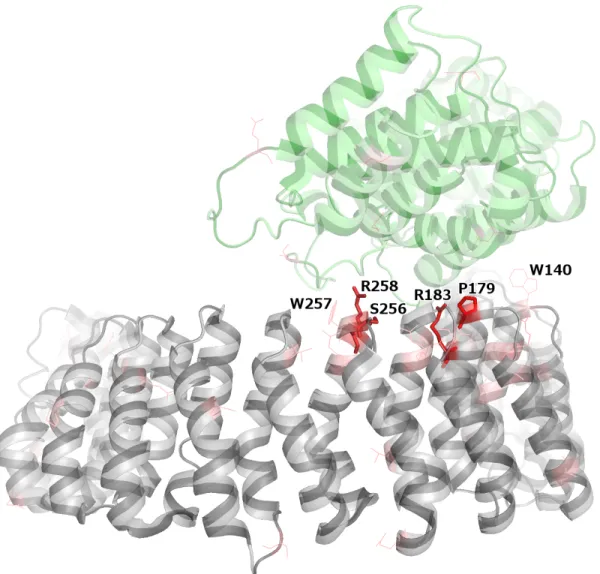
Figure S7: PPP2R1A (grey) bound to PPP2R5C (green) (PDB: 2NYL). Mutated residues in both proteins are highlighted in red, with color intensity scaling with the number of samples harboring missense mutations impacting the corresponding residue. Recurrent mutations (≥3 samples) are shown as sticks, non-recurrent mutations – as thin lines. PPP2R1A mutations at the interface are labeled.
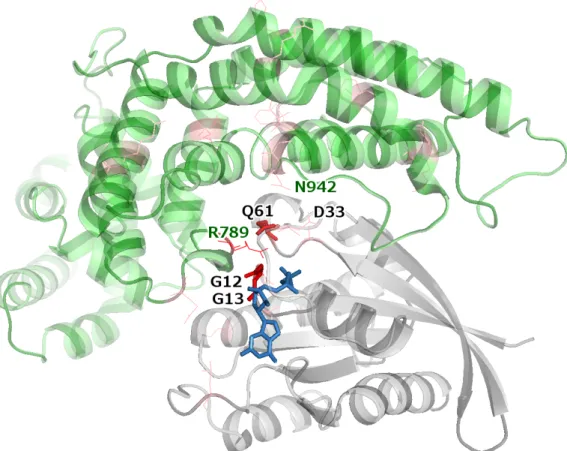
Figure S8: HRAS (grey) bound to RASA1 (green) (PDB: 1WQ1). Mutations in both proteins are colored in red, with color intensity scaling with recurrence. Recurrent mutations (≥3 samples) are shown as sticks, non-recurrent mutations – as thin lines. Mutated interface residues in both proteins are labeled (black label: HRAS residues, green label: RASA1 residues).
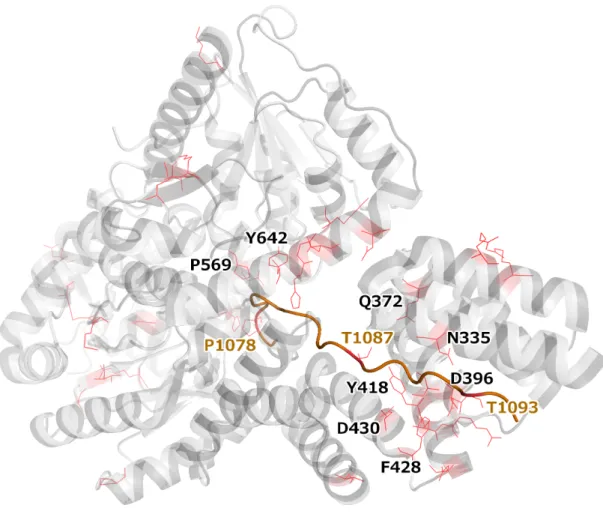
Figure S9: OGT (grey) bound to an HCFC1 fragment (orange) (PDB: 4N3B). Residues in both proteins that are impacted by missense mutations are highlighted in red; those at the common interaction interface are labeled (black label: OGT residues, brown label: HCFC1 residues).
Figure S10: Distribution of the relative reference (UniProt) protein sequence coverage of all 3-D structures of proteins used in the full CLUMPS analysis (prior to selecting the representative structures per protein). SI Appendix, Fig S12 shows a corresponding distribution after the selection of
Figure S11: Protein sequence coverage by individual PDB structures is depicted for the top 20 proteins that showed significant or near-significant 3-D mutation clustering. The proteins are ordered on the x-axis and the length of each protein sequence is normalized to unity. The y-axis shows – log10(CLUMPS p-value). Each blue line corresponds to a PDB structure/chain; its x-dimensions show
the relative coverage of the protein sequence and its y-dimension shows the mutation clustering p -value for that structure/chain. Many overlapping lines are shown as a single thicker line. Red lines correspond to the structure selected by our greedy search algorithm (see Materials and Methods in the Main text).
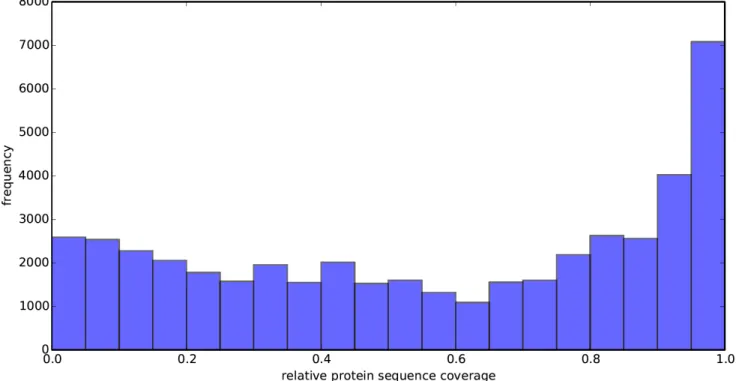
Figure S12: Distribution of the overall relative reference (UniProt) protein sequence coverage (= total residues covered by all selected 3D structures for a protein over the number of residues in the protein) for all proteins used in the full CLUMPS analysis.
A
B
Figure S13: Plots of functions used for calculating the Weighted Average Proximity (WAP) score:
A)
𝑓
𝑑
;
𝑡
=
6
=
𝑒
!!!,! ! !!!Figure S14: Comparison of p-values obtained with the original implementation of CLUMPS, which weights mutated residues according to recurrence (see Materials and Methods) (black dots) against corresponding p-values obtained with a version of CLUMPS that weights all mutated residues equally (red stars). The top scoring 300 structures from Dataset 1 are shown.
Figure S15: Quantile-quantile plot of empirical p-values corresponding to mutation enrichment in interaction interfaces. Red dots represent significant interfaces (q≤0.1; see Table 2 in the Main Text and Datasets 8, 10, 11, 12). The apparent slight inflation is due to the pre-filtering of interfaces to select only those with at least one mutation and because the interface selection strategy favors interfaces with more mutations among different PDB instances of similar interfaces in order to increase sensitivity (see Materials and Methods in the Main Text).