ISSN 2307-7743 http://scienceasia.asia
_______________
2010 Mathematics Subject Classification: 00A71, 92D25.
Key words and phrases: Population growth; Solid waste generation; Treatment; Deterministic model; Stability analysis; Numerical simulation.
© 2014 Science Asia 1 / 14
Computational Dynamics of Solid Waste Generation and Treatment in the Presence of Population Growth
J. P. SENZIGE, O.D. MAKINDE, K. NJAU, Y. NKANSAH-GYEKYE
Abstract. Solid waste management is a global challenge and the situation is worse in urban areas of the developing countries where, in most cases, there are no data of how much solid waste is generated over a specific period of time. Worse still, solid waste continues to pile up as population continues to grow and authorities in developing countries are increasingly becoming unable to manage the waste. This calls for a means for anticipating the solid waste to be generated in order for the authorities to take proactive actions in managing the solid waste. In this paper, a deterministic compartmental mathematical model that can be used to predict the amount of solid waste generation and treatment needed with population growth as major factor is proposed and analysed qualitatively using the stability theory of differential equations. Numerical simulation is performed to validate the qualitative results.
1. Introduction
The history of solid waste generation dates back to ancient times. Humans began producing solid waste when they first settled down into small non-nomadic communities at around 10,000 BC (Worrel and Vesilind, 2012). These small communities managed to bury solid waste generated just outside their settlements or disposed them in nearby rivers and water bodies (Marshall and Farahbakhsh, 2013, Seadon, 2006) as, at such times, most of the solid waste produced was essentially organic. But as the small communities evolved into large and sophisticated communities, the solid waste produced also increased, both in quantity and type. Thus burying and disposing then in rivers were no longer feasible options and hence the need for solid waste management. Maribel Cruz defines solid waste management as an interrelated system of appropriate technologies and mechanisms involved in the generation, collection, storage and processing, transfer and transport, and disposal of solid waste at the lowest possible cost and risk to health of the people and their environment.
Although solid waste management is an important environmental challenge the world over, the problem is bigger in the developing world (Guerrero et al, 2013, Marshal and Farahbakhsh, 2013, Joseph, 2002; ADB, 2002; Achankeng, 2003) where the waste produced by burgeoning cities is overwhelming local authorities and national governments alike (Tacoli, 2012; Yousif and Scott, 2007). As a result, the uncollected waste, which is often mixed with human and animal excreta, is dumped indiscriminately along the streets, in river valleys and in drains, so contributing to flooding, breeding of insect and rodent vectors and the spread of diseases (UNEP-IETC, 1996). We all know of the cases of diarrhoea and cholera that have struck and are still striking most of the cities and towns in developing countries. Even costs associated with malaria treatment could be reduced if we could reduce breeding places for mosquitoes by keeping our surroundings clean.
Institutional weaknesses, lack of financial resources, improper choice of technology and public apathy (Kaare, 2002; Manga et al., 2008; Oosterveer and Van Vliet, 2010; Okot-Okumu and Nyenje, 2011) are normally cited as major setbacks to proper solid waste management. Rapid urbanisation (Yhdego, 1995; Kyessi and Mwakalinga, 2002, Gawaikar and Deshpande, 2006, Marshal and Farahbakhsh, 2013) is also said to compound the problem. But in the developing world, there is another dimension which is always either overlooked or forgotten – the non-availability of data on the gravity of the problem.
and Deshpande, 2006) and so, quantification is the most important aspect of solid waste management. Furthermore, with data on quantity and type of solid waste, various options can be explored. For example, investment in recycling, reuse, compositing, and energy generation could reduce the amount of waste that the authorities have to dispose off and at the same time creating employment. The work of Diaz and Otoma (2013) stress this approach towards minimising solid waste disposed in landfills. Mathematical modelling provides an insight on the extent of the problem by providing data on the quantities generated and their type. Several attempts at modelling solid waste generation have been made. The differences in previous approaches have basically been in the size of the area considered, choice of independent variables, waste streams considered and techniques employed (Beigl et al., 2008). The techniques that have been in use are least square regression (Benitez et al., 2008), linear programming models (Najm et al., 2004) and system dynamics modelling (Dyson and Chang, 2005, Eleyan et al, 2013). The main objective of this present study is to analyse a deterministic compartmental model for the impact of population growth on the solid waste generation and treatment. Stability theory of differential equations is employed to tackle the problem qualitatively. Numerical simulation is performed using Runge-Kutta Fehlberg integration scheme in order to validate the qualitative results. To the best of authors’ knowledge, no such a study which considers this problem has been reported in the literature yet. In the following sections, the model problem is formulated, analysed and solved. Pertinent results are display graphically and discussed qualitatively.
2. Model Development
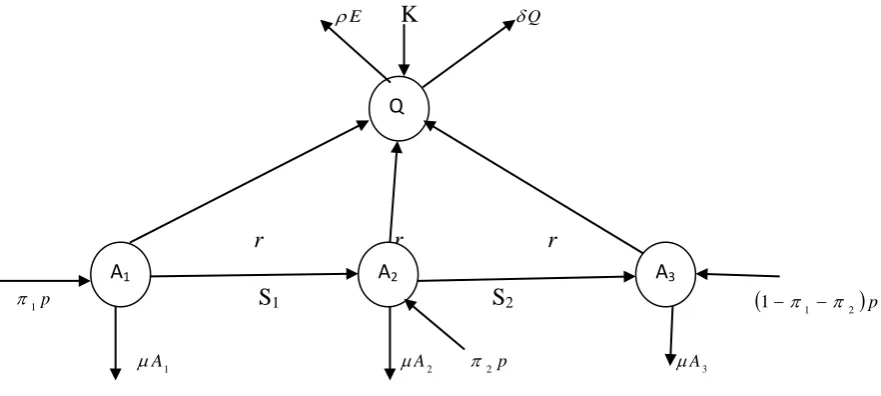
The model is built on the basic assumption that solid waste generation rate increases with increasing population. The population increases due to birth and migration. It is further assumed that the population is divided into three groups of the young, adults and elderly (A1, A2 and A3 respectively) and the groups generate solid waste at the same rate r. Apart from human activities, solid waste can also be generated from natural causes such trees shedding leaves denoted as K. To keep the environment clean an effort E has to be applied at the rate β. The effort E here means any measures emanating from the government authorities or the community to keep their environment clean. It thus includes efforts geared towards compositing, disposal, recycling or reuse. The solid waste diminishes at the rate due to applied effort and decay naturally at the rate .
Moreover, it is assumed that there is a certain given quantity of solid waste generation (Qm) allowed above which the treatment effort E must increase in order to prevent the
menace posed by this waste to human health and environment. This implies that dE/dt < 0 whenever Q Qm, while for Q > Qm, dE/dt > 0. Thus, by taking p to be the total
respectively, then the deterministic compartmental model is as shown in the Figure 1 below:
E K Q
r r r
1p S1 S2 112p
A1 A2 2p A3
Figure 1: Flow diagram for the compartmental model
Thus, the model is given by the following system of ordinary differential equations:
1 1 1 1 1 ~ A A S N P dt dA (1) 2 2 2 1 1 2 2 ~ A A S A S N P dt dA (2) 3 2 2 2 1 3 ~ ) 1
( PN S A A
dt dA (3) E Q N r K dt dQ ( ~ ) (4) E Q Q dt dE m ( ) (5) By adding equations (1)-(3), we obtain
N P dt N d ~ ) ( ~ (6)
where N~ A1 A2 A3. Equation (6) models the exponential growth population with P as the birth / recruitment rate into the population and μ as the natural death rate. The intrinsic population growth rate is given by P-μ. Using equation (6), we normalised equations (1)-(3). Let
. ~ , ~ , ~ 3 3 2 2 1 1 N A a N A a N A
a
(7) Substituting equations (6)-(7) into equation (1), i.e.,
Q
A2
, ~ ~ ~ ~ ~ 1 1 1 1 1 1 a N a N S N p dt N d a dt da
N
(8) which implies . ~ ~ ~ ~ ) ( ~ 1 1 1 1 1 1 a N a N S N p N P a dt da
N
(9)
In a similar manner, equations (6)-(7) are substituted into equations (2)-(3) and the normalised model equations (1)-(3) become
, 1 1 1 1 1 pa a S P dt da (10) , 2 2 2 1 1 2 2 pa a S a S P dt da (11) . ) 1
( 1 2 2 2 3
3 pa a S P dt da (12)
Adding equations (10)-(12), we obtain the normalised equation for total population as
), 1 ( N P dt dN (14) and the exact solution is given as
, ) 1 ( 1 )
(t N0 e Pt
N
(15)
where N0 = a1(0) + a2(0) + a3(0) is the total initial population at t = 0. Substituting equation (15) into equation (4), we obtain the equation for the rate of solid waste accumulation as . ] ) 1 ( 1
[ N0 e Q E
rQ K dt dQ Pt (16)
Equation (16) invariably depends on the normalised total population, treatment rate base on applied effort E and natural decay rate of solid waste. Note that r is the rate of solid waste generation due to interaction of total population with solid waste materials. Moreover, it is assumed that a certain stipulated quantity of solid waste generation (Qm)
is allowed by the government authority is a given community above which the waste treatment effort E must be expedited in order to prevent the menace posed by this waste to human health and environment as depicted in equation (5). This implies that dE/dt < 0 whenever Q Qm, while for Q > Qm, dE/dt > 0.
Theorem 1: If a1(0), a2(0), a3(0), Q(0) and E(0), are non-negative, then so are a1(t), a2(t), a3(t), Q(t), E(t) and N(t) = a1(t)+a2(t)+a3(t) for all t > 0. Moreover
limt N(t) 1, limt Q(t) Q*, limt E(t) E * where ( ) , * * .
* m E Q Qm
r Q K
Q
In particular, the region
( , , , , ) : 1, *, *
D a1 a2 a3 Q E 5 a1 a2 a3 Q Q E E
is positively invariant. From this theorem we conclude that it is sufficient to consider the dynamics of equations (10-12, 16, 5) in D. In this region, the model can be considered as being biologically, environmentally and mathematically well-posed. Remark: In order to obtain the solid waste endemic equilibriumH1 (a1*,a*2,a1*,Q*, E*) , equations (10)-(12), (16) and (5) are equated to zero and solved. The components of H1 are given by
* . * , ) ( * , ) )( ( ) 1 ( , ) )( ( , 2 1 1 2 1 2 2 2 2 1 * 3 2 1 1 1 2 2 * 2 1 1 * 1 m m Q Q E r Q K Q P S P S S S P S S a P S P S P S P S P a P S P a (17) For solid waste free equilibrium Q Qm, in this case H0 (a1*,a*2,a1*,0,0) and virtually all solid wastes automatically decay to zero together with the treatment effort.
The linear stability of H1 is investigated by considering the Jacobian matrix of the model system in equations (10)-(12), (16) and (5) given by
. 0 0 0 0 0 0 0 0 0 0 0 0 0 0 0 0 ) , , , , ( ) , , , , ( 2 2 1 1 3 2 1 5 4 2 2 1 r P S P S S P S E Q a a a f f f f f J (18) The eigenvalues of the Jacobian matrix in (18) are obtained as
, ),
( ),
( 1 2 2 3
1 S P S P P
(19)
and
2 ( r ) ( r) 0. (20)
For the local asymptotic stability of H1, all the eigenvalues of Jacobian matrix in (18) must have strictly negative real parts. Clearly, the three eigenvalues in equation (19) are strictly negative. However, in order to achieve strictly negative real parts for the remaining two eigenvalues in equation (20), we employed Routh-Hurwitz criteria (Arrowsmith and Place, 1982) which invariably leads to the following additional conditions . 0 ) ( , 0 )
( r r (21) From equation (21), we define
. ) -( , 2 1 r R r R
Theorem 2: The solid waste generation endemic equilibrium H1 is locally asymptotically stable whenever R1 > 1 and R2 >1 and unstable otherwise.
Remark: The conditions in theorem 2 validate theorem 1 and the positivity of the solid waste expression Q* in equation (17). In the absent of solid waste, H1 is unstable and solid waste free equilibrium H0 can be achieved.
3. Results and Discussion
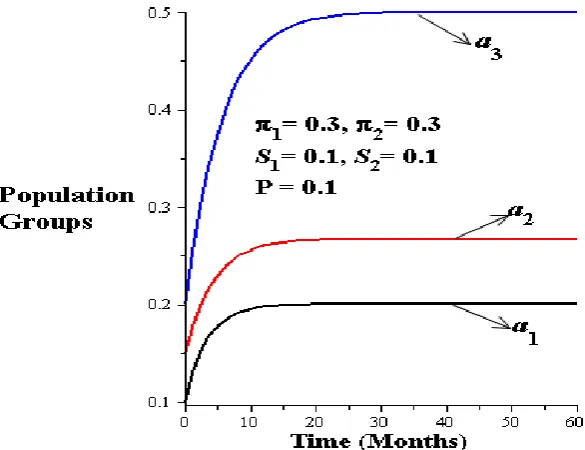
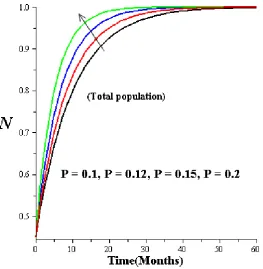
In this section, we study numerically the effects of various parameters embedded in the model system on the solid waste generation and treatment effort in the presence of population growth scenario using Runge-Kutta Fehlberg integration scheme. For numerical simulation, the following parameter values γ = 0.05; = 0.05; = 0.1; K = 0.01; S1 = 0.1; S2 = 0.1; 1 = 0.3; 2 = 0.3; P = 0.1, 0.12, 0.15, 0.2; r = 0.1, 0.12, 0.13, 0.15; β = 0.1, 0.2, 0.3, 0.4 are utilised in order to examine the system dynamics. Figures 2-3 depict the population dynamics within the community. The evolution of the three population groups (i.e. young, adults and elderly) are illustrated in figure 2. Each group grow at different rate based on their initial population and the survival probability to the next group with time until they achieve their respective stable population level. In essence, solid waste generation rate for each group will initially increase but eventually be constant as each group comes to a steady state. Figure 3 shows the effects of increasing growth rate on the total population. As expected, the total population increases faster with time due to an increase in the growth rate (P) until the stable population distribution is achieved.
Figure 3: Effect of increasing growth rate on total population
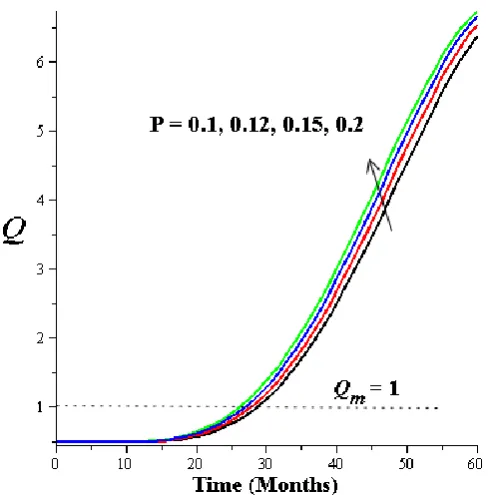
Figures 4-10 illustrates the effects of various parameters on the solid waste generation and treatment effort needed when the threshold quantity of solid waste generation allowed by the government authority in a given community is Qm = 1. Initially, it is
assumed that the quantity of solid waste generated within the community (Q (0)=0.5) is lower than the threshold allowed i.e. (Q(0) < Qm). As the total population increases
threshold quantity. But as the total population continues to increase with increasing growth rate, the solid waste generation continues to increase as well, and grows beyond the threshold quantity. In effect, solid waste treatment effort has to increase in order to reduce the solid waste accumulation. Similarly, figure 8 shows that increasing solid waste generation rate due to access to solid waste materials may initially have no effect on the solid waste treatment effort as some waste may be decaying naturally or the threshold amount has not been reached. But as the solid waste continues to pile up due to increasing access and interaction with solid waste material, the required treatment effort needed to curb the waste generation increases. It is important to note that, in this context, solid waste treatment effort refers to all means, measures or techniques employed to reduce solid waste mount in the community. They may include land-filling, reuse, recycling, compositing, incineration and waste to energy conversions or other techniques to that effect. Figure 9 shows an increase in the response to solid waste generation above the stipulated threshold quantity, in time, will lead to a general elevation in the solid waste treatment effort. In effect increasing effort growth rate means reducing the amount of solid waste handled in the community and thus providing healthier environment to live in. From figure 10, it is seen that the treatment effort increases with an increase in the solid waste generation above the threshold quantity, consequently, the quantity of generated solid waste decreases as the effort rate increases.
Figure 5: Effect of increasing solid waste generation rate by total population
Figure 7: Effect of increasing population growth rate on treatment effort (Qm =1)
Figure 9: Effect of increasing treatment effort rate when (Qm =1)
Figure 10: Effect of increasing treatment effort on solid waste generation.
4. Conclusions
It is also evident that increasing the solid waste treatment results in reduced solid waste quantity. Moreover, below the stipulated threshold quantity of solid waste, the treatment effort diminishes, leading to possibility of solid waste free equilibrium due to natural decay of remnant sold wastes, reuse, recycling, incineration, etc.
REFERENCES
[1] Achankeng, E., 2003. Globalisation, Urbanisation and Municipality Solid Waste Management in Africa, a paper presented at the Africa on a Global Stage of the African studies Association of Australasia and the Pacific 1-3 October, Flinders University, Adelaide, South Australia
[2] African Development Bank, 2002. Study on the Waste Management Options for Africa. A Draft Report
[3] Arrowsmith, D. K., Place, C. M. 1982. Ordinary differential equations. Chapman and Hall.
[4] Benitez, S.O, Lozaro-Olvera. G, Morelos, R.A, de Vega, C.A., 2008. Thematical Modelling to predict residential solid waste generation. Waste Management 28, S7-S13
[5] Biegl, P., Lebersorger, S., Salhofer, S., 2008. Modelling Solid Waste generation: a review. Waste Management 28, 200-214
[6] Diaz, R., Otoma, S., 2013. Constrained recycling: a framework to reduce landfilling in developing countries. Waste Management and Research; 31(1) 23-29.
[7] Dyson, B., Chang, N.B., 2005. Forecasting municipal solid waste generation in a fast growing-urban region with system dynamics modelling. Waste management 25(7) 669-679
[8] Eleyan, D., Al-Khatib, I.A, Garfield, J., 2013. System dynamics model for hospital waste characterization and generation in developing countries; 31(10) 986–995
[9] Gawaikar V and Deshpande V.P., 2006. Source Specific Quantification and Characterisation of Municipal Solid Waste – a Review. Indian Journal of Environment Vol. 86
[10]Guerrero, L.A, Maas, G., Hogland, W., 2013. Solid waste management challenges for cities in developing countries. Waste Management 33,220-232
[11]Henry, R.K., Yongsheng, Z., Jun, D., 2006. Municipal solid waste management challenges in developing countries – Kenyan case study. Waste Management 26(1), 92-100.
[12]Joseph, K., 2002. Perspectives of Solid Waste Management in India. Proceedings of the International Symposium on the Technology and Management of the Treatment & Reuse of the Municipal Solid Waste, Shanghai, China
[13]Kaare, S (2002). The Role of Privatisation in Providing the Urban Poor Access to Social Services: The Case of Solid Waste Collection in Dar es Salaam, Tanzania In Research on Poverty Alleviation (2002), Dar es Salaam Tanzania. Mkuki na Nyota Publishers Ltd
[14]Kyessi, A and Mwakalinga, V., 2009. GIS Application in Coordinating Solid Waste Collection: The Case of Sinza Neighbourhood in Kinondoni Municipality, Dar es Salaam City, Tanzania. FIG Working Week 2009: Surveyors Key Role in Accelerated Development. Eilat, Israel, 3-8 May 2009
[15]Manga, VE; Forton, OT; Read, AD., 2008. Waste management in Cameroon: A new policy perspective?. Resources Conservation & Recycling, Vol 52, pp. 592- 600.
[16]Maribel U. Cruz. http://www.scribd.com/doc/10509292/Solid-Waste-Management (March 29, 2014)
[17]Marshall, R.E., Farahbaksh, K., 2013. Systems approaches to integrated solid waste management in developing countries. Waste Management 33 (2013), 988-1003.
[19]Najm, M.A., El-Fadel, M., 2004. Computer-based interface for integrated solid waste management optimisation model. Environmental Modelling and Software 19, 1151-1164 National Solid Waste Association of India, 2008. Urban Waste Management Newsletter.
[20]Nemerow, N.L., 2009. Environmental Engineering: Environmental Health and Safety for Municipal Infrastructure, Land use, Planning, and Industry, sixth ed. Wiley Hoboken, NJ.
[21]Okot-Okumu, J., Nyenje, R., (2011). Municipal solid waste management under decentralisation in Uganda. Habital International 35, 537-543.
[22]Oosterveer, P., Van Vliet, B., (2010). Environmental systems and local actors: decentralising environmental management in Uganda. Environmental Management 45, 284-295.
[23]Seadon, J.K., 2006. Integrated waste management – looking beyond the solid waste horizon. Waste Management 26 (12), 1327-1336.
[24]Tacoli C., 2012. Urbanisation, Gender and Urban Poverty: Paid Work and Unpaid Carework in the City. International Institute for Environment and Development: United Nations Population Fund, London, UK.
[25]UNEP-IETC, HIID, 1996. International Source Book on Environmentally Sound Technologies for Municipal Solid Waste Management, United Nations Environment Programme (UNEP), International Environmental Technology Centre (IETC).
[26]Wilson, D.C., 2007. Development drivers for solid waste management. Waste Management and Research 25(3), 155-164.
[27]Worrel, W.A., Vesilind, P.A., 2012. Solid Waste Engineering, second ed. Cengage Learning, Stanford, CT.
[28]Yhdego, M., (1995). Urban solid waste management in Tanzania: issues, concepts and challenges. Resource, Conservation and Recycling, 14 (1), 1-10.
[29]Yousif, D.F., Scott, S., 2007. Governing solid waste in Mazatengo, Guetemala. International Development Planning Review 29 (4), 433-450.
J. P. SENZIGE, SCHOOL OF COMPUTATIONAL AND COMMUNICATION SCIENCE AND ENGINEERING, THE NELSON MANDELA AFRICAN INSTITUTE OF SCIENCE AND TECHNOLOGY (NM-AIST), P.O BOX 447 ARUSHA-TANZANIA
O.D. MAKINDE, FACULTY OF MILITARY SCIENCE, STELLENBOSCH UNIVERSITY, PRIVATE BAG X2, SALDANHA 7395, SOUTH AFRICA
K. NJAU, SCHOOL OF MATERIALS, ENERGY, WATER AND ENVIRONMENTAL SCIENCE, THE NELSON MANDELA AFRICAN INSTITUTE OF SCIENCE AND TECHNOLOGY (NM-AIST), P. O BOX 447 ARUSHA, TANZANIA