International Journal of Advances in Management and Economics
Available online at:
www.managementjournal.info
RESEARCH ARTICLE
Consumer Based Brand Equity and Attitude Towards Leading
Online Shopping Websites in India
Ashutosh Anil Sandhe
*Abstract: The focus of this research was to measure consumer-based brand equity (CBBE) of India’s top online retailing websites Amazon and Flipkart. However, for the sake of confidentiality and copyright, their names were not revealed anywhere in the paper. This was done with the help of Aaker’s and Keller’s concept of brand equity. A sample of 1000 respondents from across the state of Gujarat, India was taken. Data was collected through a structured questionnaire. CBBE was measured by calculating mean scores of overall brand equity and its factors. The factors were brand loyalty, perceived quality, brand awareness, brand association, attitude and purchasing intention. The correlation coefficient between factors and brand equity was considered as weight. The research revealed through the data which retail site had a higher brand equity. One interesting fact that was identified was how keenly both the brands are trying to woo their customers. The results showed very similar trends. A positive relation was found between brand equity and its factors. Based on this relationship the research concluded with a regression model where brand equity was the dependent variable and factors were independent variables. It was observed that the factor ‘brand loyalty’ had the lowest mean value suggesting that with competition and wider choice to consumer, brand loyalty tends to be lower. Favorable attitude was observed for both brands with highest mean values among all factors.
Keywords: Brand Loyalty, CBBE, Perceived Quality, Brand Awareness, Brand Association, Attitude, Purchasing Intention.
Article Received: 10 August 2019 Revised: 14 August 2019 Accepted: 22 August 2019
Introduction
India enjoys demographic dividend as compared to some of the developed nations like the United States, Britain or even some of the emerging economies like Russia or China. With 1.2 billion people and the world’s third largest economy in purchasing power parity terms, India’s recent growth has been a significant achievement[1].
India has emerged as the fastest growing major economy in the world as per the Central Statistics Organisation (CSO) and International Monetary Fund (IMF). India's consumer confidence index stood at 132 in the first quarter of 2019, topping the global list of countries on the same parameter, as a result of strong consumer sentiment, according to market research agency, Nielsen.
According to a report published by IBEF in May 2019, India’s GDP has risen by 7.2 per cent in 2017-18 and 7 per cent in 2018-19. With these figures, the country India has maintained its position as the third largest startup base in the world with over 4,750 technology start-ups.
According the latest report by Boston Consultancy Group, nominal expenditure growth of 12% is more than double the anticipated global rate of 5% and will make India the third-largest consumer market by 2025[2].
Internet Penetration in India
In today’s era, Indians have a wide array of choices when it comes to spending their money. The choices range from unorganized retail stores to organized ones and the recent trend is the mushrooming of online shopping platforms. Especially with the penetration of smartphones and faster internet technology supported by decent internet penetration even to the rural areas, more and more people are likely to make their purchases from online shopping platforms.
estimated to grow further in the coming years [3]. The rise in internet penetration to go with the positive figures of per capita incomes, demographic dividend and rapidly
growing economy, has paved a path for the digital India where a lot of transactions will be done through the internet.
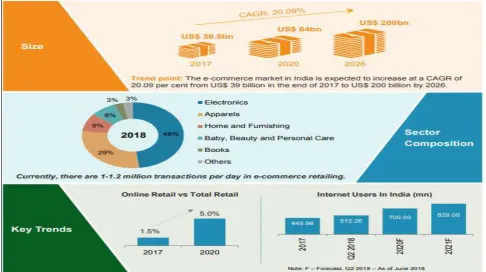
Figure 1: Internet Users in India
Source : ICUBE
Currently, a good number of Indians prefer to shop for various types of products through the online shopping options available in the country. Some of the prominent ones are Amazon, Flipkart, Shopclues, Paytm, Snapdeal, Infibeam, Homeshop18, Myntra, Jabong, Voonik, Yepme, Yebhi, Pepperfry, Bigbasket, UrbanClap, Firstcry, Zivame, Clovia, Lenskart.
Indian Retail Sector
According to a report published by IBEF in March 2019, the Indian retail industry is one of the fastest growing sectors in the world. The report further said that the country is adopting online retail in a big way. The Indian retail industry has emerged as one of the most dynamic and fast-paced industries due to the entry of several new players.
It accounts for over 10 percent of the country’s Gross Domestic Product (GDP) and around 8 percent of the employment. India is the world’s fifth-largest global destination in the retail space. The retail sector in India is emerging as one of the largest sectors in the economy.
The total market size of Indian retail industry reached US$ 672 billion in 2017. It is forecasted to increase to US$ 1,200 billion by 2021 and 1,750 billion by 2026. India will become a favourable market for fashion retailers on the back of a large young adult consumer base, increasing disposable incomes and relaxed FDI norms[4].
According to the latest IBEF Report on retail sector in India which was published in January 2019, online retail business is the next generation format which has high potential for growth. Currently, it is estimated to be a US$ 50 billion opportunity. After conquering physical stores, retailers are now foraying into the domain of e-retailing. It had a market size of US$ 18 billion in 2017 and is forecasted to reach US$ 32.70 billion by 2018.
day sale period ending September 24, 2017, backed by huge deals and discounts offered by the major ecommerce companies. The government plans to allow 100 per cent FDI
in e-commerce, under the arrangement that the products sold must be manufactured in India to gain from the liberalized regime[5].
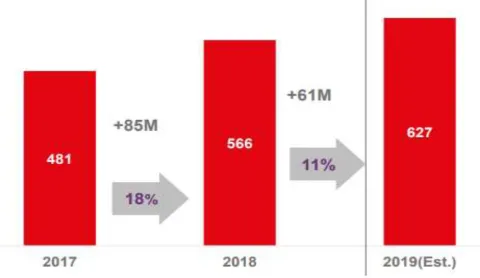
Figure 2: Growth of Retail E-Commerce in India
Source: IBEF
If the data on internet and growing retail sector is viewed together, there seems to be a strong positive correlation between the two in the sense that with increasing internet penetration and growth of organized retail sector, the growth of online retail sector is likely to outperform its counterparts.
According to the Telecom Regulatory Authority of India (TRAI), there were 391.50 million Internet subscribers as on December 31, 2016[6]. With this scenario, it was deemed fit to conduct a research on brand equity of some of the leading online retail stores. The research is aimed at covering not only the brand equity of these online retail stores but also consumer attitude and purchasing intention of consumers in India.
The reason for selection of Amazon and Flipkart for the purpose of analysis was the market coverage. Amazon and Flipkart are in a fierce battle for market share in the Indian e-commerce space. Both brands combined account for more than 50 percent of the total Gross Merchandise Value (GMV). As on 31st March 2018, Amazon’s GMV reached $7.5 billion follwed by Flipkart as
$6.2 billion. As per the report by Barclays, Flipkart and Amazon make up a majority of India’s online retail, which is predicted to grow two-fold to $40-45 billion by 2020 [7]. Based on the data, it was thought fit to select these two retailers for the study.
Theoretical Construct
This Research Would Focus on three Aspects of Consumer Behavior
Brand Equity of online retail stores in India
Consumer attitude towards these retail stores in India
Purchasing intention towards these retail stores.
Brand Equity
Brand is a unique identity that is associated with the product which enables consumers to differentiate one product from another. The American Marketing Association defines brand as a name, term, sign, symbol, or combination of them that is designed to identify the goods or services of one seller or group of sellers and differentiate them from competitors. Brand equity is the value of brand in the marketplace [8].
Further, the concept of brand equity covers the incremental utility or value addition to a product by its brand name [9]. The research has moved from brand to brand equity and then to the concept of consumer based brand equity (CBBE). Brand equity is the added value endowed on products and services. It may be reflected in the way consumers think,
feel and act with respect to the brand as well as in the prices, market share and profitability the brand commands [10]. Customer based brand equity is the differential effect brand knowledge has on consumer response to the marketing of that brand [11].
According to Yoo and Donthu [9], the difference in consumer response between the focal brand and counterpart can be interpreted as brand equity of focal brand. Through research it has been found that brand equity has a positive impact on future profits and long term cash flow (Srivastava and Shocker, 1991) and consumers’ willingness to pay premium prices (Keller, 1993). Therefore, brand equity has the capability to enhance the business potential.
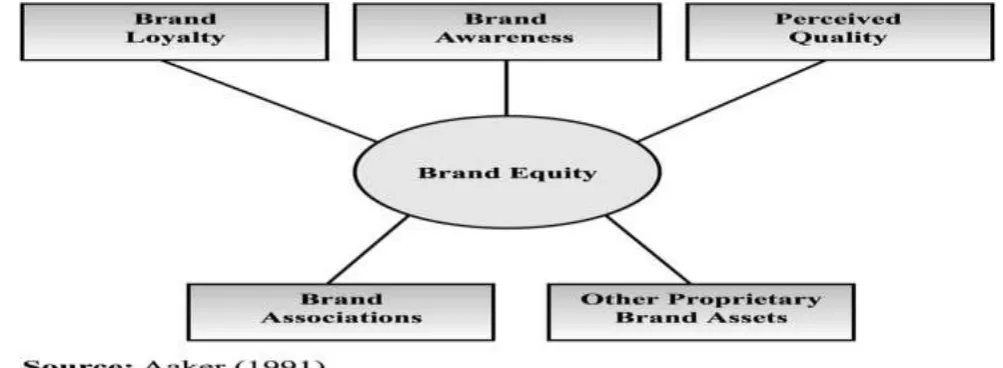
Figure 3: Consumer-Based Brand Equity Model
Brand Loyalty
Brand loyalty is a core dimension of brand equity. According to David Aaker, brand loyalty is the attachment that a customer has to a brand. There is a positive relationship between brand equity and brand loyalty (Lassar, 1995). Through research it was established that brand loyalty is directly related to brand price[12].
Brand Awareness
Brand awareness is the ability for a buyer to recognize or recall that brand is a member of a certain product category (Aaker, 1991). It was also defined as the ability to recall and recognize the brand as reflected by their ability to identify the brand under different conditions and to link the brand name, brand logo, brand symbol, etc. to certain associations in memory (Aaker, 1996).
Perceived Quality
Perceived quality is the consumer’s judgment about product’s overall excellence or superiority that is different from objective quality (Zeithaml, 1988). Objective quality is the technical, measurable and verifiable nature of products/services, processes and quality controls[10]. Further it has been established that high objective quality does not result into higher brand equity. Thus, perceived quality is a dimension of brand equity.
Brand Association
Keller, 2006) and is anything linked in memory to a brand.
Other Proprietary Assets
Other proprietary brand assets refer to patents, trademarks and channel relationships which can provide strong competitive advantage. A trademark will protect brand equity from competitors who might want to confuse customers by using a similar name, symbol or package[13]. This research does not aim to focus on the other proprietary assets mentioned above. Instead, two additional dimensions i.e. attitudes and purchasing intention towards online retail stores are considered.
Consumer Attitude
The second aspect of consumer behavior towards online retail stores is the attitude of people in India. Lot of studies have been carried out to study and identify the parameters that affect attitude of consumers. Attitude is a learned predisposition to behave in a consistently favorable or unfavorable way based on feelings and opinions that result from an evaluation of knowledge about the object (Schiffman).
Attitude is based on three major components -cognitive factors, affective factors and conative factors. Cognitive factors lead to awareness and perceptions of a consumer about a product object. Affective factors lead to the emotional attachment or involvement about a product object or a brand and finally the conative component measures the purchasing intention towards a product object or brand.
Purchasing Intention
The third and final part of the research is to measure the purchase intention for online retail stores in India. Purchasing intention is the willingness to purchase through a preferred mode. In this case that mode would be online retail outlets. It has been seen through research that purchase intention and attitudes result into brand equity levels (Agarwal and Rao, 1996). In the research conducted by Yoo and Donthu also it was found that there was high positive correlation between brand equity and brand attitude.
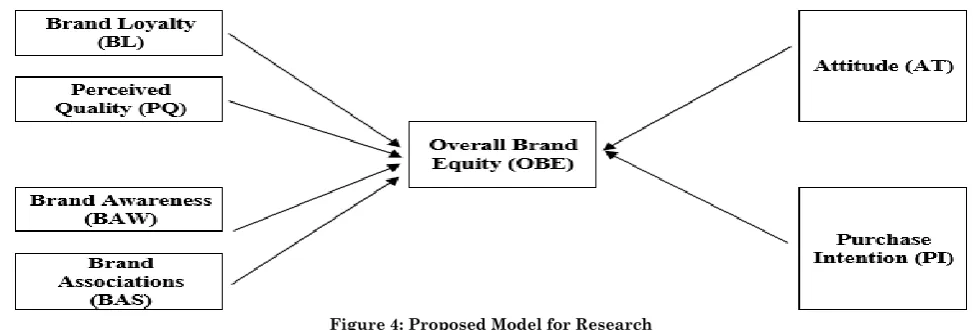
Thus, Based on the Literature Review, the Following Model is Proposed to be used
Figure 4: Proposed Model for Research
This model is based on the theoretical construct proposed by David Aaker. Modifications were made to include consumer attitude and purchasing intention towards online retail stores.
Study of Literature
Lassar et al. (1995) made an attempt to develop a measure of consumer based brand equity. The researchers considered five factors or dimensions that led to brand equity: performance, value, social image, trustworthiness and commitment. Their research found that brands that had a higher score of brand equity had higher
prices[14]. Yoo and Donthu (2001) developed a scale to measure brand equity through a multistep study.
value for each of the sub-components of brand equity.
The authors further proposed two new methods to evaluate the long-term health of a brand. For this purpose a nested design based on conjoint methodology, coupled with a hierarchical linear Bayes model, was used to estimate brand equity [15]. Wang and Finn (2012) used the Multivariate Generalizability Theory (MGT) to develop a brand equity scale. The purpose of this theory was to check the reliability of the measurement scale. They observed that individual differences, dimensions and items were all found to be mixed with the concept of CBBE measures. So, to clear this confusion, they developed Many-facet Item Response Theory to further complement the information provided by MGT analysis. The two measures when used together provided a balanced and thorough analysis of brand performance and offered better ways of improving performance measurement[16]. Brand building helps in creating, evolving and enhancing a brand's positioning and its perceptions among stakeholders which are important in affecting the behavior and performance of an institution Sharma et al. (2013).
The authors measured brand equity of select Indian business schools from the viewpoint of students through a familiarity–perception– preference–choice framework. Their framework suggested how consumer-based brand equity measures could be utilized for improvement in business school positioning and enhance brand image[17]. Juan Carlos Londoño et al. (2016) developed the concept of Consumer-based Brand–Retailer–Channel Equity (CBBRCE). The results suggested that CBBRCE can be created through CBBRC Awareness[18].
Research Methodology
This exploratory research focusses on three important facets of two of India’s top an
online retail stores, i.e. consumer-based brand equity, consumer attitude and purchasing intention. A sample size of 1000 covering the entire state of Gujarat was considered as appropriate keeping in mind the time and resources in hand. The population considered for this research was only those respondents who shop or are likely to shop online. The two brands considered for this research were Amazon and Flipkart. However, for the sake of confidentiality, due to intellectual property rights rules, the names haven’t been disclosed in the results. Data was collected through a structured questionnaire in English covering all the aforesaid aspects of the research and also the demographic profile of respondents. The size of questionnaire was restricted so that respondents find it easy and less time consuming to answer all the questions without getting bored [19-20].
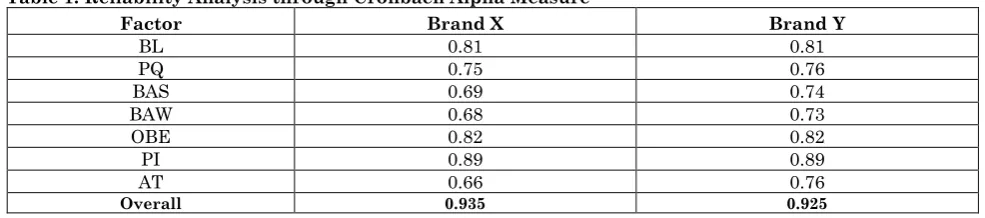
In order to get objective and genuine information, opinion of the respondents was asked through statements on a five point likert scale which ranged from 5 (strongly agree) to 1 (strongly disagree). The questionnaire was divided into eight parts covering the parameters brand loyalty, perceived quality, brand awareness, brand association, overall brand equity, attitude, purchasing intention and finally the demographic profile. The demographic profile collected information regarding city, age, occupation, gender, family size, marital status and income. The data was collected through an online questionnaire. For this purpose, probabilistic sampling technique was used. The sampling method was stratified random sampling where occupation of the respondents was considered as the strata. Preliminary test of the data for reliability and consistency showed that the data was highly reliable and consistent as is clear from the Cronbach Alpha values shown below.
Table 1: Reliability Analysis through Cronbach Alpha Measure
Factor Brand X Brand Y
BL 0.81 0.81
PQ 0.75 0.76
BAS 0.69 0.74
BAW 0.68 0.73
OBE 0.82 0.82
PI 0.89 0.89
AT 0.66 0.76
An alpha value of more than 0.60 is considered to be reliable. In this research each individual factor had alpha value of more than 0.60 and the overall reliability statistics gave values for 0.935 and 0.925 for Brand X and Brand Y respectively. For the purpose of confidentiality, instead of the actual brands, Brand X and Brand Y have been mentioned for both the brands. Which brand is X and which one is Y is kept confidential.
Research Objectives
The Objectives of the Research Were to Study and Analyse
Overall brand equity for online retail stores in India.
Multi-dimensional brand equity for online retail stores in India.
Brand loyalty for online retail stores. Perceived quality of online retail stores. Brand awareness for online retail stores. Brand associations for online retail stores. Overall attitude towards online retail
stores in India.
Purchase intention for purchasing through online retail stores in India.
Following was Hypothesized on the Basis of the above Mentioned Objectives
H1
There is lack of significant levels of
overall brand equity of online retail
stores.
H2
There is lack of significant levels of
multi-dimensional brand equity of online retail
stores.
H2a
There is lack of significant level of brand
loyalty for online retail stores in India.
H2b
There is lack of significant level of
perceived quality of online retail stores.
H2c
There is lack of brand awareness of
online retail stores.
H2d
There is lack of brand association for
online retail stores.
H3
There is lack of significant purchasing
intention for online retail stores in India.
H4
There is lack of significant brand attitude
for online retail stores in India.
Data Analysis
Table 2: Demographic Profile of Respondents
Factor N N% Factor N N%
Age
15-25 724 72.40
Occupation
Student 310 31.00
26-35 137 13.70 Homemaker 48 4.80
36-45 47 4.70 Business 142 14.20
46-55 43 4.30 Service 371 37.10
Above 55 49 4.90 Profession 129 12.90
Total 1000 100 Total 1000 100
Family Size
1-4 649 64.90
Gender Male 565 56.50
5-7 321 32.10 Female 435 127.57
More than 7 30 3.00 Total 1000 100
Total 1000 100
Income
0-4 341 34.10
Marital Status
Married 592 59.20 4.01-8.00 355 35.50
Unmarried 408 40.80 8.01-12.00 177 17.70
Total 1000 100 Above 12 127 12.70
Total 1000 100
Table 2 provides an overview of the demographic profile of the respondents who provided data for this research. From the table it is clear that majority of the respondents are between the age 15 and 45 (97.31%). Further, majority of the
H1 There is lack of significant levels of overall brand equity of online retail stores.
Table 3: Simple Mean Analysis of Leading Online Stores in India
Factor Mean S.D. Brand X Chi Sig. Mean S.D. Brand Y Chi. Sig.
BL 3.28 0.99 61.304 0.00 3.61 0.99 60.723 0.000
PQ 3.51 0.86 141.063 0.00 3.65 0.87 136.964 0.000
BAW 4.05 0.86 183.813 0.00 4.17 0.87 181.723 0.000
BAS 3.57 0.67 97.161 0.00 3.96 0.64 183.393 0.000
AT 3.65 0.79 191.741 0.00 3.77 0.79 190.830 0.000
PI 3.38 0.77 197.312 0.00 3.88 0.66 196.375 0.000
Brand Equity 3.41 0.86 123.357 0.00 3.55 0.86 230.286 0.000
Significance levels at 95%
As can be seen in Table 3, mean values for all the factors for both the brands was above the 2.5 suggesting positive opinion from respondents. The overall brand equity for Brand Y was found to be slightly higher than Brand X. However, these mean values were considered independently without the impact of factors affecting brand equity. All the values were found to be significant as is clear from the goodness of fit test.
Brand awareness was found to be high for both the brands. As a result of the findings, the null hypothesis was rejected and alternate hypothesis was accepted. Thus, brand equity for both the brands was found in the study and further the brand equity of Brand Y was found to be higher than Brand X.
H2
There is lack of significant levels of multi-dimensional brand equity of online retail stores.
H2a
There is lack of significant level of brand loyalty for online retail stores in India
H2b
There is lack of significant level of perceived quality of online retail stores.
H2c
There is lack of brand awareness of online retail stores
H2d
There is lack of brand association for online retail stores.
Brand equity is the result of the effects of its factors. The factors in the present study were ‘Brand Loyalty’, ‘Perceived Quality’, ‘Brand Awareness’, ‘Brand Associations’, ‘Attitude’ and ‘Purchasing Intention’. The mean values for all these factors for both the brands were found to be significant and positive.
For Brand X, the mean values were in the range between 3.28 (Brand Loyalty) and 4.05 (Brand Awareness) and those for Brand Y were in a slightly higher range of 3.61 (Brand Loyalty) and 4.17 (Brand Awareness). Since all mean values were above 2.5, they were considered as favourable. Further, Chi-square values indicated that these values were highly significant. Thus, the hypothesis and its related hypotheses were rejected and alternate hypotheses were accepted.
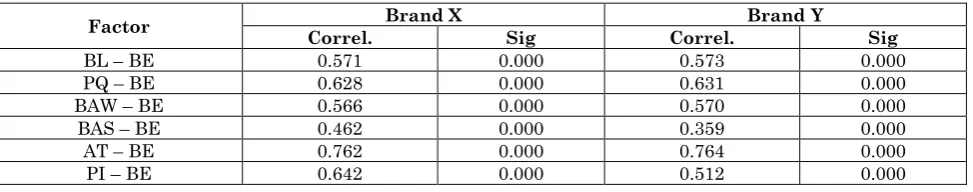
Table 4: Correlation between Brand Equity and Factors Affecting Brand Equity for Leading Online Stores in India
Factor Brand X Brand Y
Correl. Sig Correl. Sig
BL – BE 0.571 0.000 0.573 0.000
PQ – BE 0.628 0.000 0.631 0.000
BAW – BE 0.566 0.000 0.570 0.000
BAS – BE 0.462 0.000 0.359 0.000
AT – BE 0.762 0.000 0.764 0.000
PI – BE 0.642 0.000 0.512 0.000
Through the literature, it has been observed that brand equity is a result of its factors. Mean analysis gave a preliminary result of
However, how strongly these factors affected brand equity could be studied through correlation analysis. It can be seen in Table 4 that there was positive correlation between brand equity and its factors for both the
brands. The highest impact on brand equity for Brand X and Brand Y, both was of attitude. Thus, attitude plays a vital role in determining brand equity.
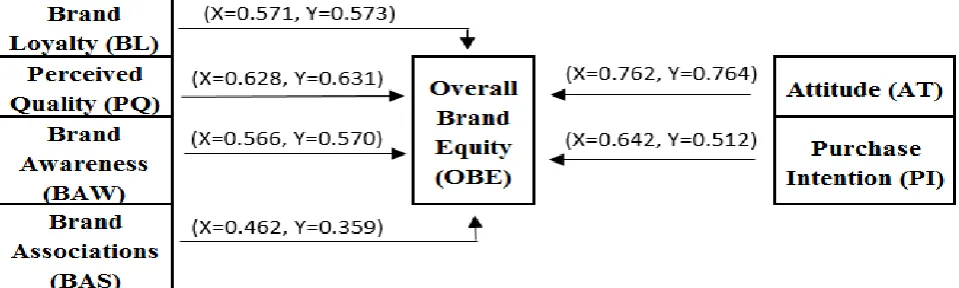
Figure 5: Correlation between Factors Affecting Brand Equity and Brand Equity
The above Figure shows the relationship between all the factors that lead to brand equity. Results show that there is a positive relationship between all the factors and
brand equity. The correlation coefficient was further considered as a weight for calculating mean scores in order to determine overall brand equity for both the brands.
Table 5: Comparative Brand Equity of Leading Online Stores in India
Factor
Brand X Brand Y
Mean r Mean
Score Mean R
Mean Score
BL 3.28 0.571 1.87 3.61 0.573 2.07
PQ 3.51 0.628 2.20 3.65 0.631 2.30
BAW 4.05 0.566 2.29 4.17 0.570 2.38
BAS 3.57 0.462 1.65 3.96 0.359 1.42
AT 3.65 0.762 2.78 3.77 0.764 2.88
PI 3.38 0.642 2.17 3.88 0.512 1.99
Brand Equity 3.41 3.57 3.55 3.83
Instead of just calculating simple mean to study the brand equity, a slightly different approach was adopted. Mean scores of all the factors was calculated and based on that brand equity was determined for both the brands. The mean score was a product of mean and correlation coefficient between the given factor and brand equity. Thus, a weighted mean was calculated under the premise that the factor that would affect the most, would have more impact on the value of brand equity.
Thus, based on the values obtained, attitude had the maximum impact on brand equity (r=0.762) for Brand X as well as Brand Y (r=0.764). Based on the weighted mean scores, the overall brand equity of Brand X was 3.57 as compared to Brand Y which as 3.83. Thus, the brand equity of Brand Y was found to be higher. The final mean score for both the brands was calculated by the given formula-
Brand Equity = ∑ (Factors x Correlation Coefficient) ∑ Correlation Coefficient
H3
There is lack of significant purchasing intention for online retail stores in India.
As shown in Table 3, there was positive purchasing intention for both the brands. A mean value of 3.88 for Brand Y and 3.38 for Brand X hinted at the fact that purchasing
chi-square values obtained which was highly significant for both sets of data. Thus, alternate hypothesis was accepted. There is a favourable purchasing intention for both the brands and that it is higher for Brand Y as compared to Brand X.
H4
There is lack of significant brand attitude for online retail stores in India
Like purchasing intention, attitude towards both the brands was found to be highly favourable. This could be one of the reasons that both these brands are leading brands in India. The mean value for Brand Y was 3.77 and for Brand X it was slightly less at 3.65.
However, on a five point scale these values suggested a favourable opinion of respondents. Further, attitude was found to be positively correlated to brand equity. The values obtained were on the higher side for both Brand Y (r=0.764) and Brand X (r=0.762). The goodness of fit tests indicated highly significant values for both the brands. Based on these results, the null hypothesis was rejected and alternate hypothesis was accepted.
Discussion
This research yielded some interesting findings about the brand equity of two leading online retail websites in India. The data underlined the fact as to why there is keen competition between both the brands to capture markets in India. The results were found to be highly similar. The overall brand equity based on weighted mean scores was found to be marginally higher for Y. All the factors that result into higher or lower brand equity were positively related to brand equity. The relationship was found to be significant for all the factors for both brands. Of all the factors, attitude had the highest impact on brand equity.
Further, attitude was observed as highly favorable for both the brands, even though slightly better for Brand Y. Of all the factors, ‘Brand Loyalty’ had the least mean value again suggesting the fact that when there are alternatives available to consumers in the market, brand loyalty tends to be lower. Since the results were positive for both the brands in terms of relationship between factors affecting brand equity and brand equity itself, we constructed a regression model to predict brand equity based on its factors.
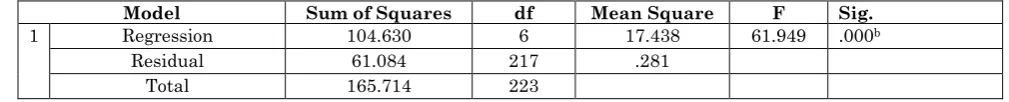
Table 6: Regression Analysis for Brand X
Model Summaryb
R R Square Adjusted Square R Std. Error of the Estimate Durbin-Watson
1 .795a .631 .621 .53056 1.927
a. Predictors: (Constant), Average Purchase Intention, Average Brand Loyalty, Average Brand Association, Average Perceived Quality, Average Brand Awareness, Average Attitude
b. Dependent Variable: Average Overall Brand Equity
ANOVAa
Model Sum of Squares df Mean Square F Sig.
1 Regression 104.630 6 17.438 61.949 .000b
Residual 61.084 217 .281
Total 165.714 223
a. Dependent Variable: Average Overall Brand Equity
b. Predictors: (Constant), Average Purchase Intention, Average Brand Loyalty, Average Brand Association, Average Perceived Quality, Average Brand Awareness, Average Attitude
Coefficientsa
Model
Unstandardized Coefficients
Standardized Coefficients
t Sig.
B Std. Error Beta
1 (Constant) -.059 .226 -.263 .793
Average Brand Loyalty .095 .050 .109 1.905 .048
Average Perceived Quality .182 .062 .181 2.956 .003
Average Brand Awareness .042 .064 .041 .656 .513
Average Brand Association .015 .075 .011 .195 .845
Average Attitude .557 .079 .509 7.066 .000
Average Purchase Intention .068 .078 .060 .866 .388
Table 7: Regression Analysis for Brand Y Model Summaryb
Model R R Square
Adjusted R Square
Std. Error of the
Estimate Durbin-Watson
1 .795a .632 .622 .53111 1.928
a. Predictors: (Constant), Average Purchase Intention, Average Brand Association, Average Brand Loyalty, Average Brand Awareness, Average Perceived Quality, Average Attitude
b. Dependent Variable: Average Overall Brand Equity
ANOVAa
Model Sum of Squares df Mean Square F Sig.
1 Regression 105.320 6 17.553 62.229 .000b
Residual 61.211 217 .282
Total 166.531 223
a. Dependent Variable: Average Overall Brand Equity
b. Predictors: (Constant), Average Purchase Intention, Average Brand Association, Average Brand Loyalty, Average Brand Awareness, Average Perceived Quality, Average Attitude
Coefficientsa
Model
Unstandardized Coefficients Standardized Coefficients
t Sig.
B Std. Error Beta
1 (Constant) -.089 .234 -.381 .703
Average Brand Loyalty .097 .050 .112 1.957 .042
Average Perceived Quality .185 .062 .185 2.990 .003
Average Brand Awareness .030 .062 .030 .483 .630
Average Brand Association .056 .069 .041 .809 .419
Average Attitude .589 .070 .540 8.473 .000
Average Purchase
Intention .016 .073 .012 .222 .824
a. Dependent Variable: Average Overall Brand Equity
From the Regression Analysis,
Following Model was Summarized
Y1 = β0 + β1X1i + β2X2i + β3X3i + β4X4i + β4X5i + β4X6i + μi,
Where Y = Consumer-Based Brand Equity (CBBE), X1 is Brand Loyalty (BL), X2 is Perceived Quality (PQ), X3 is Brand Awareness (BAW), X4 is Brand Association (BAS), X5 is Attitude (AT) and X6 is Purchase Intention (PI). In the equation i is the sample size from 1 to 1000 and μ is the random error. For both the brands, the regression model was–
CBBE (Brand X) = -0.059 + 0.109BL +
0.109PQ + 0.181BAW + 0.041BAS +
0.509AT + 0.060PI CBBE (Brand Y) = -0.089
+ 0.112BL + 0.185PQ + 0.030BAW +
0.041BAS + 0.540AT + 0.012PI
Of all the factors, the coefficient for Brand Loyalty, Perceived Quality and Attitude were highly significant for both the brands. Further, Durbin-Watson values for both the brands were in the range of 1.5 to 2.5 which was acceptable statistically. The regression model was highly significant as is clear from the above data.
Conclusion
Based on the results, there was a negligible difference in the brand equity towards both the brands in India. For both the brands, overall attitude was found to be positive and at the same time there was close similarity in the values for the independent variables affecting brand equity.
Brand loyalty for both the brands was low suggesting that consumers tend to shift to different retail websites as per their needs. However, they prefer these two brands the most and tend to shift more between these two brands. This also proves the fact that there is close competition between the two brands in India. People prefer either Amazon or Flipkart most of the time when it comes to buying goods online in India.
Limitations and Future Scope for Research
References
1. http://www.worldbank.org/en/country/india/ove rview accessed on 6 June 2019.
2. https://www.bcg.com/d/press/21march2017-new-indian-changing-consumer-149010 accessed on 6 June 2019.
3. https://imrbint.com/images/common/ICUBE%E 2%84%A2_2019_Highlights.pdf accessed on 6 June 2019.
4. https://www.ibef.org/economy/indian-economy-overview accessed on 18 October 2018.
5. https://www.ibef.org/download/retail-jan-2019.pdf accessed on 6 June 2019.
6. http://indiatoday.intoday.in/story/digital-india-internet-users/1/913797.html accessed on 15 April 2019.
7.
https://www.business- standard.com/article/companies/e-tailers-war- amazon-s-gross-sales-in-india-21-higher-than-flipkart-s-118112800036_1.html accessed on 23 February 2019.
8. Keller, Kevin Lane (2003) Strategic Brand Management: Building, Measuring, and Managing Brand Equity, 2nd Edition. Upper Saddle River, New Jersey: Prentice Hall. 9. Yoo, Boonghee, Donthu, Naveen (2001)
Developing and Validating a Multidimensional Consumer-Based Brand Equity Scale. Journal of Business Research. 52(1):1-14.
10. Kotler P, Keller KL, Koshy A, Jha M (2014) Marketing management: A South Asian Perspective (14th Ed.). New Delhi: Pearson Education.
11. Kevin Lane Keller (2008) Strategic Brand Management, 3rd Edition, Prentice Hall.
12. Chaudhuri A, Holbrook M (2001) the chain of effects from brand trust and brand affect to brand performance: The Role of Brand Loyalty, Journal of Marketing, 65:81-93.
13. Ovidiu Ioan Moisescu (2011) The concept of brand equity - A comparative approach, Munich Personal RePEc Archive, 212-220. 14. Walfried Lassar, Banwari Mittal, Arun
Sharma (1995) "Measuring customer‐based brand equity", Journal of Consumer Marketing, 12(4):11-19,
15. Ashish Sinha, Aaron Gazley, Nicholas Ashill (2008), Measuring Customer Based Brand Equity using Hierarchical Bayes Methodology, Australian Marketing Journal, 16(1):3-19. 16. Wang Luming, Finn Adam (2012) Measuring
Consumer Based Brand Equity Across Brand Portfolios: Many –Facet Item Response Theory Perspective, Journal of Targeting, Measurement & Analysis for Marketing, 20 (3/4):254-260.
17. Ashita Aggarwal Sharma, Vithala R, Rao, Sapna Popli (2013) Measuring consumer-based brand equity for Indian business schools, Journal of Marketing for Higher Education, 23 :( 2):175-203.
18. Juan Carlos Londoño, Jonathan Elms, Keri Davies (2016) Conceptualizing and Measuring Consumer-Based Brand–Retailer–Channel Equity, Journal of Retailing and Consumer Services, 29:70-81.
19. Chieng Fayrene, Goi Chai Lee (2011) Customer- Based Brand Equity: A Literature Review, Journal of Arts Science & Commerce, II (1):33-42.