International Journal of Advances in Management and Economics
Available online at:
www.managementjournal.info
RESEARCH ARTICLE
Tingting Ling | Sept.-Oct. 2019 | Vol.8| Issue 5 |71-77 71
Sector
Structure
and
Economic
Growth:
A
Case
of
Guangdong-Hong Kong-Macau Great Bay Area
Tingting Ling
*School of International Business, Ji'nan University, China.
Abstract
The degree of optimization of industrial structure has become one of the core powers of modern economic growth engine. Using the data from 1996 to 2016 and taking the Guangdong-Hong Kong-Macao great bay area as an example, this paper made an empirical analysis on the contribution of industrial structure adjustment variables of the Guangdong-Hong Kong-Macao great bay area to economic growth, and concluded that the optimization and adjustment of industrial structure in the great bay area had a significant positive correlation with economic growth. In order to strengthen the bay area economy, bay area cities should speed up the adjustment of industrial structure and the elimination of backward production capacity. Furthermore, bay area cities should combine the elements of innovation-driven development, explore the tertiary industry with local characteristics, and take the tertiary industry as the engine for the economic development of the whole bay area.
Keywords: Economic Growth, Guangdong-Hong Kong-Macao great bay area, Optimization of industrial structure.
Introduction
The Guangdong-Hong Kong-Macao great bay area refer to urban agglomerations consisting of 9 cities (Guangzhou, Shenzhen, Foshan, Dongguan, Huizhou, Zhuhai, Zhongshan, Jiangmen, Zhaoqing ) and two special administrative regions (Hong Kong and Macao). It is an important space carrier for the construction of world-class urban agglomerations and participation in global competition.
It is one of the four largest bays in the world alongside the Bay Area of New York, the San Francisco Bay Area and Tokyo Bay Area in Japan. Among them, Hong Kong and Guangzhou were rated as first-tier cities in the world by Ga WC- the world’s most authoritative world’s urban research institution, and Shenzhen was ranked second-tier city in the world [1].
At the 5th session of the 12th National People's Congress held on March 5, 2017, Premier Li Keqiang proposed in the government work report that it is necessary to promote the deepening of cooperation
between the Mainland and Hong Kong and Macao, study and formulate plans for the development of cities and towns in Guangdong, Hong Kong and Macau in the Great Bay Area, and play Hong Kong and Macao Unique advantages. On April 7, the
National Development and Reform
Commission formulated and published the “Key Points for the Innovation of the Institutional Mechanism of the National New District in 2017”.
In 2017, Guangzhou added more than 4,000 national high-tech companies, the increase is second only to Beijing, with a total of more than 8,700, the total number of high-tech enterprises and hard science and technology development index rank the top three in the country. Over 3,000 Internet companies in Guangzhou have been born with WeChat, Vipshop, YY Voice, Cool Dog Music, Netease, UC Browser, etc.
In the "Top 100 Internet Companies in China" list in 2016, a total of eight companies were listed in Guangzhou, and the total number ranked first in Guangdong. Guangzhou has assembled 97% of the country's key disciplines, 80% of universities, 70% of scientific and technical personnel, and 95% of doctoral degrees.
The total number of university students in the country ranks first in the country. In 2016, Guangzhou absorbed 163,200 college graduates, the most in the province. The per capita disposable income of Guangzhou residents ranks first in the province. The cooperation between Guangdong, Hong Kong, and Macao is not a new concept. The proposal for the urban agglomeration of the bay area should be an upgraded version of the integration of the cities of the Pearl River Delta, including Hong Kong and Macao [3].
It has been upgraded from the economic and trade pattern of the post-store factory to advanced manufacturing over the past 30 years ago. The most important demonstration areas for the organic integration of industry and modern service industries; the rise of regional economic cooperation to a national strategy for all-round opening to the outside world; this has brought new opportunities for the future development of Guangdong.
Hong Kong, and Macao cities, and has also given new missions. On March 6, 2017, at the Guangdong delegation's plenary session of the Fifth Session of the Twelfth National People's Congress, Ningxia, the deputy to the National People's Congress and the chairman of the Guangdong Provincial Development and Reform Commission, made a systematic discussion on the construction of the Guangdong-Hong Kong-Macao great bay area. He Ningka quoted data pointing out that in 2015, the economic scale of
Guangdong, Hong Kong, and Macau in the bay area was 1.36 trillion U.S. dollars, the annual throughput of port containers exceeded 65 million Standard boxes, and the annual throughput of airport passengers reached 175 million; the industrial structure is based on advanced manufacturing. With the modern service industry as the mainstay, the value-added ratio of the service industry in Hong Kong and Macao accounts for about 90% of the GDP. The manufacturing bases of the nine cities in the Mainland are strong and have formed a two-wheel drive industrial system for advanced manufacturing and modern service industries.
The Guangdong, Hong Kong and Macao regions have conducted in-depth cooperation and exchanges in economy, trade, technology and finance, and are entering a comprehensive and in-depth stage of cooperation. In addition, Guangdong-Hong Kong-Macao great bay area need to give full play to the leadership and spillover effects of the three central cities of Hong Kong, Guangzhou, and Shenzhen in the modern service industry and advanced manufacturing industries in the Pearl River Delta region [4].
As soon as possible, a group of companies that can compete with Baidu, Ali and Tencent will be formed. New industries and new enterprises based on the Internet, promote the specialization and diversification of industries with regional integration to cope with the construction of Guangdong, Hong Kong, Macau and the world-class urban agglomerations.
Therefore, in order to understand how to accelerate the construction of the bay area, it is of great practical significance to study the correlation between economic growth and industrial structure of the Guangdong-Hong Kong-Macao great bay area. Next, this paper will make an empirical analysis of the contribution of industrial structure adjustment variables in the Guangdong-Hong Kong-Macao great bay area to economic growth from 1996 to 2016.
Tingting Ling | Sept.-Oct. 2019 | Vol. 8| Issue 5 |71-77 73
Table 1: Descriptive Analysis
GDP? ONE? TWO? THREE? FOUR?
Mean 12.14908 7.315423 10.99990 11.29668 2.439697
Median 12.10290 8.269200 11.28750 11.25980 0.770000
Maximum 14.61670 10.36430 13.56450 14.50610 26.03000
Minimum 9.847000 -3.296800 0.000000 0.000000 0.380000
Std. Dev. 1.261804 3.325132 1.805923 1.944284 4.132479
Skewness 0.218540 -2.201962 -2.936675 -2.301081 3.108371
Kurtosis 2.078093 6.680899 18.59785 15.68861 13.92989
Jarque-Bera 10.01917 317.0819 2673.720 1753.489 1521.812
Probability 0.006674 0.000000 0.000000 0.000000 0.000000
Sum 2806.437 1689.863 2540.978 2609.533 563.5700
Sum Sq. Dev. 366.1945 2542.996 750.1125 869.4553 3927.799
Observations 231 231 231 231 231
Cross sections 11 11 11 11 11
Dependent Variable: GDP?
Method: Pooled EGLS (Cross-section random effects)
Date: 03/25/18 Time: 16:57
Sample: 1996-2016 Included observations: 21 Cross-sections included: 11
Total pool (balanced) observations: 231
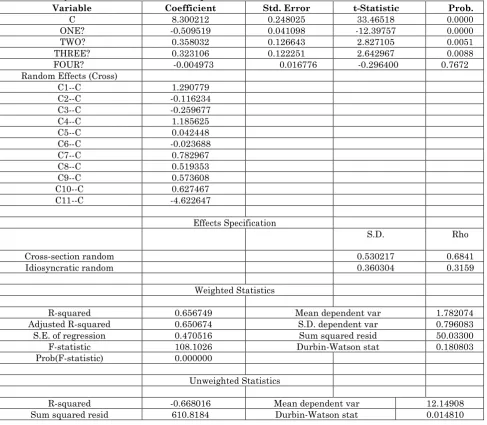
Table 2: Swamy and Arora estimator of component variances
Variable Coefficient Std. Error t-Statistic Prob.
C 8.300212 0.248025 33.46518 0.0000
ONE? -0.509519 0.041098 -12.39757 0.0000
TWO? 0.358032 0.126643 2.827105 0.0051
THREE? 0.323106 0.122251 2.642967 0.0088
FOUR? -0.004973 0.016776 -0.296400 0.7672
Random Effects (Cross)
C1--C 1.290779
C2--C -0.116234
C3--C -0.259677
C4--C 1.185625
C5--C 0.042448
C6--C -0.023688
C7--C 0.782967
C8--C 0.519353
C9--C 0.573608
C10--C 0.627467
C11--C -4.622647
Effects Specification
S.D. Rho
Cross-section random 0.530217 0.6841
Idiosyncratic random 0.360304 0.3159
Weighted Statistics
R-squared 0.656749 Mean dependent var 1.782074
Adjusted R-squared 0.650674 S.D. dependent var 0.796083
S.E. of regression 0.470516 Sum squared resid 50.03300
F-statistic 108.1026 Durbin-Watson stat 0.180803
Prob(F-statistic) 0.000000
Unweighted Statistics
R-squared -0.668016 Mean dependent var 12.14908
Sum squared resid 610.8184 Durbin-Watson stat 0.014810
Hausman Test
If the probability is less than 0.05, the study should select fixed effect model; conversely, If the probability is greater than 0.05, the study should select random effect model.
Correlated Random Effects-Hausman Test
Tingting Ling | Sept.-Oct. 2019 | Vol. 8| Issue 5 |71-77 74
Table 3: Test cross-section random effects
Chi-Sq.
Test Summary Statistic Chi-Sq. d.f. Prob.
Cross-section random 163.406293 4 0.0000
Table 4:Cross-section random effects test comparisons
Variable Fixed Random Var(Diff.) Prob.
ONE? -0.939160 -0.509519 0.001185 0.0000
TWO? 0.361487 0.358032 0.002081 0.9396
THREE? 0.586485 0.323106 0.002706 0.0000
FOUR? -0.032070 -0.004973 0.000016 0.0000
Dependent Variable: GDP? Method: Panel Least Squares Date: 03/25/18 Time: 16:59 Sample: 1996 2016
Included observations: 21 Cross-sections included: 11
Total pool (balanced) observations: 231
Table 5:Cross-section random effects test equation
Variable Coefficient Std. Error t-Statistic Prob.
C 8.496014 0.193039 44.01186 0.0000
ONE? -0.939160 0.053608 -17.51904 0.0000
TWO? 0.361487 0.134607 2.685491 0.0078
THREE? 0.586485 0.132858 4.414363 0.0000
FOUR? -0.032070 0.017243 -1.859906 0.0643
Effects Specification
Cross-section Fixed (Dummy Variables)
R-squared 0.923426 Mean dependent var 12.14908
Adjusted R-squared 0.918463 S.D. dependent var 1.261804
S.E. of regression 0.360304 Akaike info criterion 0.858993
Sum squared resid 28.04087 Schwarz criterion 1.082526
Log likelihood -84.21365 Hannan-Quinn criter. 0.949152
F-statistic 186.0579 Durbin-Watson stat 0.200623
Prob(F-statistic) 0.000000
Dependent Variable: GDP? Method: Pooled Least Squares Date: 03/25/18 Time: 17:00 Sample: 1996 2016
Included observations: 21 Cross-sections included: 11
Total pool (balanced) observations: 231
Variable Coefficient Std. Error t-Statistic Prob.
C 8.496014 0.193039 44.01186 0.0000
ONE? -0.939160 0.053608 -17.51904 0.0000
TWO? 0.361487 0.134607 2.685491 0.0078
THREE? 0.586485 0.132858 4.414363 0.0000
FOUR? -0.032070 0.017243 -1.859906 0.0643
Fixed Effects (Cross)
C1--C 1.867872
C2--C -0.675425
C3--C 0.138206
C4--C 1.733341
C5--C 0.588399
C6--C 0.014160
C7--C 2.060683
C8--C 1.458935
C9--C 1.538997
C10--C -0.094372
Tingting Ling | Sept.-Oct. 2019 | Vol. 8| Issue 5 |71-77 75 Effects Specification
Cross-section fixed (dummy variables)
R-squared 0.923426 Mean dependent var 12.14908
Adjusted R-squared 0.918463 S.D. dependent var 1.261804
S.E. of regression 0.360304 Akaike info criterion 0.858993
Sum squared resid 28.04087 Schwarz criterion 1.082526
Log likelihood -84.21365 Hannan-Quinn criter. 0.949152
F-statistic 186.0579 Durbin-Watson stat 0.200623
Prob(F-statistic) 0.000000
Table 6: Results of Hausman Test
Test Summary Chi-Squ.Stat Chi-Squ.d.f. Prob.
Cross-section random 163.406293 4 0
Empirical Results
Fitness of the Model
In this OLS, the Function can be Written
Y= β1X1+β2X2+β3X3+β4X4+U (1)
Y means every city’s GDP, X1 represents the
logarithm of the primary industry, X2
represents the logarithm of the secondary industry, X3 represents the logarithm of the
tertiary industry, and X4 represents the ratio
of the tertiary industry to the sum of the primary and secondary industries We assume that the intercept and slope estimates, estimated valueβ1, β2, β3 and β4 have been
obtained for the given sample of data.
We can obtain the fitted value for each observation. By definition, each fitted value is on the OLS regression line. The OLS residual associated with observation I, estimated u, is the difference between y and its fitted value. The idea case for observation i is when estimate Ui = 0, but in most cases, every
residual is not equal to zero. In other words, none of the data points must actually lie on the OLS line. According to data, R-square is 0.923426, very close to 1. The probability (F-statistic) is 186.0579 which is fitted of the model. However, the Probability (t-Statistic C) is 0.0643.
Explanation of the Model
The probability is less than 0.05, so the study should select fixed effect model. In the fixed model, the first and the forth dependent variables are negative, and others are positive.
Effect of Independent Variables on Dependent Variable
According to the graph and data analysis, the ratio of the tertiary industry to the traditional industry is negatively correlated with GDP, but the coefficient is small, indicating a weak negative correlation. This shows that although the third industry is important, traditional industries cannot be ignored, and a city with better economic development needs to be balanced. In addition to the special political status of Hong Kong and Macau, other cities should be based on the traditional industry and develop the third industry.
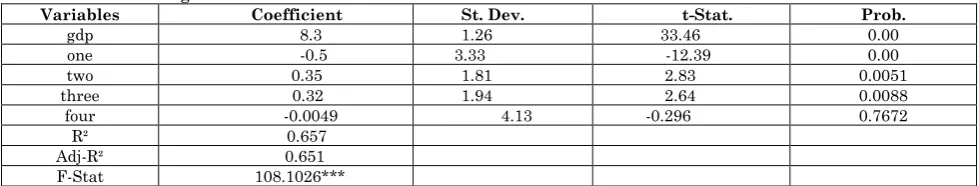
Table 7: Results of Regression
Variables Coefficient St. Dev. t-Stat. Prob.
gdp 8.3 1.26 33.46 0.00
one -0.5 3.33 -12.39 0.00
two 0.35 1.81 2.83 0.0051
three 0.32 1.94 2.64 0.0088
four -0.0049 4.13 -0.296 0.7672
R² 0.657
Adj-R² 0.651
F-Stat 108.1026***
Conclusion and Suggestion
From the above analysis, we can conclude that the amount of GDP in Hong Kong and Macao Bay Area in the bay area ratio of third industry city in the first and second industry is higher, the city of bay area GDP the total contribution is higher, especially in Guangzhou, Shenzhen, Hongkong. So we can draw a conclusion, in order to enhance the bay area economy, the bay area city should speed up industrial restructuring; accelerate the elimination of backward production capacity.
And the, with elements of innovation driven development, we can explore the local characteristics of the third industry, such as the characteristics of financial services, tourism and other three industries. Ultimately, we can take third industry as the engine driving the entire bay area economic development.
Suggestion
The development of Hong Kong and Macao Bay area, four policy suggestions for our country "National" 13th Five-Year "in March 2016 to develop a plan" proposed to promote Guangdong Bay area and major inter provincial cooperation platform ". In July 2017, three places signed" to deepen cooperation to promote the construction of Hong Kong and Macao Bay Area framework agreement "agreement, putting forward to perfect the innovation cooperation mechanism , promoting mutually beneficial and win-win cooperation, building plan livable industry life circle and Guangdong cooperation demonstration zone.
And then, putting forward to strengthen Guangdong as the country's reform and opening up the first area. Finally, it promotes Hongkong in the three central positions of national finance, shipping, and trade. It also can establish the construction of Macao World Tourism and leisure center cooperation. But now, If let Hong Kong and Macao Bay area compared with the other three of the famous Bay Area in the development, there are still some deficiencies[5].
First, compared with the other three Bay areas, Hong Kong and Macao Bay area’s development degree is not enough. At present, the development of the world three Bay areas mainly depends on the center of the city in the bay area. These cities drive around other
city common development. In the process of development, these cities occupy the leading position of the Bay City. For example, in the United States in the New York Bay area, New York Bay Area as the center of the city, the population and the proportion of GDP was more than 85%.
Tokyo as the only core city of Tokyo Bay area, where the seven world famous port; and the San Francisco Bay Area in the city of San Francisco are the commercial and cultural center. The city of San Jose is science and technology innovation center. But in contrast, the Pearl River Estuary in Guangdong, Hong Kong and Macao are multi-level equilibrium.
There is no clear division of labor in all cities, so there is no strong cohesive force. In last 10 years, the problem of “how to integrate the advantages of resources and the implementation of regional coordinated development” has been the Guangdong Bay area needs to solve the problem. Second, the gap between the degrees of urban integration is large. As Guangdong, Hong Kong and Macau face the situation of "one country, two systems", how to realize the integration of rules, laws and humanities exchanges and the facilitation of information in the social field will be the biggest challenge in implementation.
This not only requires the emergence of a normalized coordination agency between Guangdong, Hong Kong and Macao, but also the unified coordination and coordination of the central government. Third, when
compared with the three famous
international areas, ecological environment quality of China's Guangdong Bay area is a prominent short board of its development.
As a core area of "strategic fulcrum, The Belt and Road" and the Pearl River Delta manufacturing industry, the urgent need to promote clean energy, to carry out clean Bay area plan to protect the ecological environment of the industrial development of Hong Kong and Macao Bay area measures in.
Tingting Ling | Sept.-Oct. 2019 | Vol. 8| Issue 5 |71-77 77
References
1. Chen Libing (2018) Research on the Talent Development of Building International Science and Technology Industry Innovation Center in Guangzhou, Academic Search for Truth and Reality, 06:71-79.
2. Liu Zuojing, Chen Jie (2019) Development Strategy of Guangdong, Hong Kong and Macao Talent Cooperation Demonstration Zone in the New Period, Science and Technology Management Research, 39(08):122-127.
3. Chen Zhao, Lin Tao (2018) the Influencing Factors of the Market Integration of Guangdong, Hong Kong and Macao under the New Economic Geography Perspective, World Economy Studies, 12:72-81+133.
4. LIN Jiang, YAO Cuiqi (2019)Seek
Common Ground while Reserving
Differences for Constructing
Guangdong-Hong Kong-Macao Greater Bay Area, Financial Minds, 4(01): 103-123+144.
5. Chen En, Liu Xiling, Yu Qianwen (2019) the Advantages, Bottleneck and
Countermeasures for Urban