ISSN: 2278-3369 International Journal of Advances in Management and Economics
Available online at www.managementjournal.info
RESEARCH ARTICLE
Value Stream Mapping-A Lean Manufacturing Approach to
Reduce the Process Wastages in Clothing Industry
B. Senthil Kumar
Department of Rural Industries and Management, Gandhigram Rural Institute-Deemed University.
Abstract
Among the textile supply chain apparel manufacturing system is the most laborious task. Most of the tasks could not be automated due to change in product nature. The current mass production system in sewing Industry is one kind of assembly line having complicated workstation. .This typical system creates high amount of non-value added activity, causes low productivity, longer production lead time, high rework and rejection, poor line balancing, low flexibility of style changeover etc. Various research references concluded that these kinds of problems were addressed by suitable implementation of lean manufacturing tools .In this research the researcher used Value Stream Mapping (VSM) as a a key lean tools to address the said issues at ABC Ltd, India on Men’s trouser production layout. Value stream mapping is different from conventional recording approaches as it helps in the visualization of Material Flow, Information Flow in a scientific manner. The current state VSM map was developed by mapping all the information and product flow at ABC towards the selected product line. This includes machine cycle time, inventory, setup time, and information flow such as how customers place the order. The current state of Value stream mapping (VSM) for mentioned the product was studied and the target areas of improvement were identified to eliminate the process wastages revealed by current state map at ABC. The future state VSM is designed in such a way to minimize the process wastages. In this regards cellular layout, keizan, single piece flow principles were followed to minimize the process wastages.
Keywords: Lean Manufacturing; Garment industries; Value Stream Mapping (VSM), Work in progress, Cycle time.
Introduction
Globalization has been the primary driver for all the changes, textile and clothing industry is also not exempted. Due to the increasing labour wage in developed countries, apparel manufacturing has been migrating from high wage developed countries to low wage developing countries [1]. Due to the specific market nature of the garment industries such as short production life cycle, high volatility, low predictability, high level of impulse purchase and the quick market response, garment industries are facing further challenges these days [2]. Before 1980, customers tolerated long lead time, which enabled the producers to minimize the production cost significantly by maintaining economic order size. But recent times customers are demanding for shorter lead time. So the clothing industry were not able to stand in the competitive market. The Second problem is related to order quantity. Earlier, industries were getting bulk orders, so once the production line was set for the first time it would run for a month. Due to
small order quantities and complex
designs, the garment industry has to produce multiple styles even within a day; this needs higher flexibility in volume and style change over [3]. The third important issue is keeping high WIP in traditional type of batch production is an another major issues faced by industries. Due to high WIP, the throughput time as well as rework level is very high. In some cases, even though the one operation has been completed it could not be transferred to the subsequent stage. More over due to high WIP defects rate increases, Style change over cannot be given more frequently, controlling the production flow is impossible and so on.
The fourth issues in clothing sector is improper work allocation .Since the assembly line layout demands for
individual for individual operator
Available online at www.managementjournal.info
the .Ultimately the Workload fluctuation and process balancing among operators is another problem in batch processing, because one operator is given one operation at a time. So the operator who is performing easier and low time consuming jobs can pile up a huge amount of WIP whereas in the critical operations (operations which need more time and skill) there is lagging which
causes unbalanced WIP between
machines and the work load. As per Drew et al [4],the best way to cope with all these challenges is the implementation of lean manufacturing..
Principles of Lean Manufacturing
According to Womock et al [5] the lean philosophy is popularized from Toyota manufacturing company. Taiichi ohno at Toyota is the man behind the development of lean production [6] and the term “Lean production” was coined in the report as adescription of victorious Japanese
production philosophy. As per International motor vehicle programme (IMVP) report lean production is lean because it uses less. Womack and Jones [7] describe lean as the most powerful tools available for creating value while eliminating waste in any organization. Waste takes many forms and can be found at any time and in any place. It may be found hidden in policies, procedures, process and product designs, and in operations. Waste consumes resources but does not add any value to the product [3]. According to Drew et al [4] lean is an alternative to mass production (that is the Henry Ford way), not a complement to it. Lean calls for a completely different way of operating, and for a completely different way of thinking about operations. Lean is not compatible with large-batch production; instead the pace, mix and quality of production are set by the customer. Lean is an integrated set of principles, practices, tools and techniques designed to address the root causes of operational underperformance [4].
Value Stream Mapping (VSM) is a technique that was originally developed by Toyota and then popularized. A value stream is a collection of all actions, value added as well as non-value added that are required to bring a product or a group of products that use the same resources through the main
flows, from raw material to the arms of customers [8]. As per Mehmet et al [9], value stream mapping is a visual way of representing the flow of information and materials in the production of products. Lasa et al [10] carried out VSM application in a company which manufactures plastic parts that make up mobile phone bodies, button units and keypads. Production lead time was reduced from 26 days to 20 days and value added lead time was reduced from 0.7 days to 0.5 days. Also they reported an achievement in cost savings and a reduction of raw material, semi-finished and finished goods inventory. Silva [11], identified the applicability of VSM for the apparel industry in Sri Lanka. The findings revealed that VSM can be applied to mass production apparel industries in order to derive positive results such as reducing wastes in inventory and defects. Further, VSM helped the managers of the case company to visualize the different types of wastes generated in the organization and future possibilities of eliminating or reducing them. Senthil
Kumar and Sampath [12] focused
investigation of VSM in existing product line and to alter the same with new cellular based layout which reduces the product lead time significantly.
in order lead-time. The time workers spent on value added activities went from 74% to 92%, and required floor space was reduced by 44%.
The term kaizen is often mentioned in the application of lean manufacturing. It simply means, “Change for the good of all” in Japanese and is used as an improvement tool. Kaizen is the starting point for all lean initiatives. Kaizen is a team approach to quickly tear down and rebuild a process layout to function more efficiently [18].
Quality in Toyota’s just in time
manufacturing system was based on the kaizen continuous improvement concept. This approach is used to create trial and error experiences in eliminating waste and simplifying processes, and this approach is repeated over and over again to continuously look for problems and solutions [19]. A Kaizen Blitz is a term used to describe when
a process is quickly changed to eliminate activities that have no value [19]. Kaizen is for small improvements, but carried out on a continual basis and involve all people in the organization. Kaizen requires no or little investment.
Icons Used in Developing VSM Diagram Value stream mapping is a pencil and paper tool, which is created using a predefined set of icons (shown in Figure.1 below). There are a lot of benefits to drawing value stream maps by hand with paper and pencil. Manual mapping lets us see what is actually happening in a shop floor value stream, rather than being restrained to a computer. Also, the process of quickly drawing and redrawing a map acts as a plan-do-check-act cycle that deepens our understanding of the overall flow of value or lack thereof.
Figure 1: Icon used for value stream mapping
Methodology
The methodology of the research was based on the implementation of theoretical frame work of Value stream mapping (VSM) in a clothing industry in India. This proposed research is conducted at ABC Clothing Ltd whose major products are knitted fabric based garments.
To minimise the process wastages in the produce line, the researcher recorded the standard operation time for each operation by using time study techniques for creating the current stage of VSM in a pictorial representation. Subsequently the researcher analysed source of process wastages, scope for improvement and scope for selection of other suitable lean
tools to minimize the process wastages. After that the revised VSM for the same product line is designed and then the process improvement is measured in the following manner such as perfor improvement and the cycle time, value added time, product defect level, Work in Progress (WIP), takt time, number of
operations, machine types, rate of
production, etc..
Selection of Product Layout
Available online at www.managementjournal.info
that it is solid colour single jersey fabric base having elastic waist band model, stretch fit, made in three different sizes.
Method
Current State Value Stream Mapping (VSM)
VSM is the important Lean tool was used for the elimination of the product wastes while manufacturing enterprise. Moreover with the support of VSM, one can identify the other suitable lean tools for implementation . To create a current state Value Stream Map (VSM) for the product, the product manufacturing line is analysed thoroughly and collected the required information.
A map of the plant layout is obtained to further understand the flow of materials within the plant. The information such as machine set up times, machine utilization, and inventory counts between the processes, takt time (customer requirement) are collected for developing the value stream map. The takt time of the product is calculated by dividing the demand of the customer per day in each style by the number of operating hours per day.
At ABC, Business planning department receives information through Electronic Data Interchange (EDI) from the customer.
In ABC, mostly repeated styles (garment design) of garments are manufactured. The order schedule is received on once in three months through EDI, the delivery duration and mode of delivery are as per the buyer requirement. Most of the customers of ABC expect higher product quality and on time shipment delivery.
Once the purchase order comes in, business planning department estimates the date by which the factory can make it ready. The planning department schedules it on weekly basis. Next, arrive at the day wise plan on the production level.
Then this schedule is sent to the factory for further execution. Business planning also includes making sure that enough raw material is available and that there is with
enough capacity on each unit. This schedule should be feasible and balanced. This schedule on the operating side become the basis to monitor day by day and week by week increments against how well they are in accordance with the schedule.
This schedule can then be updated further on hourly basis or machine wise schedule, which is used to push the order to the production facility.
All data for the current state map are collected according to the approach recommended by Rother and Shook (1999) .The important data such as inventory levels before each process, cycle times, number of workers and the changeover times are shown in current VSM. Initially for developing current state VSM, the cycle time is calculated. So that the researcher can find the muda (process waste) in the
existing practice. Subsequently the
researcher can find the scope for implementation of lean tools in the current value stream mapping.
For this product family, the demand of the customer is15,000 pieces in various color and size combination . Shipment schedule is 10 days from the order approval stage. Production demand for product =15000/10 days=1500 pcs/Shift. Daily work time is 28800 sec.
Available Working Time perShift
TAKT Time
Customer Demand perShift
=28800 sec/1500 pcs per day = 28800 sec 𝑜𝑓 𝑡ℎ𝑒 𝑑𝑎𝑦1500 𝑃𝑐𝑠 𝑝𝑒𝑟 𝑑𝑎𝑦 = 19.2 pcs
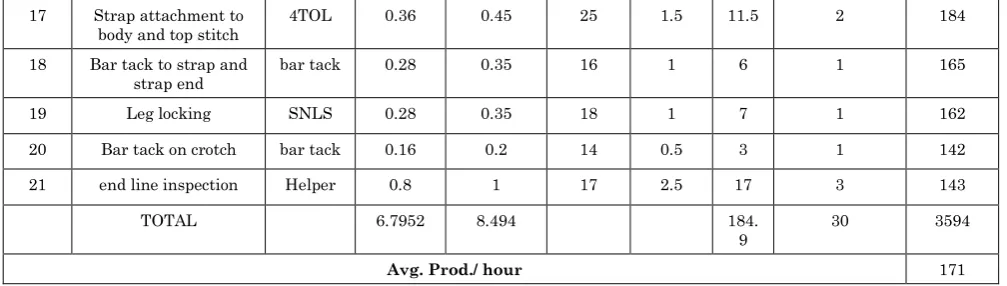
Figure 2: Current state VSM for Knitted trouser product line
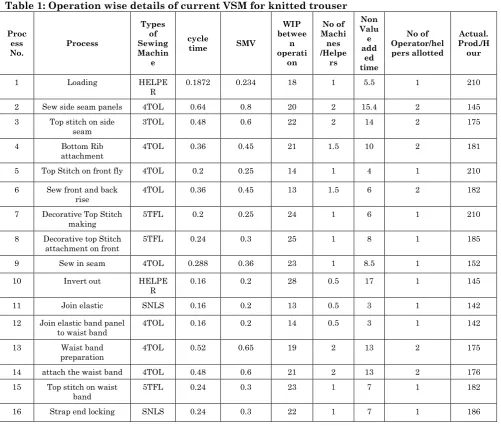
Table 1: Operation wise details of current VSM for knitted trouser
Proc ess
No. Process
Types of Sewing Machin
e
cycle
time SMV
WIP betwee
n operati
on
No of Machi nes /Helpe
rs
Non Valu e add
ed time
No of Operator/hel pers allotted
Actual. Prod./H our
1 Loading HELPE
R
0.1872 0.234 18 1 5.5 1 210
2 Sew side seam panels 4TOL 0.64 0.8 20 2 15.4 2 145 3 Top stitch on side
seam
3TOL 0.48 0.6 22 2 14 2 175
4 Bottom Rib attachment
4TOL 0.36 0.45 21 1.5 10 2 181
5 Top Stitch on front fly 4TOL 0.2 0.25 14 1 4 1 210
6 Sew front and back rise
4TOL 0.36 0.45 13 1.5 6 2 182
7 Decorative Top Stitch making
5TFL 0.2 0.25 24 1 6 1 210
8 Decorative top Stitch
attachment on front 5TFL 0.24 0.3 25 1 8 1 185
9 Sew in seam 4TOL 0.288 0.36 23 1 8.5 1 152
10 Invert out HELPE R
0.16 0.2 28 0.5 17 1 145
11 Join elastic SNLS 0.16 0.2 13 0.5 3 1 142
12 Join elastic band panel to waist band
4TOL 0.16 0.2 14 0.5 3 1 142
13 Waist band
preparation 4TOL 0.52 0.65 19 2 13 2 175
14 attach the waist band 4TOL 0.48 0.6 21 2 13 2 176 15 Top stitch on waist
band
5TFL 0.24 0.3 23 1 7 1 182
Available online at www.managementjournal.info 17 Strap attachment to
body and top stitch
4TOL 0.36 0.45 25 1.5 11.5 2 184
18 Bar tack to strap and
strap end bar tack 0.28 0.35 16 1 6 1 165
19 Leg locking SNLS 0.28 0.35 18 1 7 1 162
20 Bar tack on crotch bar tack 0.16 0.2 14 0.5 3 1 142
21 end line inspection Helper 0.8 1 17 2.5 17 3 143
TOTAL 6.7952 8.494 184.
9
30 3594
Avg. Prod./ hour 171
In Current VSM ,the fabric inspection and fabric cutting process are common which would be done in a common usage area irrespective of the product family. It is a casual wear having elastic waist band, and a strap to adjust the waist band measurement according to the body measurement. This garment has single solid color throughout its silhouette. Here the sewing process starts with “sewing the side seam panels” after the “panel loading” to the sewing section. Afterwards “top stitching on the side seam” is done. Subsequent to this operation “bottom rib fabric attachment”, “top stitch over the fly assembly”, “sewing on front and back rise” operations are done and then specific “decorative stitches” are made over the front assembly and “in seam making” would be done. Subsequent to this “invert
out”, “elastic joining”, “waist band
preparation” , “attachment of waist band” and “top stich on waist band “ operations are carried out. After that “waist band strap end locking” and “strap attachment” are the next stage of sewing operation. Finally “bar tack on strap” and “crotch point” are made. The following Figure 2 indicates current VSM for knitted trouser product line.
Future Stage Value Stream Mapping (VSM)
Looking at the current state map several things stand out: large inventories, the huge difference between the production lead-time and the value added time, the process that
happens on its own schedule, very low process ratio. The goal of lean manufacturing is to aid in improving the satisfaction of customer requirements through the whole value stream. The basic philosophy is that more the inventory longer the lead time, therefore the reduction of lead-time and inventory will expose and force other kinds of wastes to surface, creating the opportunity for their removal. On the map the proposed lean tools are highlighted .In addition to that the Kaizen
burst are highlighted at the improvement area. In order to address these issues, the appropriate lean tool such as cellular layout, single piece flow, kaizen, TPM, supermarket and 5s are utilized to minimize the WIP and process lead time. While developing the future state mapping these tools is systematically incorporated into the system.
Creating Cellular Layout
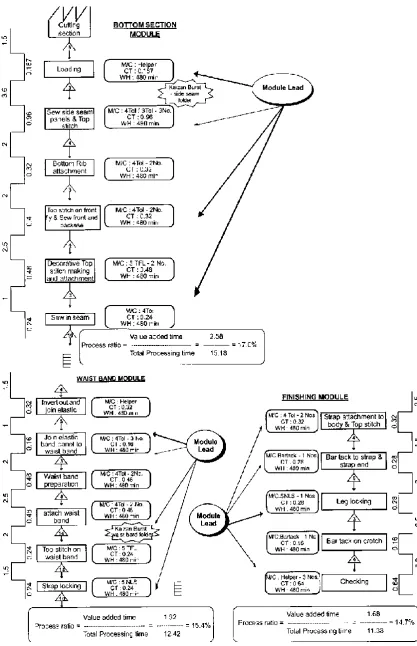
The cellular layout is suggested in this research for achieving lowest WIP between the operations, cost effectiveness, operator skill enhancement as well as to minimize the production lead time. Some of the non-value added (NV)operations were removed from the existing VSM and few of the other operations were combined together to minimize the cycle time and operator involvement as the table 2.
Table 2: List of Operations in current VSM is removed or combined with others
completely removed operations from current VSM Operations which Merged with other Suitable Operation
quality checking points shoulder cut mark thread cut raw edge cut
Sew the side seam panels and top stitch on the side top stitch on the front fly and sew the front and back rise decorative top stitch making and decorative top stich
attachment
invert out operation and elastic join operations
A super market (lean tool) area would be
supermarket will balance the flow between the first cell to second cell by keeping some buffer WIP. Accordingly, if the inventory exceeds the supermarket buffer limit, immediately the previous cell production should be stopped. In the same line similar
super market is allotted between second cell to third cell for maintaining the buffer WIP. The revised VSM Date table is indicated as table 2,3,4.
Available online at www.managementjournal.info
Table 2: Module-1-bottom section module
Pro cess
No.
Process Types of Sewing
Machine
cycle
time SMV
Calculate d Producti on /Hour WIP betwe en opera tion No of Mach ines /Help ers No n Val ue add ed tim e No of Operator/ helpers allotted Actual . Prod./ Hour
1 Loading HELPER 0.1872 0.234 256.41026 5 1 1.5 1 210
2 Sew side seam panels & Top Stitch on the side seam
4TOL/3TOL 0.96 1.2 150 3 3 3.6 2 145
3 Bottom Rib attachment 4TOL 0.32 0.4 150 4 1 2 2 181 4 Top Stitch on front fly
& Sew the front and back rise
4TOL 0.4 0.5 240 3 2 2 1 210
5 Decorative Top Stitch making and attachment
5TFL 0.48 0.6 150 4 1.5 2.5 1 210
6 Sew in seam 4TOL 0.24 0.3 200 3 1 1 1 152
TOTAL 3.234 9.5 12.6 8 1108
Avg. Prod./ hour 184
Table 3: Module-2-Waist band section
Process
No. Process
Types of Sewing Machin e cyc le tim e SM V Calcula ted Produc tion /Hour WIP betwe en operat ion
No of Machi nes /Helpe rs Non Val ue add ed tim e
No of
Operator/he lpers allotted Actual. Prod./H our
1 Invert out & Join
elastic HELPER 0.32 0.4 150 4 1 1.5 1 145
2 Join elastic band panel
to waist band 4TOL 0.16 0.2 900 5 3 1 1 142
3 Waist band preparation 4TOL 0.4 8
0.6 200 3 2 2 1 175
4 attach the waist band 4TOL 0.4
8 0.6 200 4 2 2.5 1 176
5 Top stitch on waist band
5TFL 0.2 4
0.3 200 6 1 2 1 182
6 Strap end locking SNLS 0.2 4
0.3 200 4 1 1.5 1 186
TOTAL 2.4 10 10.5 6 1006
Avg. Prod./
Table 4: Module-3-finishing module
Process
No. Process
Types of Sewi
ng Mach
ine cyc
le tim e
SM V
Calcula ted Produc
tion /Hour
WIP betwe
en operat
ion
No of Machi nes /Helpe
rs
Non Val
ue add ed tim e
No of Operator/h
elpers allotted
Actual. Prod./H our
1 Strap attachment to body and top stitch
4TOL 0.3 2
0.4 225 5 1.5 2.5 1 184
2 Bar tack to strap and strap
end bar tack 0.28 0.35 171.42857 4 1 1.5 1 165
3 Leg locking SNLS 0.2
8 0.35 171.42857 5 1 2 1 162 4 Bar tack on crotch bar
tack 0.16 0.2 150 3 0.5 0.5 1 142 5 end line inspection Helpe
r
0.6 4
0.8 187.5 4 2.5 3.2 2 143
TOTAL 2.1 6.5 9.7 6 796
Avg. Prod./
hour 160
Findings
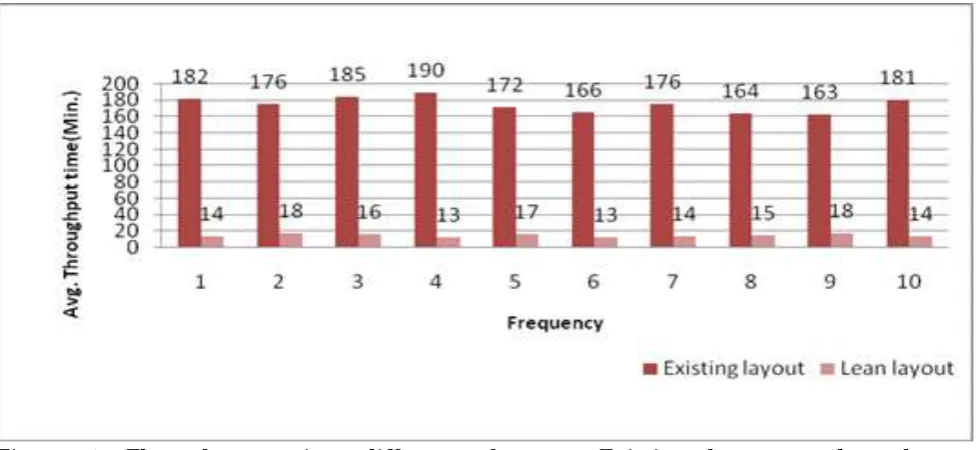
Throughput Time
The snap study is conducted at ABC Ltd. on daily basis for measuring the throughput time in the current PBS production layout to lean layout. In the existing batch production
system, the throughput time for all the selected product line is 6 hours. Whereas this time is less than an hour in case of Cellular layout. The following Graphical representation confirms the same.
Figure 4: Through put time difference between Existing layout to lean layout
Cycle Time
A focused research is done on analysing the cycle time between after and before lean implementation . As compared with current production system the SMV in the lean layout is reduced significantly. In the lean layout, the reduced SMV has been achieved by merging some of the operation (as
Available online at www.managementjournal.info
Figure 5: Cycle time difference between in current VSM to revised VSM
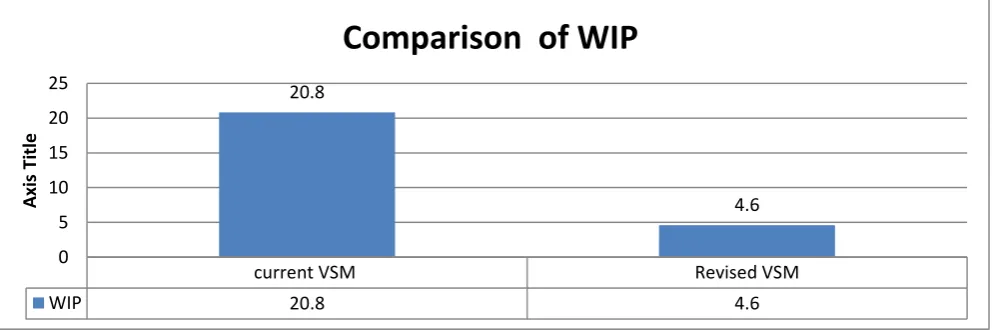
Work in Progress
To analysis the average WIP changes before and after implementation of Lean system, the researcher has collected average WIP data for 7 working days during the production. As compared with current production system the WIP level
in revised module is reduced significantly. The following graph (Figure .6) indicates the level of reduction in cycle time between existing PBS layout to lean layout. for all four products
Figure 6 : WIP difference between in current VSM to revised VSM
Conclusions
The main goal of this research is to develop a general methodology to implement lean manufacturing tools and techniques in garment industry. It is understood that the goal of lean manufacturing is to become highly responsive to customer demand while producing quality products in the most efficient and economical manner by reducing various waste in human effort,
inventory, time to market and
manufacturing space.
Restructuring is done on sewing room specifically by VSM analysis. Value stream mapping is an ideal tool used for
understanding the process waste in a value stream and used to identify other suitable lean tool for process improvement. The development of future state map is not the end of asset of value stream activities. It should be stressed that the value stream should be revisited until the future becomes the present.
The problem of low flexibility is eliminated by cellular layout. Since this layout produce very low WIP inside the process, the product line can be changed immediately if needed. This helps to make different kinds of products in the same
production line depending upon
requirements.
current VSM Revised VSM
WIP 20.8 4.6
20.8
4.6
0 5 10 15 20 25
A
xi
s
Ti
tle
Comparison of Cycle time
current VSM Revised VSM
WIP 20.8 4.6
20.8
4.6
0 5 10 15 20 25
A
xi
s
Ti
tle
References
1. Heda R, Narag AS, Singla ML (2002) Apparel manufacturing a strategy for productivity improvement’, Journal of Fashion Marketing and Management, 7(1):12-22.
2. Lucy Daly MB, Towers N (2004) Lean or Agile: A Solution for Supply Chain Management in the Textile and Clothing Industry’. International Journal of Operations & Production Management, 24(2):151-170.
3. Singh B, Sharma SK (2009) Value stream mapping as a versatile tool for lean implementation: An indian case study of a manufacturing firm, Measuring Business Excellence,13(3):58-68.
4. Drew J, McCallum B, Rogenhofer S (2004) Journey to lean –making Operational change stick’, Hampshire:Pallgrave macmillan. 5. Womack JP, Jones DT, Roos D (1990) The
machine that changed the world: The story of lean production”. New York: Simon & Schuster.
6. Sohal AS, Egglestone A (1994) Lean Production: Experience among Australian Organization, International Journal of Operations & Production Management,14(11):35-51.
7. Womack JP, Jones DT (2003) Lean thinking: Banish waste and create wealth in your corporation’, 2nd edition, Simon and Schuster Inc, London, UK, pp.15-90.
8. Rother M, Shook J (1999) Learning to see: Value stream mapping to add value and eliminate muda’, 2nd Edn., Brookline, MA: The Lean enterprise institute.
9. Mehmet C. Kocakulah, Jason F. Brown, Joshua W. Thromson (2008) Lean manufacturing principles and their application’, Cost Management, p. 16.
10. Lasa IS, Laburu, CO, Vila RC (2008) An evaluation of the value stream mapping tool, Business Process Management Journal, 14(1):39-52.
11. Silva SKPN (2012) Applicability of Value Stream Mapping (VSM) in the Apparel Industry in Sri Lanka’, International Journal of Lean Thinking, 3(1):36-41.
12. Senthil Kumar B, Sampath VR (2012) Garment Manufacturing through Lean Initiative - AnEmpirical Study on WIP Fluctuation in T-Shirt Production Unit’, European Journal of Scientific Research, 73(2):235-244.
13. Nicoletti S, Nicosi AG (1998) Group Technology with flow shop cells’, University of Roma, Itally.
14. Farwaz A. Abdulmalek, Jayant Rajgopal (2007) Analysing the benefits of lean manufacturing and value stream mapping via simulation: A process sector case study’ International Journal Production Economics, p.223-236.
15. Boughton NJ, Arokiam IC (2000) The application of cellular manufacturing: a regional small to-medium enterprise perspective, Proceedings of Institutional of Mechanical Engineers, 214(8):751-754. 16. Da Silveira G, Borenstein D, Fogliatto (2001)
Mass customization: literature review and research directions’. International Journal of Production Economics, 72:1-13.
17. Van der Zee DJ, Slomp J (2009) Simulation as a tool for gaming and training in operations management-A case study, Journal of Simulation, 3:17-28.
18. Ortiz C (2006) All out kaizen, Industrial Engineer IE,38(4):30-34.
Available online at www.managementjournal.info