© 2019 by the Serbian Biological Society How to cite this article: El Yamani M, Sakar EH, Boussakouran A, Rharrabti Y. 123 Physiological and biochemical responses of young olive trees (Olea europaea L.) to water stress during flowering. Arch Biol Sci. 2019;71(1):123-32.
Physiological and biochemical responses of young olive trees (
Olea europaea
L.) to water
stress during flowering
Mohamed El Yamani, El Hassan Sakar, Abdelali Boussakouran and Yahia Rharrabti*
Laboratory of Natural Resources and Environment, Polydisciplinary Faculty of Taza. Sidi Mohamed Ben Abdellah
University, Morocco
*Corresponding authors: [email protected]
Received: October 1, 2018; Revised: November 23, 2018; Accepted: November 23, 2018; Published online: December 4, 2018
Abstract: This study examines physiological and biochemical changes in three Moroccan varieties of young olive trees
(Olea europaea L.) grown under three different water regimes (control, moderate stress and severe stress). Leaf relative
water content (RWC), water potential (Ψw), transpiration rate (E), stomatal conductance (gs), maximum quantum effi-ciency of PSII (Fv/Fm), the contents of total chlorophyll (TCC), proline (ProC) and soluble sugars (SSC) were measured at the flowering stage during three growing seasons (2015, 2016 and 2017). ANOVA analyses showed that the effect of the water regime was predominant in all of the examined parameters, except for Fv/Fm, which was under the effect of both water regime and growing season. Impacts of variety and interactions were of lesser magnitude. Water deficit reduced E, Ψw and gs by 25%, while its effect on RWC and Fv/Fm was a decrease of about 7%; however, increases in SSC and ProC were more than 10%. Among the growing seasons, 2015 flowering displayed the lowest values for RWC, Ψw, E, gs, TCC and Fv/Fm, and the highest for ProC and SSC. Among plant varieties, no significant differences were observed. The three principal component (PC) axes accounted for 91% of total variance. PC1 was better explained by the water regime, while the growing season fitted PC3 variability. Correlation studies highlighted significant associations between most parameters. Positive relationships were found between RWC, Ψw, E, gs, Fv/Fm and TCC, while all of these parameters were negatively linked to ProC and SSC.
Keywords:Olea europaea L; water deficit; ecophysiology; proline; soluble sugars
INTRODUCTION
Olive is the major fruit tree in Morocco with a growing acreage of 920000 ha. Because of its adaptation to vari-ous bioclimatic zones, it is found nationwide (on more than 57% of the orchard area), except along the Atlantic coastal strip. Olive growing is the main activity in Taza province (northern Morocco), accounting for 36% of the total agricultural land and 9% of the national olive orchards. “Moroccan Picholine” is the main plant variety grown in the region and in the whole country where it represents more than 96% of olive genetic resources. The remaining 4% consists of other olive varieties (“Ar-bequina”, “Dahbia”, “Meslala” and “Picual”) and clones of Moroccan Picholine (“Haouzia” and “Menara”) [1].
The scarcity of water resources is of crucial impor-tance in agricultural farming systems because of in-creasing population demands as well as higher drought
frequency and severity as the consequence of climate change. Another point of weakness of olive culture in Morocco is the dominance of monovarietal orchards (Moroccan Picholine) with low planting densities and higher susceptibility to diseases [2].
The olive tree is known as drought-tolerant and is traditionally grown under severe conditions, but it responds well to irrigation. The effectiveness of water use in response to limited resources is often assessed by the water status, gas exchange and some biochemi-cal changes. Several studies have been conducted on young trees growing in pots to assess their behavior in stressed environments [3-7].
opening as adaptation strategies to water deficit [8-10]. Stomatal control is the main factor in the optimization of water use [11]. In fact, closure of stomata can reduce excessive water loss under stress conditions [12]. The regulation of gas exchanges and biochemical behavior in olive plants as tools for tolerance to water stress has also been described in various studies [13-15]. Proline and sugars act as osmolytes facilitating the retention of water in the cytoplasm, hence preventing membrane damage [16-18]. Olive plants exposed to water stress induce degradation of photosynthetic pig-ments [5,13,19] and reduction of the efficiency of PSII photochemistry Fv/Fm [20]. Fv/Fm is widely used to assess drought and frost tolerance in Triticum durum, Olea europaea and Prunus dulcis [21-23].
Therefore, the objectives of the present study were to investigate plant water status, stomatal conductance, transpiration rate, chlorophyll content, chlorophyll fluorescence and accumulation of proline and soluble sugars in three Moroccan olive varieties (Moroccan Picholine, Menara, and Haouzia) grown in northern Morocco under different levels of water deficit at the flowering development stage during three growing seasons (2015, 2016 and 2017).
MATERIALS AND METHODS
Plant material and experimental design
The study was carried out with two-year-old self-rooted olive plants (Olea europaea L.) belonging to three Moroccan varieties (Moroccan Picholine, Menara and Haouzia) for three consecutive growing seasons (2015, 2016 and 2017). The work was conducted at the experimental station of the Polydisciplinary Faculty of Taza (northern Morocco) (34°12’36” N, 3°52’0” W). The region is characterized by a Mediterranean climate, humid winters and semi-arid summers. Total annual rainfall in the 2015 season was 353 mm, with an average temperature of 19.8°C; the 2016 season was marked by a total precipitation of 593 mm and an aver-age temperature of 20.4°C; for the third season (2017), the total annual rainfall and the average temperature were 297 mm and 19.3°C, respectively.
Throughout the experimental period (second half of April), during the flowering stage of the 2015 season,
average minimum and maximum temperatures were 12.7 and 24.2°C, respectively. For the same period of the 2016 season, the average minimum and maxi-mum temperatures were 11.7 and 23.3°C, respectively. Concerning the flowering period of the 2017 season, the temperatures ranged from the average minimum of 9.7°C to the maximum of 24.3°C. No rainfall was recorded in the experimental period during the three seasons.
Thirty-six olive plants were grown outdoors under ambient conditions with natural sunlight and tem-perature, in plastic 10-L pots filled with a mixture of field soil, peat and sand (2:2:1, v/v/v) in a completely randomized bloc design to minimize the effects of environmental heterogeneity, with three water regimes and four replicates. The 36 plants were separated into three groups (each consisting of 12 plants) and exposed to three water regimes during 12 days. Before starting the experiment, all plants were irrigated until the pots were saturated and water was allowed to flow freely through the holes in the bottoms of the containers.
Twelve pots of each cultivar were watered twice a week to field capacity (≈800 mL) and represented the control and well-watered plants (T100). Twelve pots received half the water needed to maintain the soil at field capacity in order to simulate moderate plant water stress (T50). Another 12 pots were not irrigated dur-ing the water treatment period and these plants were under severe water stress (T0). The amount of water added at each watering (determined every treatment day by weighing the pots before and after irrigation), combined with the size of the containers, allowed for a negligible loss through the bottoms of the containers [13]. All the measurements were performed just after the end of the experimental period.
Plant water status determination
fresh weight (FW) was determined immediately after cutting. To obtain the turgid weight (TW), leaves were weighed after immersion in distilled water inside glass tubes for 48 h in dim light at 4°C. At the end, the dry weight (DW) was obtained after drying in a preheated oven at 80°C for 48 h [25]. RWC was calculated as:
Determinations of stomatal conductance (gs) and transpiration rate (E) were made in one leaf per plant with four replicates for each olive variety at midday because of the importance of water limitation effects in olive plants compared to the morning [14]. Measure-ments were carried out using a portable Infrared Gas Analyzer (LCi, ADC BioScientific Ltd. Hoddesdon, Herts, UK).
Determination of the total chlorophyll content and chlorophyll fluorescence
Leaf sections (250 mg) were ground in 80% acetone, and the total chlorophyll content (TCC) was determined as described by Arnon [26], using the following equation:
Chlorophyll fluorescence was measured at 12:00-13:00 with a portable fluorometer (OS-30p, Opti-Science Inc., Hudson, NH, USA). Intact leaves were dark-adapted for at least 20 min using leaf clips. Maxi-mum fluorescence in light (Fm) was then measured after applying a saturating actinic light pulse of 3.000 µmol m-2 s-1 for 0.8s. F0 and Fm were used to calculate
variable fluorescence (Fv=Fm-F0) and maximum quantum efficiency of PSII (Fv/Fm).
Determination of proline and soluble sugar
The proline content (ProC) was determined by the method of Troll and Lindsey [27], which was stream-lined and developed further by Monneveux and Nem-mar [28]. A sample of 40% methanol (2 mL) was added to 100 mg of the fresh leaf material, followed by homogenization and boiling for 1 h in a water bath at 85°C. After cooling, 1 mL of the extract was added to 1 mL of acetic acid, 25 mg of ninhydrin and 1 mL
of the reagent mixture (120 mL distilled water, 300 mL acetic acid and 80 mL orthophosphoric acid), and boiled for 30 min. After cooling the mixture, 5 mL of toluene was added. After shaking several times, the upper phase was recovered, to which a spatula of anhydrous Na2SO4 was added. Absorption at 528 nm was read using spectrophotometer (Jenway Model 6100, Dunmow, Essex, UK) with toluene as a blank. The proline content was calculated using L-proline for the standard curve.
The soluble sugars content (SSC) was determined according to the method of Robyt and White [29] with some modifications. Leaf fresh tissue (100 mg) was mixed with a 5-mL aliquot of 80% methanol and boiled at 70°C for 30 min. After cooling the mixture, a 1-mL aliquot of the extract was mixed with 1 mL of phenol and 5 mL of concentrated sulfuric acid. After agitation and cooling of the reagent mixture, the absor-bance at 640 nm was read using methanol as a blank. The concentration of soluble sugars was calculated by referring to a glucose solution as a standard curve.
Statistical analysis
Combined analyses of variance (ANOVA) were car-ried out over varieties, water regimes and growing seasons. Least significant difference (LSD) values were calculated at the 5% probability level. Principal com-ponent analyses (PCA) were performed on the basis of a correlation matrix calculated on the mean data of all the replicates. Relationships between the studied parameters were established. The STATGRAPHICS Centurion XVII package (Stat point Technologies, Inc., Virginia, USA) was used for all the calculations.
RESULTS
The effect of different water regimes
more affected and their levels declined by more than 25%. However, increases were recorded for SSC and ProC by 10 and 13%, respectively.
The effect of different olive varieties
Among olive varieties, no significant difference was observed for RWC, gs, Fv/Fm and SSC, and can be seen in Table 1. The mean values measured were 90.66%, 0.07 mol m-2 s-1, 0.792 and 0.455 mmol/g FW for RWC,
gs, Fv/Fm and SSC, respectively, whereas, the other parameters were slightly affected by the genotype. Menara was characterized by the lowest value for Ψw
(-1.77 MPa) and the highest value for ProC (0.189 mmol/g FW). Haouzia displayed a considerable level of E (0.56 mmol m-2 s-1). The highest value of TCC
(0.887 mg g-1) was observed in Moroccan Picholine.
The effect of different growing seasons
Between seasons, a significant difference was observed, with the 2015 growing season showing the lowest values for the majority of parameters (RWC=90.00%, Ψw =-1.85 MPa, E=0.52 mmol m-2 s-1, gs=0.06 mol m-2 s-1,
TCC=0.849 mg g-1, and Fv/Fm=0.781), and the
high-est values for ProC and SSC (0.189 mmol/g FW and
Table 1. Mean values of leaf relative water content (RWC), water potential (Ψw), transpiration rate (E), stomatal conductance (gs), total chlorophyll content (TCC), maximum quantum efficiency of PSII (Fv/Fm), proline content (ProC) and soluble sugars content (SSC) in young olive plants grown under three different water regimes, T100 (control), T50 (moderate stress) and T0 (severe stress), at the flowering stage during three growing seasons (2015, 2016 and 2017).
Parameter RWC(%) ψw
(MPa) (mol.mgs-2.s-1) (mmol.mE -2. s-1) Fv/Fm (mggTCC-1) (mmol/g FW)ProC (mmol/g FW)SSC
Growing season
Flowering 2015 90.00 c -1.85 b 0.06 c 0.52 b 0.781 b 0.849 b 0.189 a 0.468 a
Flowering 2016 90.54 b -1.65 a 0.07 b 0.56 a 0.800 a 0.896 a 0.189 a 0.457 b
Flowering 2017 91.43 a -1.62 a 0.08 a 0.55 a 0.797 a 0.884 a 0.184 b 0.439 c
Plant variety
HAZ 90.70 a -1.68 a 0.07 a 0.56 a 0.793 a 0.879 ab 0.186 b 0.454 a
MEN 90.43 a -1.77 b 0.07 a 0.54 ab 0.791 a 0.864 b 0.189 a 0.456 a
PIM 90.84 a -1.68 a 0.07 a 0.53 b 0.794 a 0.887 a 0.187 ab 0.455 a
Water regime
T0 87.71 c -1.98 c 0.06 c 0.47 c 0.778 c 0.777 c 0.199 a 0.478 a
T50 90.57 b -1.72 b 0.07 b 0.54 b 0.794 b 0.884 b 0.189 b 0.454 b
T100 93.68 a -1.42 a 0.08 a 0.63 a 0.806 a 0.968 a 0.174 c 0.432 c
Means for each character followed by the same letter are not significantly different according to the LSD test at P<0.05
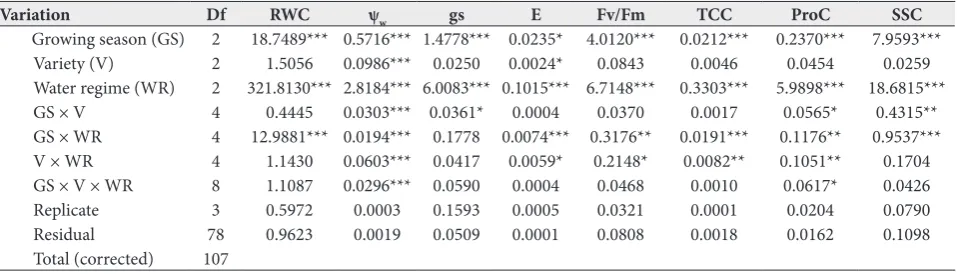
Table 2. Analysis of variance for leaf relative water content (RWC), water potential (Ψw), transpiration rate (E), stomatal conductance (gs), total chlorophyll content (TCC), maximum quantum efficiency of PSII (Fv/Fm), proline content (ProC) and soluble sugars content (SSC) in young olive plants grown under three different water regimes, T100 (control), T50 (moderate stress) and T0 (severe stress), at the flowering stage during three growing seasons (2015, 2016 and 2017).
Variation Df RWC ψw gs E Fv/Fm TCC ProC SSC
Growing season (GS) 2 18.7489*** 0.5716*** 1.4778*** 0.0235* 4.0120*** 0.0212*** 0.2370*** 7.9593***
Variety (V) 2 1.5056 0.0986*** 0.0250 0.0024* 0.0843 0.0046 0.0454 0.0259
Water regime (WR) 2 321.8130*** 2.8184*** 6.0083*** 0.1015*** 6.7148*** 0.3303*** 5.9898*** 18.6815***
GS × V 4 0.4445 0.0303*** 0.0361* 0.0004 0.0370 0.0017 0.0565* 0.4315**
GS × WR 4 12.9881*** 0.0194*** 0.1778 0.0074*** 0.3176** 0.0191*** 0.1176** 0.9537***
V × WR 4 1.1430 0.0603*** 0.0417 0.0059* 0.2148* 0.0082** 0.1051** 0.1704
GS × V × WR 8 1.1087 0.0296*** 0.0590 0.0004 0.0468 0.0010 0.0617* 0.0426
Replicate 3 0.5972 0.0003 0.1593 0.0005 0.0321 0.0001 0.0204 0.0790
Residual 78 0.9623 0.0019 0.0509 0.0001 0.0808 0.0018 0.0162 0.1098
Total (corrected) 107
0.468 mmol/g FW, respectively). No differences were recorded between 2016 and 2017 seasons (Table 1).
Data variability
Results of the combined ANOVA (Table 2) showed that the effect of different water regimes was predominant and accounted for more than 65% of the observed vari-ance for E, gs, Ψw, and SSC, while its impact was around 90% for RWC, TCC, and ProC. Fv/Fm was affected by both water regime (58%) and growing season (35%). The influence of growing season on other parameters did not explain more than 28% of total variance. Plant variety effect was of a very minor magnitude. Among interactions, only the water regime×growing season effect was pronounced for E (10% of total variance).
Relationships between parameters
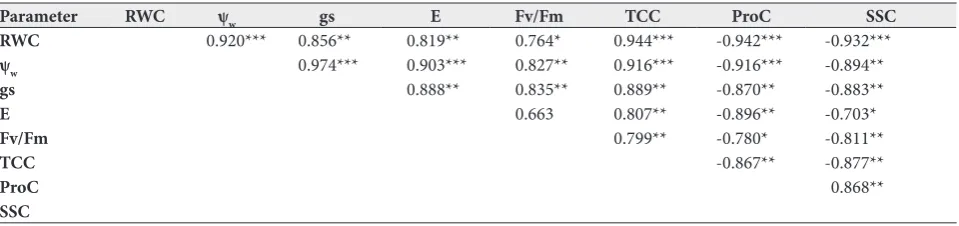
Relationships between all parameters, when well-watered and stressed plants were pooled together, are shown in Table 3. RWC, Ψw, E, gs, Fv/Fm and TCC decreased to statistically the lowest values (p<0.05) in stressed olive plants for the three varieties compared to those recorded in irrigated ones. The opposite (in-crease) was observed for SSC and ProC.
Positive correlations were found between RWC, Ψw, E, gs, Fv/Fm and TCC, while all these parameters were negatively associated to ProC and SSC. The strongest and most significant relationship (r=-0.974***) was observed between Ψw and gs; gs was also highly cor-related with E (r=-0.903***), TCC (r=-0.916***) and
ProC (r=-0.916***). RWC was very positively associated to TCC (r=-0.944***) and Ψw (r=-0.920***), while its correlations with ProC and SSC were highly negative (r=-0.942*** and r=-0.932***, respectively). In fact, the lower the values of RWC and Ψw, the higher the accumulation of ProC and SSC and the slower the sto-matal recovery, and consequently a great economy of transpired water. The young olive plants had better gs, higher TCC and lower Fv/Fm at higher levels of RWC.
Principal component analysis
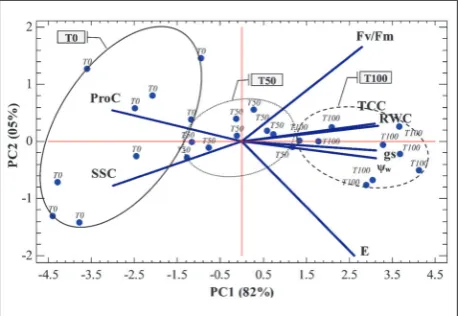
PCA was performed on the correlation matrix based on mean values in order to establish the combination of each factor with the studied parameters. Results showed that the first three PC axes explained about 91% of the total observed variability: 82%, 5% and 4% for axis 1 (PC1), 2 (PC2) and 3 (PC3), respectively (Figs. 1 and 2).
PC1 clearly separated E, gs, RWC, Ψw, Fv/Fm and TCC in the positive direction from SSC and ProC in the opposite direction. On PC2, the observed varia-tion was caused mainly by Fv/Fm and ProC, which appeared jointly on the right side, and both E and SSC on the left side. For the third axis (PC3), it allowed discrimination between E, Fv/Fm, E and Ψw towards the upper side and both RWC and TCC downwards.
The water regime means plotted on the same plan determined by the two first axes are grouped in clusters. PC1 allowed clear separation between T100 with higher values of E, gs, RWC, Ψw and TCC in the
Table 3. Correlations between leaf relative water content (RWC), water potential (Ψw), transpiration rate (E), stomatal conductance (gs), total chlorophyll content (TCC), maximum quantum efficiency of PSII (Fv/Fm), proline content (ProC) and soluble sugars content (SSC) in young olive plants grown under three different water regimes, T100 (control), T50 (moderate stress) and T0 (severe stress), at the flowering stage during three growing seasons (2015, 2016 and 2017).
Parameter RWC ψw gs E Fv/Fm TCC ProC SSC
RWC 0.920*** 0.856** 0.819** 0.764* 0.944*** -0.942*** -0.932***
ψw 0.974*** 0.903*** 0.827** 0.916*** -0.916*** -0.894**
gs 0.888** 0.835** 0.889** -0.870** -0.883**
E 0.663 0.807** -0.896** -0.703*
Fv/Fm 0.799** -0.780* -0.811**
TCC -0.867** -0.877**
ProC 0.868**
SSC
positive direction, T0 that interacted with SSC and ProC in the negative direction and T50 which was centered on the first axis with intermediate values for all parameters (Fig. 1).
Fig. 2 shows the projected points related to grow-ing seasons on the surface delimited by PC1 and PC3. PC3 discriminates between 2016 and 2017, which are located on the positive side, and 2015 which is on the negative side. Flowering in 2016 and 2017 was asso-ciated with higher values of E, Fv/Fm, ProC and Ψw in the positive direction, whereas flowering in 2015 interacted mainly with high amounts of SSC toward the negative direction.
No discrimination was observed when the points were projected relative to the varieties.
DISCUSSION
Results from the present work showed that all studied parameters were mainly under the effect of water re-gime. Significant reductions in RWC, Ψw, gs, E, TCC and Fv/Fm and increases in ProC and SSC were observed after subjecting young olive plants to water deficit. These findings are consistent with results of other studies that confirmed the changes caused by water stress in a number of physiological and biochemical
parameters that regulate drought tolerance and growth in plants [7,15,30-34]. Ben Ahmed et al. [32] reported a reduction in RWC, Ψw, gs and E of 32% and 51%, 43% and 48% respectively, in “Chemlali”, “Meski” and “Picholine” olive varieties under water deficit treatment. The same authors reported that water-stressed olive plants tended to accumulate proline and soluble sugars and to lose an amount of chlorophyll. The decline in RWC, E and gs, accompanied by an increase in soluble sugar in olive plants subjected to drought stress was also observed by Ben Abdallah et al. [15]. Boussadia et al. [35] noted a significant increase in proline and carbohydrate levels in the leaves of “Koroneiki” and “Meski” olive varieties under water stress.
Reductions in TCC associated with parallel de-creases in RWC and Ψw were previously documented and could be attributed to the sensitivity of this pig-ment to water deficit [5,13,19,25,36]. However, no impact of drought stress on TCC was observed by Ben Abdallah et al. [15]. The same authors also reported no significant effect on Fv/Fm, whereas a slight de-crease in Fv/Fm in “Chétoui” olive leaves was shown by Guerfel et al. [20]. Boussadia et al. [37] reported that exposure of olive trees to drought stress led to a significant effect on Fv/Fm.
Tognetti et al [38] reported a close positive relation-ship between gs and ψw that points to a great resilience
Fig. 1. PCA projections on axes 1 and 2 accounting for 87% of total variance. Eigenvalues of the correlation matrix are symbol-ized as vectors representing parameters that most influence each axis. The 27 points representing parameter means for each water regime (T00 – unstressed, T50 – moderate stress, T0 – rainfed) are plotted on the plane determined by axes 1 and 2. Artwork was created using The STATGRAPHICS Centurion XVII package (Stat Point Technologies, Inc., Virginia, USA).
of stomatal functioning in dehydration, so that relatively high values of gs can be maintained for a range of soil moisture. A significant negative relationship was deter-mined between gs and RWC, demonstrating the response of gs to decreasing RWC and water potential [35,39]. These types of relationships suggest that a hydraulic feedback mechanism exists between water characteristics and physiological parameters of olive trees under stress [40]. An important sensitivity of TCC to RWC and ψw variation was shown by Boughalleb and Hajlaoui [19]. Sofo et al. [41] and Boussadia et al. [35] observed a negative correlation in olive leaves between RWC and ψw on the one hand, and ProC and SSC on the other , which could be considered as an adaptive strategy to conserve water in cells and avoid membrane damage.
The changes in physiological and biochemical parameters represent the adaptive mechanisms to water deficit. In fact, olive trees rapidly adjusted to the water flux by closing their stomata and therefore increasing their stomatal resistance to restrict water loss by transpiration through leaves [12]. Chaves [42] noted stomatal control of water loss as an early response of plants to water deficit. As drought progresses, sto-matal closure occurs for longer periods of the day, reducing daily water loss at the time of the highest evaporative demand [43]. This is in relation with the soil water potential that controls significantly stomatal conductance [44].
Water stress conditions also negatively influenced olive leaf transpiration rate (E) and stomatal conduc-tance (gs). Khan et al. [45] reported that drought re-duces E and increases water use efficiency to maintain vegetative growth and productivity by inducing plant stomatal closure.
Our data showed a positive relationship between RWC and ψw in olive leaves, indicating that RWC is a good estimate of plant water status. The same finding was previously reported by Dichio et al. [33] and Lo Bianco et al. [6]. Moriana et al. [46] recommended ψw as a useful tool for monitoring the response of the water status of olive plants to irrigation.
Osmotic adjustment in olive leaves is another adap-tive mechanism in severe conditions [11,35,47-49]. It may depend on both active synthesis and accumulation of osmolytes within cells, and water loss from cells,
which leads to increased osmolyte concentration [34]. In our case, a significant increase in ProC was observed in young T0 and T50 olive plants as compared to the controls (T100). In addition, accumulation of this osmolyte was negatively correlated to RWC and ψw. Sofo et al. [41] found a negative correlation between ψw and ProC and noted a completely active osmotic adjustment due to the accumulation of ProC for values of ψw below -3.2 Mpa, which allowed for water con-servation in tissues. Under drought conditions, ProC accumulation is a key component of cell osmoregula-tion [50]. Ain-Lhout et al. [18] stated that proline has a protective action that prevents membrane damage and protein denaturation during severe drought stress. Our findings for SSC are in agreement with Bous-sadia et al. [35] who reported an increase in SSC after 20 days of drought stress in “Koroneiki” leaves, with an important negative correlation with RWC. Ac-cumulation of carbohydrates to maintain cell turgor has also been observed in olive under short-term (15 days) water deficit [33]. Van den Ende and Valluru [51] showed the important role of soluble sugars in osmotic adjustment and cell protection by inducing direct detoxification processes of reactive oxygen species or by stimulating indirectly the antioxidative defense system. Cultivars with low photosynthetic activity tend to synthesize more soluble sugars in order to maintain the translocation of assimilates such as sugars to the growing parts [32].
The decrease in TCC is a typical symptom of oxida-tive stress and could be due to pigment degradation, chlorophyll synthesis deficiency and changes in thy-lakoid membrane structure [52-53]. The degradation of the photosynthetic apparatus in the leaves exposed to extended water deficit aimed to mobilize resources for the production of new acclimated leaves [54]. Our experiments revealed a decrease in the ratio Fv/Fm after the exposure of leaves of young olive trees to drought stress, which reflects the maximum efficiency of PSII photochemistry. The decreases in Fv/Fm can be ascribed to the downregulation of PSII that reflects the protective or regulatory mechanism that maintains electron transport and avoids photodamage of the photosynthetic apparatus [20,37,55].
same genetic pool as Haouzia and Menara, which are considered clones of Moroccan Picholine. In contrast, a significant genotypic difference was found between Tunisian cultivars (“Chemlali” and “Chetoui”) in re-sponse to water tress; the difference in rere-sponses was explained by the morphological and structural char-acteristics of the leaves [35]. Some differences among olive cultivars have been observed concerning their ability for adaptation and production under drought conditions [4,56-57].
The flowering period 2015 was marked by higher temperatures compared to 2016 and 2017 seasons. This could explain the difference observed in parameters between the three seasons. In fact, the young olive trees were more sensitive to the water deficit at the flower-ing period in 2015 when the climatic conditions were more severe. Fernández et al. [12] and Moriana et al. [14] noted that under conditions of high temperature, olive plants can reduce excessive water loss by closing their stomata and accumulating osmolytes to facilitate the retention of water and prevent membrane damage.
The variation in water status, physiological and bio-chemical parameters and the close correlations observed between them indicated that olive plants were capable of restricting excess water loss through transpiration and preventing an excessive drop in water potential by modulating stomatal closure and regulating synthesis and accumulation of osmolytes at different levels of drought stress. The same relationships were established for olive trees by several studies [35,37-38,41].
CONCLUSIONS
Our results showed that water deficit induced different physiological and biochemical mechanisms in young olive trees (Moroccan Picholine, Menara and Haouzia) at the flowering stage. Water loss by transpiration was modulated by stomatal closure and minimized by the accumulation of proline and soluble sugars that en-hance the mechanical strength of the cell. Moroccan Picholine and Haouzia olive varieties are suitable for cultivation under drought conditions due to the high chlorophyll content and low proline accumulation.
Funding: This work was supported by internal funding from Sidi Mohamed Ben Abdellah University, Morocco.
Author contributions: M. El Yamani and Y. Rharrabti conceived and designed the experiments. M. El Yamani, E.H Sakar and A. Boussakouran performed the experiments and the acquisition, analysis and interpretation of data. M. El Yamani and Y. Rharrabti wrote the paper. Y. Rharrabti supervised the work.
Conflict of interest disclosure: The authors have declared that there are no potential conflicts of interest.
REFERENCES
1. PDA-Taza. Report of the Provincial Direction of Agriculture, Taza, Morocco; 2015. p. 1-5.
2. Lahrouni M, El Abbassi A, El Messoussi S. Olive tree growth dynamics under semi-arid conditions of AlHaouz region in Morocco. J Mater Environ Sci. 2015;6:2428-36.
3. Bongi G, Mencuccini M, Fontanazza G. Photosynthesis of olive leaves: effect of light, flux density, leaf age, temperature, peltates, and H2O vapour pressure deficit on gas exchange. J Am Soc Hortic Sci. 1987;112:143-8.
4. Chartzoulakis K, Patakas A, Bosabalidis AM. Changes in water relations, photosynthesis and leaf anatomy induced by intermittent drought in two olive cultivars. Environ Exp Bot. 1999;42:113-20.
5. Bacelar EA, Santos DL, Moutinho-Pereira JM, Gonçalves BC, Ferreira HF, Correia CM. Immediate responses and adaptative strategies of three olive cultivars under contrast-ing water availability regimes: changes on structure and chemical composition of foliage and oxidative damage. Plant Sci. 2006;170:596-605.
6. Lo Bianco R, Scalisi A. Water relations and carbohydrate partitioning of four greenhouse-grown olive genotypes under long-term drought. Trees. 2017;3:717-27.
7. Trentacoste ER, Contreras-Zanessi O, Beyá-Marshall V, Puertas CM. Genotypic variation of physiological and mor-phological traits of seven olive cultivars under sustained and cyclic drought in Mendoza, Argentina. Agric Water Manage. 2018;196:48-56.
8. Xiloyannis C, Pezzarosa B, Jorba J, Angelini P. Effects of soil water content on gas exchange in olive trees. Adv Hortic Sci. 1988;2:58-63.
9. Fernández JE, Moreno F, Cabrera F, Arrue JL, Martín-Aranda J. Drip irrigation, soil characteristics and the root distribution and root activity of olive trees. Plant Soil. 1991;133:239-51.
10. Dichio B, Nuzzo V, Xiloyannis C, Celano G, Angelopoulos K. Drought stress-induced variation of pressure-volume relationships in Olea europaea L. cv. ‘‘Coratina’’. Acta Hort. 1997;449:401-9.
11. Giorio P, Sorrentino G, d’Andria R. Stomatal behaviour, leaf water status and photosynthetic response in field-grown olive trees under water deficit. Environ Exp Bot. 1999;42:95-104. 12. Fernández JE, Moreno F, Girón IF, Blázquez OM.
Sto-matal control of water use in olive tree leaves. Plant Soil. 1997;190:179-92.
of olive trees grown under different irrigation regimes. Plant Soil. 2007;292:1-12.
14. Moriana A, Villalobos FJ, Ferreres E. Stomatal and pho-tosynthetic responses of olive (Olea europaea L.) leaves to water deficits. Plant Cell Environ. 2002;25:395-405. 15. Ben Abdallah M, Trupiano D, Polzella A, De Zio E, Sassi M,
Scaloni A, Zarrouk M, Ben Youssef N, Scippa GS. Unravel-ing physiological, biochemical and molecular mechanisms involved in olive (Olea europaea L. cv. Chétoui) tolerance to drought and salt stresses. J Plant Physiol. 2018;220:83-95. 16. Sofo A, Dichioa B, Xiloyannisa C, Masia A.
Lipoxygen-ase activity and proline accumulation in leaves and roots of olive trees in response to drought stress. Physiol Plant. 2004;121:58-65.
17. Ashraf M, Foolad MR. Roles of glycine betaine and proline in improving plant abiotic stress resistance. Environ Exp Bot. 2007;59:206-16.
18. Ain-Lhout F, Zunzunegui FA, Diaz Barradas MC, Tirado R, Clavijio A, Garcia Novo F. Comparison of proline accu-mulation in two Mediterranean shrubs subjected to natural and experimental water deficit. Plant Soil. 2001;230:175-83. 19. Boughalleb F, Hajlaoui H. Physiological and anatomical
changes induced by drought in two olive cultivars (cv Zal-mati and Chemlali). Acta Physiol Plant. 2011;33:53-65. 20. Guerfel M, Ouni Y, Boujnah D, Zarrouk M. Photosynthesis
parameters and activities of enzymes of oxidative stress in two young ‘Chemlali’ and ‘Chetoui’ olive trees under water deficit. Photosynthetica 2009;47:340-6.
21. Elhani S, Rharrabti Y, García del Moral LF, Roca LF. Evo-lution of chlorophyll fluorescence parameters in durum wheat as affected by air temperature. CIHEAM-Opt Med. 2000;40:275-7.
22. Ben Abdallah M, Methenni K, Polzella A, Nouairi I, Zarrouk M, Ben Youssef N. Drought priming improves subsequent more severe drought in a drought-sensitive cultivar of olive cv. Chétoui. Sci Hort. 2017;221:47-52.
23. Sakar EH, El Yamani M, Rharrabti Y. Frost susceptibility of five almond [Prunus dulcis (mill.) D.A. Webb] cultivars grown in north-eastern Morocco as revealed by chlorophyll fluorescence. Int J Fruit Sci. 2017;17:415-22.
24. Scholander PF, Brandstreet ET, Hemmingsen EA, Hammel HT. Sap pressure in vascular plants. Science. 1965;148:339-46.
25. Guerfel M, Baccouri O, Boujnah D, Chaïbi W, Zarrouk M. Impacts of water stress on gas exchange, water rela-tions, chlorophyll content and leaf structure in the two main Tunisian olive (Olea europaea L.) cultivars. Sci Hort. 20009;119:257-63.
26. Arnon DI. Copper enzymes in isolated chloroplasts. Poly-phenoloxidase in Beta vulgaris. Plant Physiol. 1949;24:1-15. 27. Troll W, Lindsey J. A photometric method for the
determina-tion of proline. J Biol Chem.1995; 215:655-60.
28. Monneveux P, Nemmar M. Contribution à l’étude de la résistance à la sécheresse chez le blé tendre (Triticum aesti-vum L) et chez le blé dur (Triticum durum DESF). Étude de l’accumulation de la proline au cours du cycle de développe-ment. Agronomie. 1986;6:583-90.
29. Robyt JF, White BJ. Biochemical technique: theory and prac-tices. 2nd ed. Illinois: Waveland Press; 1987. 407 p. 30. Alexieva V, Sergiev I, Mapelli S, Karanov E. The effect of
drought and ultraviolet radiation on growth and stress mark-ers in pea and wheat. Plant Cell Environ. 2001; 24:1337-44. 31. Chartzoulakis K, Patakas A, Kofidis G, Bosabalidis A,
Nas-tou A. Water stress affects leaf anatomy, gas exchange, water relations and growth of two avocado cultivars. Sci Hort. 2002;95:39-50.
32. Ben Ahmed C, Ben Rouina B, Sensoy S, Boukhris M, Ben Abdallah F. Changes in gas exchange, proline accumulation and antioxidative enzyme activities in three olive cultivars under contrasting water availability regimes. Environ Exp Bot. 2009:67:345-52.
33. Dichio B, Margiotta G, Xiloyannis C, Bufo SA, Sofo A, Cataldi TRI. Changes in water status and osmolyte contents in leaves and roots of olive plants (Olea europaea L.) sub-jected to water deficit. Trees. 2009;23:247-56.
34. Pierantozzi P, Torres M, Bodoira R, Maestri D. Water rela-tions, biochemical - physiological and yield responses of olive trees (Olea europaea L. cvs. Arbequina and Manzanilla) under drought stress during the pre-flowering and flowering period. Agric Water Manage. 2013;125:13-25.
35. Boussadia O, Bchir A, Steppe K, Van Labeke MC, Lemeur R, Braham M. Active and passive osmotic adjustment in olive tree leaves during drought stress. Eur Sci J. 2013;9:423-39. 36. Younis ME, El-Shahaby OA, Abo-Hamed SA, Ibrahim
AH. Effects of water stress on growth, pigments and 14CO 2
assimilation in three sorghum cultivars. Agron Crop Sci. 2000;185:73-82.
37. Boussadia A, Ben Mariem F, Mechri B, Boussetta W, Braham M, Ben El Hadj S. Response to drought of two olive tree cul-tivars (cv Koroneki and Meski). Sci Hort. 2008;116:388-93. 38. Tognetti R, d’Andria R, Lavini A, Morelli G. The effect of
deficit irrigation on crop yield and vegetative development of Olea europaea L. (cvs. Frantoio and Leccino). Eur J Agron. 2006;25:356-64.
39. Lawlor DW. Limitation to photosynthesis in water-stressed leaves: stomata vs. metabolism and the role of ATP. Ann Bot. 2002;89:871-85.
40. Ben-Rouina B, Ben-Ahmed C, Athar HUR, Boukhriss M. Water relations, proline accumulation and photosynthetic activity in olive tree (Olea europaea L. cv. “Chemlali”) in response to salt stress. Pak J Bot. 2009;38:1397-406. 41. Sofo A, Manfreda S, Fiorentino M, Dichio B, Xiloyannis C.
The olive tree: a paradigm for drought tolerance in Medi-terranean climates. Hydrol Earth Syst Sci. 2008;12:293-301. 42. Chaves MM. Effects of water deficits on carbon assimilation.
J Exp Bot. 1991;42:1-16.
43. Jones HG. Plants and microclimate. A quantitative approach to environmental plant physiology. 3rd ed. Cambridge: Cam-bridge University Press; 1992. p. 428
44. Lu C, Zhang J. Effect of water stress on photosystem II pho-tochemistry and its thermostability in wheat plants. J Exp Bot. 1999;50:1199-206.
46. Moriana A, Pérez-López D, Prieto MH, Ramírez-Santa-Pau M, Pérez-Rodríguez JM. Midday stem water potential as a useful tool for estimating irrigation requirements in olive trees. Agric Water Manage. 2012;112:43-54.
47. Ashraf M, Harris PJC. Potential biochemical indicators of salinity tolerance in plants. Plant Sci. 2004;166:3-16. 48. Farooq M, Wahid A, Kobayashi N, Fujita D, Basra SMA.
Plant drought stress: effects, mechanisms and management. Agron sustainable dev. 2009;29:185-212.
49. Boughalleb F, Mhamdi M. Possible involvement of proline and the antioxidant defense systems in the drought tolerance of three olive cultivars grown under increasing water deficit regimes. Agric J. 2011;6:378-91.
50. Ben Hassine A, Ghanem ME, Bouzid S, Lutts S. An inland and a coastal population of the Mediterranean xero-halo-phyte species Atriplex halimus L. differ in their ability to accumulate proline and glycinebetaine in response to salinity and water stress? J Exp Bot. 2008;59:1315-26.
51. Van den Ende W, Valluru R. Sucrose, sucrosyl oligosaccha-rides and oxidative stress: scavenging and salvaging? J Exp Bot. 2009;60:9-18.
52. Smirnoff N. The role of active oxygen in the response of plants to water deficit and desiccation. New Phytol. 1993;125:27-58.
53. Brito G, Costa A, Fonseca HMAC, Santos CVV. Response of Olea europaea ssp. maderensis in vitro shoots exposed to osmotic stress. Sci Hort. 2003;97:411-7.
54. Büssis D, Kauder F, Heineke D. Acclimation of potato plants to polyethylene glycol-induced water deficit. I. Photosynthe-sis and metabolism. J Exp Bot. 1998;49:1349-60.
55. Demming-Adams B. Carotenoids and photoprotection in plants. A role for Xanthophyll zeaxanthin. Biochem Biophys Acta. 1990;1020:1-24.
56. Bosabalidis AM, Kofidis G. Comparative effects of drought stress on leaf anatomy of two olive cultivars. Plant Sci. 2002;163:375-9.