Electronic Communications of the EASST
Volume 34 (2010)
Guest Editors: Peter J. Clarke, Martina Seidl
Proceedings of the
6th Educators’ Symposium:
Software Modeling in Education at MODELS 2010
(EduSymp 2010)
Teaching Object-Oriented Modelling using Concept Maps
Ven Yu Sien
ECEASST
Teaching Object-Oriented Modelling using Concept Maps
Ven Yu Sien
HELP University College, Malaysia
Abstract: As one of the most important tasks in object-oriented analysis and design (OOAD) is the abstraction of the problem domain into specific concepts or objects, information technology (IT) students need appropriate skills of abstraction in order to identify the essential concepts and relationships within a problem domain. However students in higher education generally find difficulty performing abstractions of real-world problems within the context of OOAD.
Concept mapping is a popular tool used in education for facilitating learning, comprehension and the development of knowledge structures.We have successfully adopted concept maps as stepping-stones to assist students in constructing class and sequence diagrams. In this paper, we present a framework for teaching object-oriented (OO) modelling using concept maps. This framework – comprising four teaching modules – could be integrated into existing OOAD courses at the undergraduate or postgraduate level, and OOAD workshops to help software engineering educators resolve some of the difficulties they face in trying to teach OOAD. We also report results of an evaluative study on the effectiveness of integrating concept mapping techniques into an introductory OOAD course.
Keywords: abstraction, UML models, concept map, class diagram, sequence diagram
1
Introduction
Abstraction skills are especially important for solving complicated problems as they enable the problem solver to think in terms of conceptual ideas rather than their details [KH06]. Abstraction skills are also necessary for the construction of the various models, designs, and implementations that are required for a software system. As models are a simplification of reality that help us to understand and analyse large and complex systems, students must therefore possess the necessary abstraction skills to produce them [Kra07]. However, being able to understand what details are important to the problem is a difficult skill that requires a great deal of practice. Kramer [Kra07] believes that the reason why ‘some software engineers and computer scientists are able to produce clear, elegant designs and programs, while others cannot, is attributable to their abstraction skills’.
2
Background Review
Teaching OO Modelling using Concept Maps
share some common phases i.e., the requirements specification, analysis, design and implementation phases. Each phase produces deliverables that are required by other phases in the life cycle. During the OOAD phases, models are produced to show the type of information processing that is required of the new system. A model of an OO system is an abstract representation of the system. It represents the problem domain and emphasises some characteristics of the real-world. Modelling a system, however, requires the representation of different perspectives or views of the system and therefore there are different types of diagrams for modelling each of these views.
Cianchetta [Cia95] considers teaching the fundamental concept of identifying objects from the problem domain to be one of the most difficult tasks that he encountered when training OO developers. He found that even though object-oriented analysis (OOA) and object-oriented design (OOD) can be easily defined as ‘the modeling of a specific problem domain and a pragmatic solution for that domain’, the essential problem is ‘defining how one should go about modeling a problem domain and its practical, efficient, and cost-effective solution’.
Students at higher education institutions in general experience considerable difficulty understanding OO concepts and acquiring the necessary skills in OOAD. Svetinovic et al. [SBG06] investigated the different types of fundamental difficulty their students experienced when performing OOA. The analysis of the results was based on the specification artifacts produced as a result of the students’ OOA of a business system and observation of the students’ behavior. The most common errors committed by the students are:
assignment of a large business activity to a single object while it should be fulfilled through the collaboration with other objects;
missing responsibilities that should be assigned to objects;
missing objects that should participate in the overall responsibilities;
under-specified analysis models – the students were unable to identify most of the appropriate concepts; and
a large number of software concepts were identified at inconsistent abstraction levels.
Bolloju and Leung [BL06] conducted a study to identify errors produced by novice systems analysts in use case diagrams, use case descriptions, and class and sequence diagrams. The errors that they found in class diagrams were:
operations that had not been included in classes; misassigned operations;
incorrect multiplicities; misassigned attributes; and
incorrect usage of generalisation-specialisation hierarchies.
Some of the faults they found in sequence diagrams were: missing messages;
missing message parameters; missing objects; and
ECEASST
3 Proposed Concept-Driven Approach
In order to resolve some of the issues discussed in Section 2, we presented a concept-driven approach to introduce concept mapping as a tool to help students with OO modelling [SC07, SC08]. Concept mapping is a technique for representing the structure of information visually. It was developed by Joseph Novak [NC06] in 1972 at Cornell University and is commonly used for visualising relationships between concepts. Concept maps are two-dimensional, hierarchical diagrams that represent the structure of knowledge within a particular domain as nodes (or concepts) and connecting links. A concept is ‘an idea or notion that we apply to the things, or objects, in our awareness’ [MO95]. Concepts are related to each other by a link, and each link has a word or word-phrase describing the relationship between the concepts.
There are many inherent problems associated with modelling the problem domain with class and sequence diagrams – these are discussed in detail in Section 2. We do not claim that it is easy to model the problem domain by using concept maps. We do however consider that concept maps have the following advantages over class diagrams:
It is easier to distinguish between classes and attributes in concept maps by using specifically defined labelled links e.g., ‘has’.
It is easier to identify generalisation-specialisation hierarchies in concept maps by using specifically defined labelled links e.g., ‘is-a’.
Relationships between concepts that do not fall in the ‘is-a’ or ‘has’ categories are defined by an appropriate transitive verb from the case study.
Substantial guidelines to produce concept maps have been developed. These are defined in [SC07, SC08].
Concept maps help clarify the meaning of a concept by means of propositions [NC08]. It is relatively easy to teach concept maps. There are only two types of notations used in a
concept map – nodes and links [NC08].
We believe that a significant improvement in the way novices in OOAD analyse and design their OO systems can be achieved by adopting the proposed concept mapping techniques. Once novices have mastered these techniques, they will be able to effectively produce abstractions of real-world problems represented by OOAD models.
3.1 Static and Dynamic Concept Maps
Teaching OO Modelling using Concept Maps
If the type of relationship between two concepts does not fall into the first two relationship categories, then it is considered to be an association.
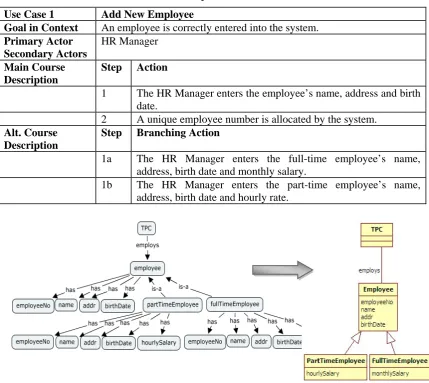
The static concept map is built incrementally from the use cases – it is subsequently transformed to a UML class diagram using the rules described in [SC07]. These rules were constructed by examining the linking words between two concepts to determine whether: a concept should be converted to a class or an attribute; and
a link should be converted to an association or generalisation-specialisation hierarchy.
Table 1. Expanded Use Case
Use Case 1 Add New Employee
Goal in Context An employee is correctly entered into the system.
Primary Actor Secondary Actors
HR Manager
Main Course Description
Step Action
1 The HR Manager enters the employee’s name, address and birth date.
2 A unique employee number is allocated by the system.
Alt. Course Description
Step Branching Action
1a The HR Manager enters the full-time employee’s name, address, birth date and monthly salary.
1b The HR Manager enters the part-time employee’s name, address, birth date and hourly rate.
An OO system is populated with objects and these objects need to cooperate with each other (by sending messages) in order to fulfil certain responsibilities. Students generally have difficulty identifying messages to be sent in UML sequence diagrams. They do not know how
ECEASST
to fulfil the responsibilities of the use case by getting objects to pass messages to each other. Students also have difficulty understanding that the interaction diagrams are dependent on the analysis class diagram in terms of its classes, associations and multiplicities
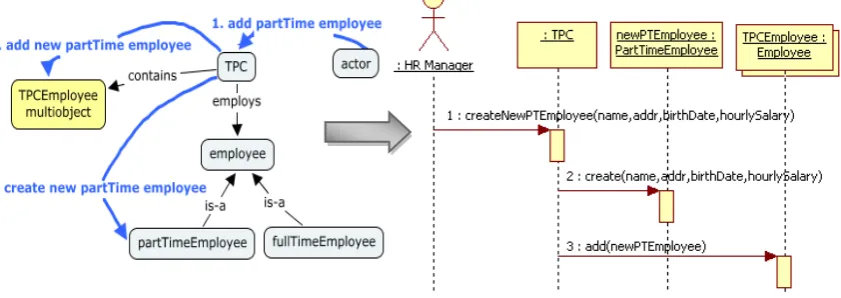
A dynamic concept map provides a dynamic view of the system behaviour by showing the key responsibilities that need to be fulfilled by specific concepts in order to fulfil a particular scenario of a use case. The concepts defined in the dynamic concept map model objects in the sequence diagram. For each use case, its key responsibilities are identified and added to the static concept map so as to produce a dynamic concept map. A dynamic concept map is constructed and subsequently transformed to a UML sequence diagram using the rules described in [SC08].
Fig. 2 illustrates an example of how a dynamic concept map for creating a part-time employee concept is transformed to a sequence diagram.
Figure 2. Dynamic concept map converted to a sequence diagram
The class and sequence diagrams are selected for our study because they represent the essential static and behavioural aspects of a problem domain. The class diagram is fundamental to the OO modelling process and provides a static description of system components and structures in terms of classes and their relationships. The sequence diagram is selected because it is identified as the ‘major UML diagram that captures the detailed behaviour of objects in the system’ [GBVH07] and it is one of the most widely used dynamic diagrams in UML [DP06].
One of the main motivations for developing this concept-driven approach is to assist students produce more appropriate class and sequence diagrams. Our concept mapping techniques are developed based on some of the design errors that are reported in Section 2:
The processes for deriving appropriate concepts from use cases should help novices avoid producing inappropriate classes, missing controller classes, and missing attributes.
Labelled links between concepts should help prevent misassigned attributes and inappropriate relationships.
Teaching OO Modelling using Concept Maps
The processes involved in identifying responsibilities and the assignment of these responsibilities to candidate concepts should help novices understand how objects can interact with each other via messages to fulfil the responsibilities of a particular scenario of a use case.
It must be emphasised that the concepts defined in the static concept map are transformed to classes (and attributes) in the analysis class diagram, whilst the concepts defined in the dynamic concept map are transformed to objects in the sequence diagram.
3.2 Integrating the Concept-Driven Approach into an Existing OOAD Course
Teaching OOAD is not easy. Educational institutions have developed/adopted various approaches [BW00, BD05] to help resolve the problems discussed in Section 2. We recommend using a concept map as the initial domain model instead of a class diagram or object diagram, and teaching students how to identify concepts and their relationships from textual use cases describing the functionalities of the system.
The first module introduces a procedure for producing static concept maps from textual use cases that describe the functional requirements of a system. The second module presents a set of transformation rules for converting the static concept map to a corresponding class diagram. The third module introduces a procedure for producing a dynamic concept map from a use case. The fourth module presents a set of transformation rules for converting a dynamic concept map to a corresponding sequence diagram. These modules can be used as a stand-alone workshop or integrated into existing OOAD courses or workshops. At the end of each module, the students are expected to work on hands-on exercises. The exercises are designed to help students apply theory to practice, and subsequently assist them to improve their abstraction skills. The students are expected to draw the models using pen/pencil and paper. However, the lecturer of the course or facilitator of the workshop may prefer that the students use software applications to draw the models.
With these modules, we aim to help students by providing them with:
a good foundation for identifying essential concepts to represent the problem domain; techniques to help them produce appropriate abstractions of real-world problems to be
represented by UML diagrams;
an understanding of OO notations and terminology including familiarity with a core subset of UML notation; and
an understanding of design patterns, and how they can be used to produce interaction diagrams.
In a typical introductory OOAD course, many OO concepts and definitions are presented first (e.g., objects, classes, inheritance, encapsulation, polymorphism, UML notation) followed by the application of these notations in the various types of UML analysis and design models. Our framework, however, consists of the following sequence of topics:
1. Requirements analysis and use cases.
2. Module 1: Static concept map (estimated duration: 1 hour 30 minutes)
ECEASST
maps; guidelines for producing concept maps to represent a problem domain within the context of OOAD [SC07]; hands-on exercises to produce a static concept map representing the problem domain from a case study.
3. Analysis class diagram (e.g., classes, attributes, associations, generalisation-specialisation hierarchy, whole-part association, etc.) and UML notation for the OO approach.
4. Module 2: Static concept map analysis class diagram (estimated duration: 1 hour 15 minutes)
Content: transformation rules for converting a static concept map to an analysis class diagram [SC07]; hands-on exercises to produce a class diagram – students continue with the case study that they worked on in Module 1.
5. Remaining topics in OOA (e.g., system sequence diagrams, contracts, etc). 6. Module 3: Dynamic concept map (estimated duration: 2 hours)
Content: multi-objects/containers in a concept map; naming convention for messages; identification of responsibilities from the use case; assignment/delegation of responsibilities to appropriate concepts using basic design patterns; guidelines for producing dynamic concept maps [SC08]; hands-on exercises to produce dynamic concept maps – students continue with the case study that they worked on in Module 1.
7. Module 4: Dynamic concept map sequence diagram (estimated duration: 1 hour 45 minutes)
Content: transformation rules for converting a dynamic concept map to a sequence diagram using the rules defined in [SC08]; hands-on exercises to produce sequence diagrams –
students continue with the case study that they worked on in Module 1. 8. Remaining topics in OOD (e.g., design class diagram, etc).
9. Remaining topics in OOAD (e.g., OOPL code examples showing domain classes and relationships, OO development, etc).
The times allocated to the modules are based on our experience conducting concept mapping workshops. There are many constraints to consider e.g., the time that the facilitator can afford for these topics in his/her syllabus, the speed with which the students can complete the guided sessions, the amount of help that the students require, etc.
We incorporated these teaching modules in the workshops reported in [SC07, SC08] to evaluate the effectiveness of using concept maps to produce class and sequence diagrams. Since the evaluation results provided strong evidence that the concept-driven approach can be used successfully, we implemented the teaching modules in an introductory OOAD course in the February 2009 semester at HELP University College, Malaysia.
4 Evaluation Study
Teaching OO Modelling using Concept Maps
results from two different sets of students, we can nonetheless use the outcome as a basis for considering the implications of incorporating concept mapping techniques in an OOAD course.
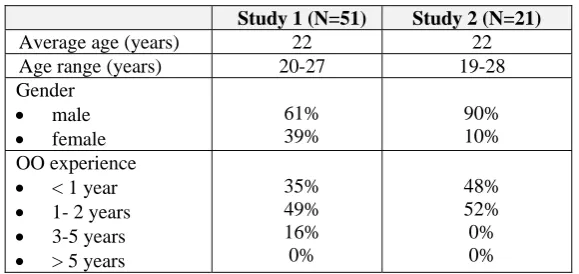
Study 1 consisted of fifty-one Year 2 IT undergraduate students and Study 2 consisted of twenty-one Year 2 IT undergraduate students. All the participants were volunteers and were not paid to take part in the study. Information captured on the background of the participants and their experience with OOAD is summarised in Table 2. The OO experience reported for these participants is based on the experience they gained from their university courses that include OO concepts.
Table 2. Background information on participants from Studies 1 and 2
Study 1 (N=51) Study 2 (N=21)
Average age (years) 22 22
Age range (years) 20-27 19-28
Gender
male
female
61% 39%
90% 10% OO experience
< 1 year
1- 2 years
3-5 years
> 5 years
35% 49% 16% 0%
48% 52% 0% 0%
The participants from both studies were asked to work on a case study containing four expanded use cases that describe the functional requirements of the system. The solution for the case study consists of nine appropriate classes, two generalisation-specialisation hierarchies and eight associations. We used rubrics to define the assessment criteria for evaluating the appropriateness of the participants’ diagrams.
The participants in Study 1 were given a case study to work on after they had completed their OOAD course at HELP University College, Malaysia. In the subsequent semester Modules 1, 2, 3 and 4 were integrated into the OOAD course. After completing Module 4, the participants in Study 2 were given the same case study to work on.
The participants in Study 1 were given 1 hour to work on the case study as they were required to produce a class and sequence diagram. The participants in Study 2, however were given 1 hour 30 minutes to work on the case study as they were required to produce a static concept map, a class diagram, a dynamic concept map and a sequence diagram.
5 Results
ECEASST
appropriateness are: Complete, Partial, First Step, Skumtomte1, Restatement and Nothing. The class and sequence diagrams produced by the participants are classified according to the categories proposed by Eckerdal et al. [EMM+06]. The descriptions of the categories, however have been modified to make them more appropriate for our study e.g.,
Class diagrams
Complete designs: diagrams contain all of the expected classes, attributes and associations. Generalisation-specialisation hierarchies and whole-part associations are appropriately applied.
Partial designs: diagrams are a good representation of the problem domain with most of the expected classes, attributes and associations defined.
First Step designs: diagrams are a good representation of a partial overview of the problem domain with an appropriate number of expected classes. Some of the classes may not be appropriately associated with each other and may contain some misassigned attributes.
Skumtomte: incomplete diagrams with missing classes, misassigned or irrelevant attributes, and missing or inappropriately defined associations.
Restatement: level of detail provided is insufficient. There are significant errors and misunderstandings.
Nothing: diagrams do not contain any logical content.
Sequence diagrams
Complete designs: diagrams contain appropriate sequence of messages passed to the relevant objects to fulfil the responsibilities of the use case.
Partial designs: diagrams include an appropriate number of correct objects fulfilling some responsibilities of the use case.
First Step designs: evidence of some understanding of the required delegation of responsibilities among the objects.
Skumtomte: diagrams are incomplete but contain at least 1 appropriate interaction between 2 appropriately defined objects. The majority of messages are inappropriate. Restatement: diagrams are incomplete but contain at least 2 appropriate objects. All
the messages are inappropriate.
Nothing: diagrams contain significant errors and misunderstandings.
This method allows us to adopt a holistic approach [FH05] for evaluating the appropriateness of the UML diagram. We are, however, aware that this may not be a reliable assessment as it does not explicitly assess the appropriateness of individual components of the diagram.
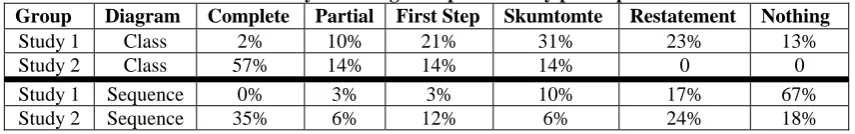
A higher percentage of class and sequence diagrams produced in Study 2 are found to be in better design categories than the diagrams produced in Study 1 – see Table 3. There are 36% of class diagrams produced in Study 1 that belong in the Restatement and Nothing categories – participants in Study 2 did not produce any class diagrams belonging in these two categories. There are no sequence diagrams produced in Study 1 that belong in the Complete category,
1
Teaching OO Modelling using Concept Maps
compared to 35% of sequence diagrams produced in Study 2 belonging in the Complete category.
Table 3. Analysis of diagrams produced by participants
Group Diagram Complete Partial First Step Skumtomte Restatement Nothing
Study 1 Class 2% 10% 21% 31% 23% 13%
Study 2 Class 57% 14% 14% 14% 0 0
Study 1 Sequence 0% 3% 3% 10% 17% 67%
Study 2 Sequence 35% 6% 12% 6% 24% 18%
Some of the most common faults found in the models produced in Study 1 were similar to the types discussed in Section 2. We find in this study (Study 2) that the number of faults has significantly decreased especially in the following areas:
class diagrams
identification of expected classes representing the key concepts in the problem domain;
assignment of attributes to appropriate classes;
identification of appropriate generalisation-specialisation hierarchies. sequence diagrams
identification of appropriate objects participating in the scenario of the use case; identification of objects in the sequence diagram that correspond to classes defined in
the class diagram; and
delegation/assignment of responsibilities to objects.
6 Threats to Validity
This section discusses some threats to validity that may affect this study.
Internal Validity. Internal validity refers to the extent to which we can correctly state that the introduction of concept mapping techniques caused the participants to produce more appropriate class and sequence diagrams. One of the threats to internal validity consists of the expectations of a particular result by the researcher. In this context, the researcher was responsible for marking the class and sequence diagrams produced by the two groups of participants, and she is fully aware that the scores for the diagrams may bias the hypotheses. To this end, the marking scheme was strictly adhered to. However, in order to eliminate this threat, we should consider using independent assessors to mark the pre-test and post-test diagrams. We have not 'employed' the services of independent assessors due to logistical problems e.g., lack of funding and time constraints. Note: the case study, marking scheme and a sample of the marked diagrams were moderated by independent assessors.
There may be other factors that contributed to the quality of class and sequence diagrams produced by the participants of Study 2 e.g.,
the students from Study 2 may be more intelligent than the students from Study 1;
ECEASST
the students in Study 2 have been given a good foundation on OOAD concepts; sufficient emphasis has been placed on the necessary topics that are being evaluated.
External Validity. The main threat to external validity is generalising our results as our sample may not be representative of all IT undergraduate students.
7 Conclusion
It is evident from the results reported earlier in Section 6 that the quality of class and sequence diagrams improved in Study 2. We are, however, mindful that the results achieved by the participants in Study 2 may not be attributed to concept mapping techniques (as discussed in Section 6).
We believe that a significant improvement in the way novices in OOAD analyse and design their OO systems can be achieved by adopting concept mapping techniques described in [SC07, SC08]. Once novices have mastered these techniques, they will be able to effectively produce abstractions of real-world problems represented by OOAD models. A significant strength of this approach is that it slows students down so that they need to think things through more thoroughly than they otherwise would. We have also set some design constraints e.g., including specifically defined linking words within the processes for building static concept maps in order to help students stay at the required abstraction level. This is intended to support and improve their skills of abstract thinking, and consequently improve their understanding of OOAD.
Bibliography
[BD05] R. Beheshti, E. Dado. Simplified UML Techniques for System Development in an Educational Setting. In Proc. Sixth International Conference on Information Technology Based Higher Education and Training. 2005.
[BL06] N. Bolloju, F. Leung. Assisting Novice Analysts in Developing Quality Conceptual Models with UML. Communications of the ACM 49(7), pp. 108-112, 2006.
[BW00] R. Box, M. Whitelaw. Experiences when Migrating from Structured Analysis to Object-Oriented Modelling. In Proc. Australasian Conference on Computing Education. 2000.
[Cia95] T. Cianchetta. Teaching Object-Oriented Analysis and Design by "Cruisin' the Classifieds for Business Objects". In Proc. 1995 Conference of the Centre for Advanced Studies on Collaborative Research. 1995.
Teaching OO Modelling using Concept Maps
[EMM+06] A. Eckerdal, R. McCartney, J.E. Moström, M. Ratcliffe, C. Zander. Can Graduating Students Design Software Systems? In Proc. Thirty-Seventh SIGCSE Technical Symposium on Computer Science Education. 2006.
[FH05] D.R. Ferris, J.S. Hedgcock. Teaching ESL Composition: Purpose, Process and Practice. Lawrence Erlbaum, 2005.
[GBVH07] J.F. George, D. Batra, J.S. Valacich, J.A. Hoffer. Object-Oriented Systems Analysis and Design. Pearson Higher Education, 2007.
[KH06] J. Kramer, O. Hazzan. The Role of Abstraction in Software Engineering. In
Proc. Twenty-Eighth International Conference on Software Engineering.
2006.
[Kra07] J. Kramer. Is Abstraction the Key to Computing? Communications of the ACM 50(4), 2007.
[MO95] J. Martin, J. Odell. Object-Oriented Methods: A Foundation. Prentice-Hall International Inc, 1995.
[NB03] S. Naidu, P. Blanchard. Concept Mapping.
http://www.infodiv.unimelb.edu.au/telars/flds/documents/conceptmappingwbo ok.pdf#search=%22concept%20mapping%20naidu%22
[NC06] J.D. Novak, A.J. Cañas. The Origins of the Concept Mapping Tool and the Continuing Evolution of the Tool. Information Visualization 5(3), pp.175-184, 2006.
[NC08] J.D. Novak, A.J. Cañas. The Theory Underlying Concept Maps and How to Construct and Use Them. Technical Report IHMC CmapTools, 2008.
[SBG06] D. Svetinovic, D.M. Berry, M.W. Godfrey. Increasing Quality of Conceptual Models: Is Object-Oriented Analysis that Simple? In Proc. 2006 International Workshop on Role of Abstraction in Software Engineering. 2006.
[SC07] V.Y. Sien, D. Carrington. A Concepts-First Approach to Object-Oriented Modelling. In Proc. Third IASTED International Conf on Advances in Computer Science and Technology. 2007.