R E S E A R C H A R T I C L E
Open Access
Quantitative modeling of dose
–
response and
drug combination based on pathway network
Jiangyong Gu
1†, Xinzhuang Zhang
1,2†, Yimin Ma
2, Na Li
2, Fang Luo
1, Liang Cao
2, Zhenzhong Wang
2, Gu Yuan
1,
Lirong Chen
1*, Wei Xiao
2*and Xiaojie Xu
1*Abstract
Background:Quantitative description of dose–response of a drug for complex systems is essential for treatment of diseases and drug discovery. Given the growth of large-scale biological data obtained by multi-level assays, computational modeling has become an important approach to understand the mechanism of drug action. However, due to complicated interactions between drugs and cellular targets, the prediction of drug efficacy is a challenge, especially for complex systems. And the biological systems can be regarded as networks, where nodes represent molecular entities (DNA, RNA, protein and small compound) and processes, edges represent the relationships between nodes. Thus we combine biological pathway-based network modeling and molecular docking to evaluate drug efficacy. Results:Network efficiency (NE) and network flux (NF) are both global measures of the network connectivity. In this work, we usedNEand NFto quantitatively evaluate the inhibitory effects of compounds against the lipopolysaccharide-induced production of prostaglandin E2. The edge values of the pathway network of this biological process were reset according to the Michaelis-Menten equation, which used the binding constant and drug concentration to determine the degree of inhibition of the target protein in the pathway. The combination of NEandNFwas adopted to evaluate the inhibitory effects. The dose–response curve was sigmoid and the EC50 values of 5 compounds were in good agreement with experimental results (R2= 0.93). Moreover, we found that 2 drugs produced maximal synergism when they were combined according to the ratio between each EC50.
Conclusions:This quantitative model has the ability to predict the dose–response relationships of single drug and drug combination in the context of the pathway network of biological process. These findings are valuable for the evaluation of drug efficacy and thus provide an effective approach for pathway network-based drug discovery.
Keywords:Dose–response modeling, Drug combination, LPS-induced PGE2 production, Pathway network
Background
The dose–response relation is a key topic in pharmacology.
How to predict the efficacy of a compound for a system (protein, biological process, cell, tissue, organ and the body) is critical for drug discovery. The drugs (magic bullets) developed in the past decades were designed to selectively target a specific protein. However, when a single drug is
administered and enters the body, interaction with 1 or more cellular targets is possible [1, 2]. A drug may produce multiple effects in the system through interacting with
mul-tiple cellular targets, which is called “polypharmacology”
[2, 3]. The pathogenesis of complex diseases such as cardio-vascular disorders and diabetes is related to a lot of genetic and environmental factors [4, 5]. The human body is a complicated, integrated and networked biological system. And drugs which selectively target 1 protein cannot treat complex diseases effectively due to the robustness and
re-dundancy of the biological system [6–11]. Meanwhile,
multi-target drug therapies may be more effective than in-dividual high-affinity drugs for complex diseases [12]. Nevertheless, the more drugs administrated or more targets with which drugs can interact, the more complicated the
* Correspondence:
[email protected];[email protected];[email protected] †Equal contributors
1
Beijing National Laboratory for Molecular Sciences (BNLMS), State Key Laboratory of Rare Earth Materials Chemistry and Applications, College of Chemistry and Molecular Engineering, Peking University, Beijing 100871, People’s Republic of China
2
National Key Laboratory of Pharmaceutical New Technology for Chinese Medicine, Kanion Pharmaceutical Corporation, Lianyungang City 222002, People’s Republic of China
mechanism would be. Therefore, the prediction of drug ef-ficacy is a challenge, especially for complex systems.
When 2 or more drugs are administrated in combination, the interactions among drugs would add a further
compli-cation to the prediction of the dose–response relation of
drug combination. Generally, the drug interaction would generally produce 1 of 3 different effects: synergism, antag-onism and additive effect [13, 14]. Synergism means that drug combination could produce exaggerated effect, and antagonism could reduce the total effect. Synergism is espe-cially important in clinical applications since it allows the use of smaller amounts of drugs and thus reduces the
ad-verse effect or toxicity [14–17].
We have developed a pathway network-based approach to evaluate the efficacy of a compound against biological processes, such as blood clotting [18] and platelet aggrega-tion [5]. Recently, we used this method for virtual screening of active compounds for the inhibition of lipopolysacchar-ide (LPS)-induced prostaglandin E2 (PGE2) production [19]. In this work, we demonstrate an advance in the
quan-titative modeling of dose–response and drug combination
based on the pathway network of LPS-induced PGE2 pro-duction. PGE2 is the principal inflammation mediator, which could participate in many pathological processes
[20–22]. The production of PGE2 can be regarded as a
bio-marker of inflammation. Generally, the pathway of LPS-induced PGE2 production was modeled as a network. And the binding affinity of a compound to a protein in the path-way network was assessed by molecular docking. The dock-ing results had influence on the edge weights by relatdock-ing
them to enzyme efficiency via Michaelis-Menten kinetics.
The effect of a compound on the entire network, and
thus, in this particular case, the production of PGE2, was assessed by using the network connectivity measures (network efficiency and network flux). By integrating mo-lecular docking and network analysis, network efficiency, network flux and their combination can quantitatively de-scribe the inhibitory effects of compounds. Moreover, the efficacy and synergism or antagonism of the combination between 2 compounds were also evaluated.
Results
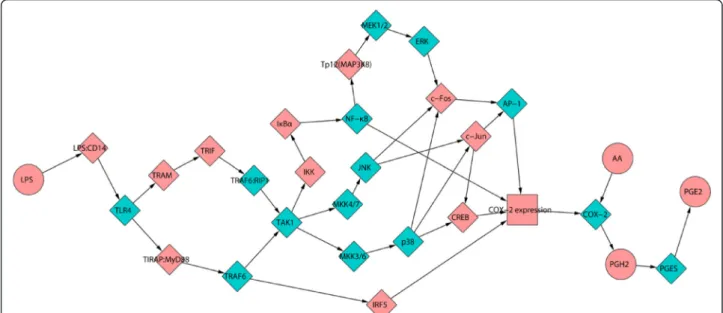
Pathway network of LPS-induced PGE2 production
The pathway network of LPS-induced PGE2 production (Fig. 1) comprised 30 nodes and 38 edges (arrows), where nodes represented proteins and small molecules involved in the process of LPS-induced PGE2 production, and edges meant that the node in front of the arrow was downstream in the pathway. This network was a scale-free and small-world network, which were 2 typical characteristics of bio-logical networks [23]. It indicated that the network can have strong stability and can resist random attacks [23, 24]. However, it would be vulnerable for targeted attacks, such as selective drugs. Therefore, it offered an opportunity for us to develop drugs to treat inflammation-related diseases, especially multi-target drugs and drug combination to sim-ultaneously block multiple targets with varying degrees.
Network efficiency and network flux
Network efficiency was first proposed by Latora V. and Nagurney A. to measure the importance of a node in a net-work when the node was removed [25, 26]. Then it was adopted by our lab to evaluate the efficacy of a drug against
blood clotting cascade [18] and platelet aggregation [5].NE
was a global measure of the connectivity of a network and
can reflect the integrity of the network.NEwas defined as
the sum of the shortest path lengths between each node in
the network. Thus in the calculation of NE, all shortest
paths between a node and other N-1 nodes counted (N was the number of nodes in the network). However, it cannot reflect the different weightiness of the node because all nodes were calculated N-1 times [5]. Actually the further downstream a node located in the pathway network, the more important it would be. Thus network flux was pro-posed to calculate the shortest paths between all other nodes and the exit node of the pathway network in our
pre-vious work [5]. The combination ofNEandNF took into
account the different importance of the node, thus it can be used to predict the potencies of compounds against platelet aggregation [5].
The degree of decrease ofNE(NEd) andNF(NFd), and
the geometric mean ofNEdandNFd(NEF) were all
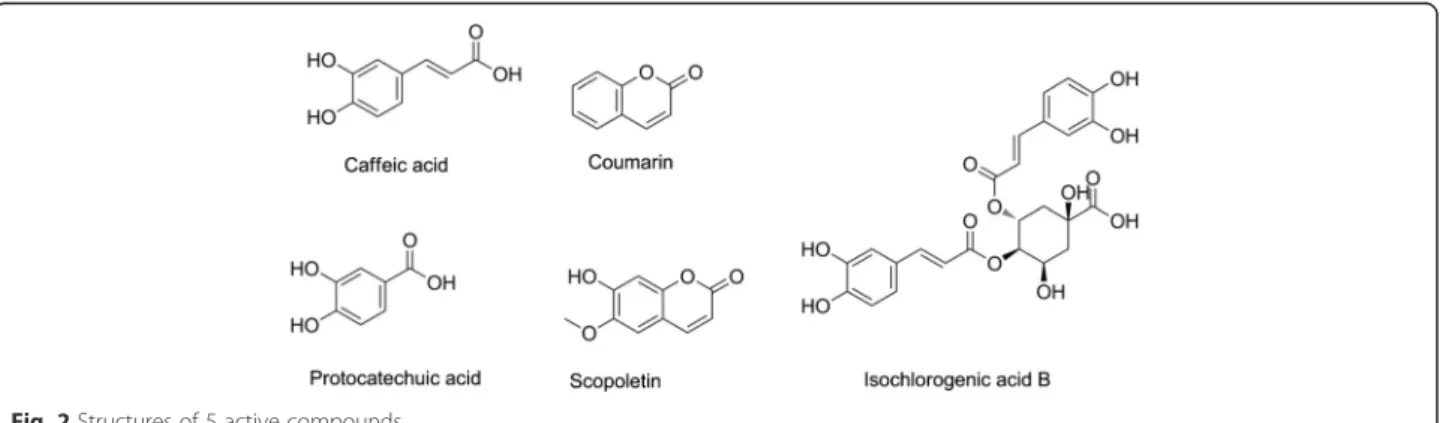
indi-cators of the network connectivity. In this work, we stud-ied 5 active compounds (Fig. 2) extracted from Reduning Injection which was a widely used Chinese medicine pre-scription [19]. The activities of 5 compounds against LPS induced PGE2 production at different concentrations were
predicted. However, NEd, NFd and NEF had different
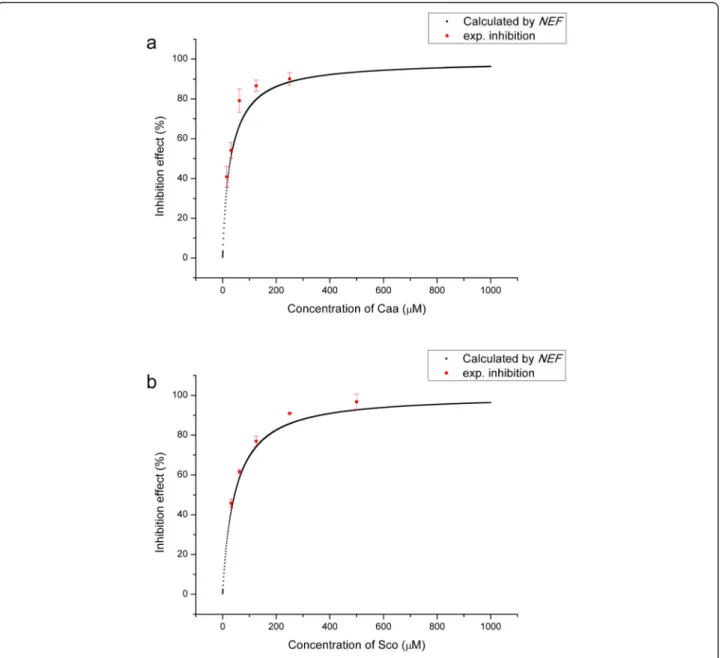
accuracies for the predictions, as shown in Fig. 3. Caffeic acid and Scopoletin were the 2 of the most potent com-pounds, so the 2 compounds were picked out as examples.
In the case of Caffeic acid (Caa), the predictions of NEd
were lower than thein vitroexperimental results, while the
predicted inhibition rates by NFdwere higher than
ex-perimental results (Fig. 3a). It was more complicated for Scopoletin (Sco): the model had higher predictions at low concentrations and lower predictions at high
concentrations byNEd, while it was the direct opposite
of predictions by NFd (Fig. 3b). However, the model
gave good agreements between predictions byNEFand
experiment results in all cases. Therefore, NEF was a
better evaluation indicator for this system and was used in further evaluations.
Dose–response curve
The shape of the dose–response curve was important to
evaluate the efficacy of a compound. All predicted and
ex-perimental dose–response curves were sigmoid. Table 1
listed the parameters of fitted dose–response curves of 5
active compounds according to the predictions by NEF.
The Emaxand Eminwere close to 100 % and 0, respectively.
And the correlation coefficients were higher than 0.999, es-pecially for Caa and Sco (Figs. 4a, b). Moreover, the pre-dicted EC50 values of 5 active compounds well matched
with the experiment values (R2= 0.93, Table 1), which
indi-cated that the prediction model byNEFwould be reliable.
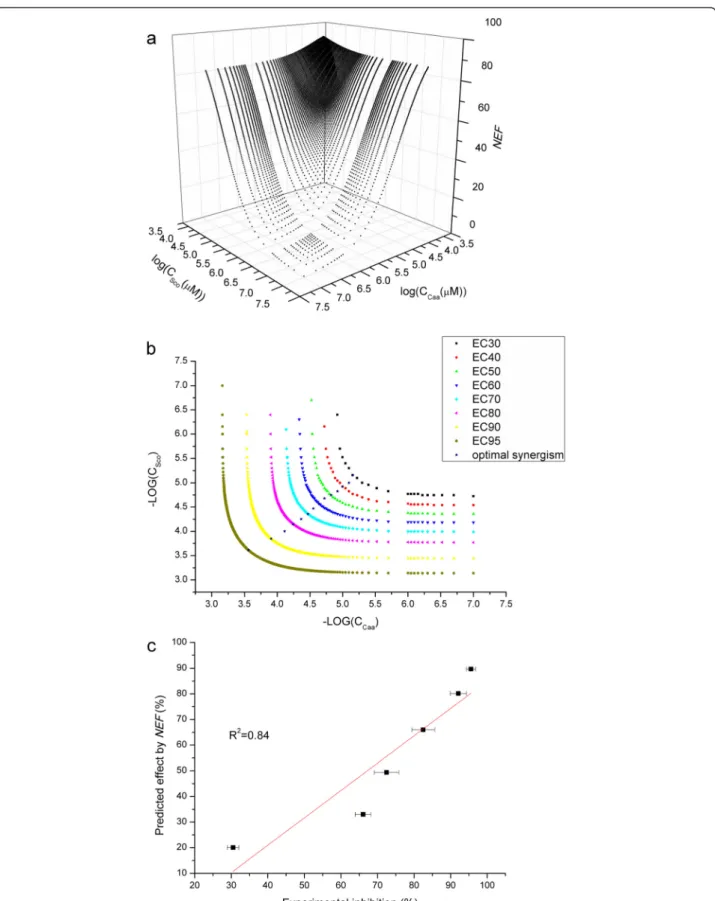
Drug combination and dose–response surface
This approach can also evaluate the combination of 2 or more compounds. There would be 3 effects for drug combination: synergism, additive effect and
antagon-ism. Thecombination index (CI) proposed by Chou T.
C. was adopted to quantify the synergic degree of drug combination [13]. When 2 drugs both existed in the
system, it would produce a dose–response surface (DRS).
Fig. 5a showed the DRS of the combinations between Caa and Sco in different doses. A series of drug com-bination can have the same effects on the system, which can be described by the isobologram (Fig. 5b). Each dose pairs on the isobologram represented pos-sible combinations that produced the equivalent effect. In the case of combination of Caa and Sco, it was a typ-ical synergistic effect. However, each drug pair in the isobologram differed in degree of synergism. The stars in Fig. 5b pointed out the optimal combination for each degree of inhibition. And we found that the dose ratios of 2 compounds for maximal synergism were nearly the same with the ratio between each EC50. Therefore, the experimental inhibition rates of 6 combinations of Caa and Sco with the ratio between each EC50 value were determined. And the results agreed well with the
pre-dictions (R2= 0.84, Fig. 5c).
Discussion
The pathway of a biological process is a minimal biosystem with a specific function and can be abstracted as a network. The network properties can relate with the state of the biosystem to a certain extent, especially for biomarkers related to diseases [5]. Thus the influence on the pathway network of a compound can be used to evaluate the efficacy
[5, 18, 23, 27–29]. These results demonstrated that the
de-gree of the decreases ofNE,NFandNEFwere measures of
inhibition of a drug against LPS-induced PGE2 production.
A drug could target multiple proteins in the biological pathway, and a drug combination could produce synergistic or antagonistic effect in different extent through multi-target interactions [14, 19, 30]. Synergism is useful in illuminating mechanisms of drug action and exploring computational models to predict new drug leads in drug
discovery. The dose–response surface and isobologram are
2 practical tools. Moreover, thecombination indexis a
The exact mechanisms of the inhibitions of drugs against LPS-induced PGE2 production are unclear now since the biological system of the cells or organism is complicated. Our recent works indicated that most active compounds would have polypharmacology according to drug-target network [30]. However, the computational approach in this work generally does not need to know about the exact mechanism, which could broaden the scope of application, especially for complex systems.
Although in the above text the predictions of this model agreed well with the experimental results, it would be necessary to note that this approach should require several conditions to obtain reasonable predic-tions. First, the pathway of a biological process should be as fully accurately as possible. The calculations of
Fig. 4Dose–response curve. (a) Caffeic acid; (b) Scopoletin Table 1Parameters of fitted dose–response curves of predictions byNEF
Compounds Emax
(%)a Emin
(%)a EC50 (μM)b
n R2 EC50e
(μM)b Caffeic acid 99.49 0.28 30.20 0.98 0.99994 17.35
Coumarin 99.99 0.85 52.95 1.12 0.99996 49.14
Isochlorogenic acid B
111.20 −3.63 116.16 0.56 0.9998 96.82
Protocatechuic acid
101.18 −1.46 42.82 0.77 0.99995 46.34
Scopoletin 100.72 0.60 45.48 1.01 0.99994 38.46
a
Emaxand Eminwere the top and bottom asymptotes of the response, respectively.b
NE andNFare heavily dependent on the completeness of the pathway network. The information of the path-way of LPS induced PGE2 production is abundant and this system has been reviewed in literatures and data-bases (described in the section of Construction of the pathway network of LPS-induced PGE2 production). However, when others apply this approach in this work to other systems, they need to be very careful. When a pathway has low completeness or lacks sufficient anno-tations, the predictions would have large deviations. Second, the structures (determined by X-ray or NMR) of most target proteins in the pathway should be known. It's best to obtain ligand-protein complex structure and thus the binding site can be defined as the space which was occupied by the ligand. Beyond that, the binding energy cal-culated by molecular docking or molecular dynamics simu-lation should be accurate. The binding predictions from molecular docking are subject to a margin of error due to the principle and method of the calculation. However, we can try to reduced the error. For example, we used the most commonly used software AutoDock4 and adopted the validated protocols whose predictions had been validated by experimental results in our previous works [5, 18]. Big errors of binding predictions may affect the calculation of edge values and then reduce
the accuracies of the calculation of NE and NF.
Fur-thermore the predictions of inhibition rates of drugs would have big errors. Finally, the prediction model should be validated by experiments. The known active compounds can be used as training set to adjust the pa-rameters of the predicting model.
Methods
Construction of the pathway network of LPS-induced PGE2 production
The pathway network of LPS-induced PGE2 production was constructed in our recent work [19] according to the information extracted from KEGG pathway
data-base [31], Reactome [32], and literatures [33–40].
Gen-erally, LPS-induced PGE2 production was involved in 2 pathways: Toll-like receptor signaling pathway (ID: map04620 in KEGG pathway database) and NF-kappa B signaling pathway (map04064). First, LPS can interact with CD14 and the complex facilitates the recognition of LPS stimulation by TLR4. Then the signaling is divided into MyD88-dependent and TRIF-dependent pathways. MyD88 and TRIF can activate transcription factors such as IRF-5, NF-kappa B and AP-1 in the down-stream pathway. In particular, Eliopoulos A. G. and colleagues contributed the pathway of CREB, a key regulator of COX-2 transcription [39]. Finally, the path-way comprised 30 nodes and 38 edges (Fig. 1). Cytos-cape 2.8 was used to visualize the network and
calculate the network properties by Network Analysis plugin [41].
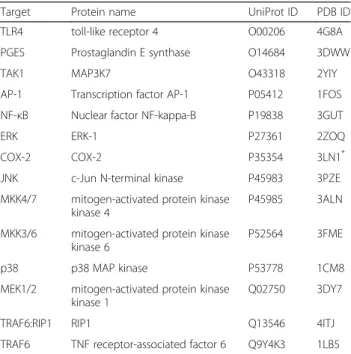
Molecular docking
There were 14 important proteins (Table 2) which can be used for molecular docking. When a protein had multiple X-ray or NMR structures in RCSB Protein Data Bank (http://www.rcsb.org/pdb/home/home.do), there were sev-eral criteria to choose the most suitable structure. First, the structure had more complete peptide chains. Second, the resolution of the structure should be as high as
pos-sible. Third, it’s better that the structure had a ligand. The
X-ray or NMR structures were downloaded from RCSB Protein Data Bank and treated to suitable for molecular docking by Autodock4 [42, 43] according to the protocols described in previous works [5, 19, 44]. The energy grid was a 20 × 20 × 20 Å cube centered on the occupied space of the original ligand with a spacing of 0.375 Å be-tween the grid points. The maximum number of energy
evaluations was set to 2.5 × 10⁷. The AD4score function
was used to evaluate the affinity between compound and
protein, and the docking score was pKi.
Calculation of network efficiency and network flux
According to Michaelis-Menten equation and the law of mass action, the rate equation in presence of 1 non-competitive inhibitor I was:
Table 214 target proteins for molecular docking
Target Protein name UniProt ID PDB ID TLR4 toll-like receptor 4 O00206 4G8A
PGES Prostaglandin E synthase O14684 3DWW
TAK1 MAP3K7 O43318 2YIY
AP-1 Transcription factor AP-1 P05412 1FOS
NF-κB Nuclear factor NF-kappa-B P19838 3GUT
ERK ERK-1 P27361 2ZOQ
COX-2 COX-2 P35354 3LN1*
JNK c-Jun N-terminal kinase P45983 3PZE
MKK4/7 mitogen-activated protein kinase kinase 4
P45985 3ALN
MKK3/6 mitogen-activated protein kinase kinase 6
P52564 3FME
p38 p38 MAP kinase P53778 1CM8
MEK1/2 mitogen-activated protein kinase kinase 1
Q02750 3DY7
TRAF6:RIP1 RIP1 Q13546 4ITJ
TRAF6 TNF receptor-associated factor 6 Q9Y4K3 1LB5
*
v¼vmax
1
1 þ Km
S ½
1 þ K½ I
I
¼ vo
1
1 þ K½ I
I
ð1Þ
whereKm, KI, [S] and [I] are Michaelis constant,
inhib-ition constant of I, concentration of substrate S and
in-hibitor I; v0 is the activity of the enzyme without
inhibitor [45]. Thus we defined the fraction of affection
(fa) to quantify what the percentage the enzyme was
inhibited:
fa ¼ 1 − v
vo ¼
1 − 1
1 þ K½ I
I
ð2Þ
When 2 mutually exclusive inhibitors (X and Y) both
existed in the system,fawould be [45]:
f a¼ 1 − v
vo ¼
1 − 1
1þ½ IX
KXþ
IY ½
KY
ð3Þ
In the pathway network, the value of an edge (EV)
repre-sented the resistance in signal transduction. That is, when a target protein was inhibited, the value of the edge which came out from the target protein would enlarge to
accom-modate it. We arbitrarily set the initial (default)EVfor each
edge as 1. We arbitrarily assumed that the most potent in-hibitor can block the target 99.5 %, thus we defined the
highest EVas 200 (1/(1–99.5 %)). Accordingly, the EVat
different concentration of inhibitor I would be:
EV ¼ 102:303 fa ¼ 10
2:303 1− 1 1 þ K I½ I
ð4Þ
or
EV¼10
2:303 1 − 1
1 þ ½ IX K X þ
IY ½
K Y !
ð5Þ
when 2 inhibitors both existed.
Network efficiency and network flux were both
mea-sures of the network connectivity [5, 18, 26].NEwas
de-fined as the sum of the reciprocals of the shortest path lengths between all pairs of nodes in the pathway network:
NE¼X i≠j∈G
1
dij ð
6Þ
NF was defined as the sum of the reciprocals of the
shortest path lengths between other nodes and the exit of the pathway network:
NF¼X
i≠j∈G;j¼exit
1
dij ð
7Þ
where dij is the length of the shortest path between
nodes i and j. The calculation programs of NEand NF
were written in C++ language using the Dijkstra algorithm.
In order to evaluate the influence of a compound on
the pathway network, we defined theNEd as the degree
of decrease ofNEas following:
NEd ¼ NEmax − NE N Emax − NEmin
100% ð8Þ
where NEmax and NEmin are the maximal and minimal
NEwhen allEVs are set as 1 and 200, respectively.
Simi-larly, theNFdwas defined accordingly:
NFd ¼ NFmax − NF NFmax − NFmin
100% ð9Þ
Finally, we defined the NEFas the geometric mean of
NEdand NFdto evaluate the impact of a compound on
the pathway network comprehensively:
NEF ¼ pffiffiffiffiffiffiffiffiffiffiffiffiffiffiffiffiffiffiffiffiffiffiffiffiffiffiffiffiffiffiN Ed NFd ð10Þ
Fitting of dose–response curve
Typically, the dose–response relation can be simulated
by the following equation [46]:
y ¼ Emax −
Emax − Emin
1 þ EC½ I
50
n ð11Þ
where Emaxand Eminare the top and bottom asymptotes of
the response, y is the inhibition rate when the concentra-tion of the inhibitor is [I], EC50 is the concentraconcentra-tion of in-hibitor at half-maximal effect, and n is the slope parameter like the Hill coefficient [47]. The fitting of computational
efficacy or experimental resultsversusthe concentration of
the inhibitor was performed and the correlation coefficient was used to evaluate the reliability of the model.
Combination index
The effect of the combination of 2 drugs may be simple additive, exaggerated (synergistic) or attenuated (antag-onistic). In order to quantify the synergism or
antagon-ism for 2 drugs (D1and D2), Chou T. C. introduced the
termcombination index[13]:
CI ¼ ð ÞD1
Dx
ð Þ1
þ ð ÞD2
Dx
ð Þ2
ð12Þ
whereCI<1, =1 and >1 indicated synergism, additive
represented the concentrations when D1 and D2 alone
can inhibit the system x %. (D)1and (D)2were the
con-centrations when D1and D2in combination can inhibit
the system x %.
Experimental
RAW264.7 Cell experiments
All compounds forin introtest were purchased from
Na-tional Institute for Food and Drug Control (Beijing, China). Lipopolysaccharide (LPS) was purchased from Nanjing Baikang Biological Technology Co., Ltd. (Nanjing PR China). The inhibitory activities of compounds against
LPS-induced PGE2 production were determined in
RAW246.7 cells (Cell Culture Center of the Chinese Academy of Medical Sciences, Beijing, China). First,
RAW246.7 cells were cultured in high-glucose Dulbecco’s
Modified Eagle’s medium (DMEM, Gibco, Carlsbad, USA)
which contained streptomycin (100 μg ml−1), penicillin
(100 U ml−1) and 10 % (v/v) fetal bovine serum (FBS,
Sijiqing, Deqing, Hangzhou, China) at 37 °C in a
hu-midified incubator containing 5 % CO2. Second, the
cell viability was determined by MTT assays to evaluate the cellular toxicity of compounds. RAW246.7 cells
were plated in 96-well plates (4 × 10⁴ cells/well)
over-night and treated 24 h with various concentrations of
compounds in FBS-free DMEM. MTT (5 mg mL−1)
was added in each well and the cells were incubated for 4 h at 37 °C. Then the standard protocol of MTT assays was adopted to determine the cell viability by Spectra-Max M2e Microplate Reader (Molecular Devices, Menlo Park, USA). Third, RAW264.7 cells were pre-treated with various concentrations of compounds or positive drug (Celecoxib) for 1 h. Then LPS (final
con-centration 1μg ml−1) was added and the cells were
in-cubated for 16 ~ 18 h. The concentration of PGE2 was
measured by Prostaglandin E2 EIA kit (Enzo Life
Sci-ences, Farmingdale, NY, USA). The experiments were repeated 3 times at each concentration of each com-pound. The inhibition rate of a compound against
LPS-induced PGE2production was calculated by:
Inhibition rate ¼ 1 − C drugð − C controlð ÞÞ
C modelð Þ − C controlð Þ
100%
ð13Þ
whereC(control) was the background concentrations of
PGE2.C(drug) and C(model) represented the
concen-trations of PGE2 when the RAW246.7 cells were incu-bated with drug or DMSO and then stimulated by LPS, respectively.
Conclusions
In this study, we developed a quantitative model to predict
the dose–response curves of single drug and drug
combin-ation based on the pathway network of LPS-induced PGE2 production. The network efficiency and network flux are both measures of the connectivity of the pathway network.
And thus the degrees of the decrease ofNE, NFandNEF
could evaluate the efficacy of a drug to the biological sys-tems. By integrating molecular docking and network
ana-lysis, the dose–response relationships of 5 compounds
against LPS-induced PGE2 production were evaluated and the predictions agreed well with experimental results.
Fur-thermore we explored the dose–response relationships of
drug combinations to study the synergism. Moreover, iden-tifying novel effective drug combinations or multi-target agents is a new trend in drug discovery. Actually, the herb medicines are the natural combinations of active com-pounds. This computational method can be used to quanti-tatively evaluate the efficacy of a mixture of 2 or more drugs, even herb medicines. The increasing of the complex-ity of multiple omics data sets requires more effective ap-proaches for drug screening. And computational modeling
is an indispensable tool for understanding dose–response
relationship and mechanisms of a drug or drug combin-ation. This work would provide a new computational ap-proach to evaluate drug efficacy before clinic trials and screen optimal combination for drug discovery when a bio-logical system/process has a well-defined pathway.
Abbreviations
Caa:Caffeic acid; CI:Combination index; DRS: Dose–response surface; LPS: Lipopolysaccharide; NE: Network efficiency; NEF: The geometric mean of the degree of decrease of network efficiency and the degree of decrease of network flux; NF: Network flux; PGE2: Prostaglandin E2; Sco: Scopoletin.
Competing interests
The authors declare that they no competing interests.
Authors’contributions
XJX, WX and LRC conceived and designed the experiments. JYG and XZZ constructed the pathway. JYG wrote the programs, carried out the calculations and wrote the manuscript. XZZ, YM and NL prepared the samples and performed the experiments. JYG, XZZ and FL analyzed the data with the help of GY, LC and ZZW. The manuscript was reviewed and discussed by all of the authors. All authors read and approved the final manuscript.
Acknowledgements
This work was financially supported by National Key Special Project of Science and Technology for Innovation Drugs (Grant No. 2012ZX09501001-004, 2013ZX09402202 and 2013ZX09402203), China Postdoctoral Science Foundation (Grant No. 2014 M560011) and the Enterprise Academician Workstation of Jiangsu Province, PR China (Grant No. BM2011027). The calculations were performed on TianHe-1(A) at National Supercomputer Center in Tianjin, PR China.
Received: 10 October 2014 Accepted: 14 April 2015
References
2. Yildirim MA, Goh KI, Cusick ME, Barabasi AL, Vidal M. Drug-target network. Nat Biotechnol. 2007;25(10):1119–26.
3. Medina-Franco JL, Giulianotti MA, Welmaker GS, Houghten RA. Shifting from the single to the multitarget paradigm in drug discovery. Drug Discov Today. 2013;18(9–10):495–501.
4. Kitano H. Computational systems biology. Nature. 2002;420(6912):206–10. 5. Gu J, Li Q, Chen L, Li Y, Hou T, Yuan G, et al. Platelet aggregation pathway
network-based approach for evaluating compounds efficacy. Evid Based Complement Alternat Med. 2013;2013:425707.
6. Hopkins AL. Network pharmacology. Nat Biotechnol. 2007;25(10):1110–1. 7. Hopkins AL. Network pharmacology: the next paradigm in drug discovery.
Nat Chem Biol. 2008;4(11):682–90.
8. Morphy R, Kay C, Rankovic Z. From magic bullets to designed multiple ligands. Drug Discov Today. 2004;9(15):641–51.
9. Cases M, Mestres J. A chemogenomic approach to drug discovery: focus on cardiovascular diseases. Drug Discov Today. 2009;14(9–10):479–85. 10. Wang Z, Zhang JZ. Abundant indispensable redundancies in cellular
metabolic networks. Genome Biol Evol. 2009;1:23–33.
11. Kitano H. Biological robustness. Nat Rev Genet. 2004;5(11):826–37. 12. Ágoston V, Csermely P, Pongor S. Multiple weak hits confuse complex
systems: a transcriptional regulatory network as an example. Phys Rev E Stat Nonlin Soft Matter Phys. 2005;71(5):051909.
13. Chou TC. Theoretical basis, experimental design, and computerized simulation of synergism and antagonism in drug combination studies. Pharmacol Rev. 2006;58(3):621–81.
14. Jia J, Zhu F, Ma X, Cao Z, Li Y, Chen YZ. Mechanisms of drug combinations: interaction and network perspectives. Nat Rev Drug Discov. 2009;8(2):111–28. 15. Tallarida RJ. Drug synergism: its detection and applications. J Pharmacol Exp
Ther. 2001;298(3):865–72.
16. Fang X, Wallqvist A, Reifman J. Modeling synergistic drug inhibition of Mycobacterium tuberculosis growth in murine macrophages. Mol BioSyst. 2011;7(9):2622–36.
17. Cokol M, Chua HN, Tasan M, Mutlu B, Weinstein ZB, Suzuki Y, et al. Systematic exploration of synergistic drug pairs. Mol Syst Biol. 2011;7:544. 18. Li Q, Li X, Li C, Chen L, Song J, Tang Y, et al. A network-based multi-target
computational estimation scheme for anticoagulant activities of compounds. PLoS One. 2011;6(3):e14774.
19. Zhang X, Gu J, Cao L, Ma Y, Su Z, Luo F, et al. Insights into the inhibition and mechanism of compounds against LPS-induced PGE2 production: a pathway network-based approach and molecular dynamics simulations. Integr Biol. 2014;6(12):1162–9.
20. Ivanov AI, Romanovsky AA. Prostaglandin E2 as a mediator of fever: synthesis and catabolism. Front Biosci. 2004;9:1977–93.
21. Pecchi E, Dallaporta M, Jean A, Thirion S, Troadec JD. Prostaglandins and sickness behavior: old story, new insights. Physiol Behav. 2009;97(3–4):279–92. 22. Chen L, Yang G, Grosser T. Prostanoids and inflammatory pain.
Prostaglandins Other Lipid Mediat. 2013;104–105:58–66.
23. Barabasi AL, Gulbahce N, Loscalzo J. Network medicine: a network-based approach to human disease. Nat Rev Genet. 2011;12(1):56–68. 24. Albert R, Barabasi AL. Statistical mechanics of complex networks. Rev Mod
Phys. 2002;74(1):47–97.
25. Latora V, Marchiori M. A measure of centrality based on network efficiency. New J Phys. 2007;9(6):188.
26. Nagurney A, Qiang Q. A network efficiency measure for congested networks. Epl-Europhys Lett. 2007;79(3):38005.
27. Park J, Lee DS, Christakis NA, Barabasi AL. The impact of cellular networks on disease comorbidity. Mol Syst Biol. 2009;5:262.
28. Jeong H, Mason SP, Barabasi AL, Oltvai ZN. Lethality and centrality in protein networks. Nature. 2001;411(6833):41–2.
29. Barabasi AL, Oltvai ZN. Network biology: understanding the cell’s functional organization. Nat Rev Genet. 2004;5(2):101–13.
30. Zhang X, Gu J, Cao L, Li N, Ma Y, Su Z, et al. Network pharmacology study on the mechanism of traditional Chinese medicine for upper respiratory tract infection. Mol BioSyst. 2014;10(10):2517–25.
31. Kanehisa M, Goto S, Furumichi M, Tanabe M, Hirakawa M. KEGG for representation and analysis of molecular networks involving diseases and drugs. Nucleic Acids Res. 2010;38(Database issue):D355–60.
32. Matthews L, Gopinath G, Gillespie M, Caudy M, Croft D, de Bono B, et al. Reactome knowledgebase of human biological pathways and processes. Nucleic Acids Res. 2009;37(Database issue):D619–22.
33. Waterfield MR, Zhang M, Norman LP, Sun SC. NF-kappaB1/p105 regulates lipopolysaccharide-stimulated MAP kinase signaling by governing the stability and function of the Tpl2 kinase. Mol Cell. 2003;11(3):685–94.
34. Gantke T, Sriskantharajah S, Ley SC. Regulation and function of TPL-2, an IkappaB kinase-regulated MAP kinase kinase kinase. Cell Res. 2011;21(1):131–45. 35. Yang Y, Yu T, Jang HJ, Byeon SE, Song SY, Lee BH, et al. In vitro and in vivo
anti-inflammatory activities of Polygonum hydropiper methanol extract. J Ethnopharmacol. 2012;139(2):616–25.
36. Tsatsanis C, Androulidaki A, Venihaki M, Margioris AN. Signalling networks regulating cyclooxygenase-2. Int J Biochem Cell Biol. 2006;38(10):1654–61. 37. Beutler B. Tlr4: central component of the sole mammalian LPS sensor. Curr
Opin Immunol. 2000;12(1):20–6.
38. Kang YJ, Wingerd BA, Arakawa T, Smith WL. Cyclooxygenase-2 gene transcription in a macrophage model of inflammation. J Immunol. 2006;177(11):8111–22. 39. Eliopoulos AG, Dumitru CD, Wang CC, Cho J, Tsichlis PN. Induction of COX-2 by
LPS in macrophages is regulated by Tpl2-dependent CREB activation signals. EMBO J. 2002;21(18):4831–40.
40. Lu YC, Yeh WC, Ohashi PS. LPS/TLR4 signal transduction pathway. Cytokine. 2008;42(2):145–51.
41. Smoot ME, Ono K, Ruscheinski J, Wang PL, Ideker T. Cytoscape 2.8: new features for data integration and network visualization. Bioinformatics. 2011;27(3):431–2.
42. Jiang X, Kumar K, Hu X, Wallqvist A, Reifman J. DOVIS 2.0: an efficient and easy to use parallel virtual screening tool based on AutoDock 4.0. Chem Cent J. 2008;2:18.
43. Park H, Lee J, Lee S. Critical assessment of the automated AutoDock as a new docking tool for virtual screening. Proteins. 2006;65(3):549–54. 44. Gu J, Gui Y, Chen L, Yuan G, Lu HZ, Xu X. Use of natural products as
chemical library for drug discovery and network pharmacology. PLoS One. 2013;8(4):e62839.
45. Acree W. Toxicity and drug testing. Rijeka: InTech; 2012.
46. Fallahi-Sichani M, Honarnejad S, Heiser LM, Gray JW, Sorger PK. Metrics other than potency reveal systematic variation in responses to cancer drugs. Nat Chem Biol. 2013;9(11):708–14.
47. Chou TC. Derivation and properties of Michaelis-Menten type and Hill type equations for reference ligands. J Theor Biol. 1976;59(2):253–76.
48. Kiefer F, Arnold K, Kunzli M, Bordoli L, Schwede T. The SWISS-MODEL repository and associated resources. Nucleic Acids Res. 2009;37(Database issue):D387–92.
Open access provides opportunities to our colleagues in other parts of the globe, by allowing
anyone to view the content free of charge.
Publish with
Chemistry
Central and every
scientist can read your work free of charge
W. Jeffery Hurst, The Hershey Company. available free of charge to the entire scientific community peer reviewed and published immediately upon acceptance cited in PubMed and archived on PubMed Central yours you keep the copyright
Submit your manuscript here: