ISSN: 2147-611X
www.ijemst.com
Science Teachers’ and Their Students’
Perceptions of Science and Scientists
Suzanne El Takach1, Hagop A. Yacoubian2
1
Lebanese University
2Lebanese American University
To cite this article:
El Takach, S. & Yacoubian, H.A. (2020). Science teachers’ and their students’ perceptions
of science and scientists.
International Journal of Education in Mathematics, Science and
Technology (IJEMST), 8(1), 65-75.
This article may be used for research, teaching, and private study purposes.
Any substantial or systematic reproduction, redistribution, reselling, loan, sub-licensing,
systematic supply, or distribution in any form to anyone is expressly forbidden.
Authors alone are responsible for the contents of their articles. The journal owns the
copyright of the articles.
Volume 8, Number 1, 2020
Science Teachers’ and Their Students’ Perceptions of Science and
Scientists
Suzanne El Takach, Hagop A. Yacoubian
Article Info
Abstract
Article History
Received: 15 August 2019
The purpose of this study was to explore school science teachers’ and their students’ perceptions of science and scientists. The participants included 116 in-service middle school chemistry teachers who attended a training program at the Faculty of Education, Lebanese University, and 250 of their students, randomly selected from a larger sample of 2345, enrolled in Grades 7-9 at Lebanese public schools all over Lebanon. Using the Draw-a-scientist-test (DAST), qualitative and quantitative data was collected from the participating teachers and their students. The teachers themselves administered the test to their students. Results showed that the stereotypical image of a scientist being a Caucasian, male, working in a lab, and conducting experiments mainly in chemistry were prevalent. There was absence of contemporary scientists and female scientists among the preferred names of scientists delivered by the students. The participants held positive attitudes towards scientists and many students were usually positive about pursuing careers in science and technology. Compared to their teachers, more students thought that scientists make inventions in the field of technology. Students in lower grades had more diverse images of scientists. The stereotypical images increased among students of higher grades and became more similar to those of their teachers and the authors of the textbooks that they use.
Accepted: 04 November 2019
Keywords
Draw-a-scientist-test Middle school Nature of science Student perceptions Scientist
Teacher perceptions
Introduction
The main purpose of this study was to explore Lebanese in-service science teachers’ and their students’ perceptions of science and scientists in order to understand how they perceived scientists and what (stereotypical) images they did possess. The participating teachers were middle school chemistry teachers and their students were enrolled in Grades 7, 8 and 9. Considering that the participating teachers were the ones who taught science and about scientists to the participating students, one focus of the study involved exploring how the teachers’ perceptions of scientists compare to those of their students. Initially proposed by Chambers (1983), Draw-A-Scientist-Test (DAST) and its various versions have been used in many research studies in various contexts to study perceptions of scientists held by science teachers (McDuffie, 2001) as well as students (e.g., Sjøberg 2000; Villar & Guppy 2015), including those at the primary (Painter & Tretter, 2006) and middle school levels (e.g., Fralick, Kearn, Thompson & Lyons, 2009). Participants’ stereotypical images of scientists were a common finding in these studies.
Some level of similarity has been reported in images of scientists among participants of different studies conducted in various parts of the world (Sjøberg, 2000; Sjøberg & Schreiner, 2006; She, 1998; Song & Kim, 1999). The present study could be thought about as a platform for DAST in Lebanon, considering that no precedent studies were conducted on a large-scale basis not only in Lebanon but also in many other Arab countries. This is not surprising considering the scarcity of published research in science education in general that comes out of the Arab world (Ayoubi, 2017). In this study the Lebanese context was scrutinized, with the purpose of identifying similarities that it shares with other contexts and highlighting particularities that it may have.
Stereotypical images of scientists are also present among pre-service and in-service science teachers. The stereotypical images that they hold are related to their learning experiences as students (Elmas, Demirdogen & Geban, 2011). In a study conducted at a Turkish university, Ünver (2010) reported that 4th year pre-service science teachers had more stereotypical views of scientists than grade 5 students. The pre-service teachers depicted scientists with glasses, beard, a white coat and a dishevelled appearance. Based on a study with 550 pre- and in-service science teachers, McDuffie (2001) reported most drawings depicted middle-aged males and almost half showed scientists to be intelligent and wearing white coats. McCarthy (2015), on the other hand, based on a study with pre-service science teachers enrolled in a College of Education at a university in Louisiana, USA, reported that about half of the 91 participants drew female scientists, and most drawings showed happy scientists. Nonetheless, the researcher reported absence of diversity in the drawings.
Despite a considerable amount of research on students’ perceptions of scientists, there exist few studies comparing elementary school students’ perception with those of teachers (e.g., Moseley & Norris, 1999). Our sample aimed at comparing upper elementary and lower middle school students’ perceptions of scientists with those of their teachers. The comparison of these two populations is significant in terms of the assumption that the teachers’ perceptions of scientists influence their students’ perception of scientists, considering that the teachers are the ones who teach science and about scientists to the elementary students. The study aimed at contributing to the literature of comparative studies between teachers’ and students’ perceptions of scientists and at setting forth implications for science teacher education.
Many researchers interested in studying teachers’ epistemic beliefs seem to share the assumption that teachers’ epistemic beliefs may affect their teaching practices (Abu Karsh, 2018; Ayoubi et al. 2017; Pajares, 1992; Uhomoibhi & Ross, 2018) and this affects their students’ understanding of science concepts and subsequently of their perceptions of science and scientists (Wells, 2015). Nevertheless, no significant correlation was reported between middle school teachers’ teaching style and their students’ perceptions of scientists (Finson, Pedersen & Thomas 2006). Jane, Fleer, and Gipps (2007) highlighted the role of the communal context and children’s engagement in hands-on, authentic and relevant scientific activities as requirements to challenge students’ views about scientists.
The Lebanese science curriculum underemphasizes science as a way of knowing (BouJaoude, 2002). On the other hand, the scientists portrayed in the Lebanese national science textbooks are predominantly white males of European descent, rational individuals who work alone, who conduct experiments in their labs by following the scientific method (Yacoubian, Al-Khatib & Mardirossian 2017). Despite some existing literature on science curricula and textbooks, little is known about the science teachers’ and their students’ perceptions of scientists. Hence, the research questions of this study were as follows:
1. What are Lebanese in-service science teachers’ perceptions of scientists? 2. What are Lebanese students’ perceptions of scientists?
3. Do Lebanese students have similar perceptions of scientists as their teachers?
Method
A sample of 116 public school science teachers participated in this study. The teachers were enrolled at an in-service teacher training program at the Lebanese University. In Lebanon science is mostly taught in a foreign language (English or French). Forty two teachers (36%) taught science in English and 74 teachers (64%) taught in French. Seventy four percent of the sample consisted of female teachers and 26% of male teachers.
The participating teachers came from schools located within different governorates of the country. Thus, all geographic locations of the country from North to South and East to West were covered. Almost all the in-service teachers teaching science in French were graduates from the Lebanese University; while almost half of those teaching in English had graduated from the Lebanese University, the other half being graduates of private universities in Lebanon. The number of years of teaching experience ranged from 2 to 22 years with an average of 9.33 years.
Two questionnaires were used in this survey that were developed through following the guidance of the Draw a Scientist Test (DAST) (Chambers, 1983), the Draw a Scientist Test – Checklist (DAST-C) (Finson & Beaver, 1995), and the ROSE-study (Sjøberg & Schreiner, 2006). These questionnaires were administered to the participating teachers during the first session of the training program. The teachers were then asked to administer the questionnaires for students in their classes, similar to the method administered by Barman (1999). All teachers submitted their students’ questionnaires back to the first author during the first month of the training program.
The total number of questionnaires derived from students was 2345. The students were enrolled in the participating teachers’ Grades 7-9 science classrooms. Considering that the current study is part of a larger study and that it was not possible to analyze all 2345 questionnaires, 250 student questionnaires were randomly selected from the larger sample of 2345. In what follows the report is based on the sample size of 250 students. In this sample, 90 students (36%) were enrolled in Grade 7, 85 students (34%) were in Grade 8, and 75 students (30%) were in Grade 9.
The participants’ drawings and responses to the open-ended questions were analyzed based on guidelines provided by Chambers (1983), Finson and Beaver (1995), and Sjøberg and Schreiner (2006). Characteristics of stereotypical images of scientist such as the scientist’s workplace (e.g., working indoors and in a chemistry lab), scientist’s gender (male only), race (Caucasian only), facial expressions (smiling or not), mythic look (e.g., looking like Frankenstein, nerd), clothing (wearing a lab coat and eyeglasses); presence of symbols of research (e.g., lab equipment such as chemistry glassware) and knowledge (e.g., books and posters); indications of danger (e.g., nuclear danger, explosions); relevant captions (e.g., chemical formulae); and presence of technology (e.g., microscope, LCD projector, etc.) were considered in analyzing the drawings. The teachers’ and students’ perceptions were analyzed not only through their drawings but also through their responses to the open-ended questions.
Descriptive statistics was used to analyze the quantitative data, mostly in terms of frequency and percentages. Qualitative data were coded, categorized and accordingly themes were derived. It is worth noting that at many instances it was not possible to categorize the participants’ drawings based on the stereotype indicators. For example, not all drawings revealed the gender of the scientist. Hence, the report is based on those which was possible to categorize. Indicators with high percentages (above 50%) were considered in making generalizations and deriving conclusions. To increase reliability, the participating teachers and the students were asked to describe their drawings in 2 sentences. In addition, the two researchers had regular meetings to analyze the data. Disagreements were resolved through discussions, further consulting the data and reaching consensus. In some cases other experienced researchers were also consulted for their input.
Results
Table 1. Frequency and percentages of stereotypes in teachers’ drawings as a function of gender Stereotype indicator Female (n= 86) Male (n= 30) Total (N= 116)
Male gender only 55
64%
19 63.3%
74 63.8%
Caucasian only 43
50%
17 56.7%
60 51.7%
Clothing 23
26.7%
11 36.7%
34 29.3% Scientist’s facial expression 17
19.8%
5 16.7%
22 19% Scientist working indoors 73
84.8%
24 80%
97 83.6% Symbols of research displayed 70
81.4%
24 80%
94 81% Symbols of knowledge 22
25.6%
4 13.3%
26 22.4% Technology represented 13
15.1%
3 10%
16 13.8%
Relevant captions 36
41.9%
5 16.7%
41 35.3%
Mythic stereotypes 20
23.2%
8 28.6%
28 24.1% Indications of danger 9
10.5%
2 6.7%
11 9.5% Table 2. Frequency and percentages of stereotypes in students’ drawings
Stereotype indicator Total (N=250)
Male gender only 64
25.6%
Caucasian only 193
77.2%
Clothing 65
26% Scientist’s facial expression 56
22.4% Scientist working indoors 178
71.2% Symbols of research displayed 60
24%
Symbols of knowledge 31
12.4% Technology represented 35
14%
Relevant captions 18
7.2%
Mythic stereotypes 0
0% Indications of danger 8
3.2%
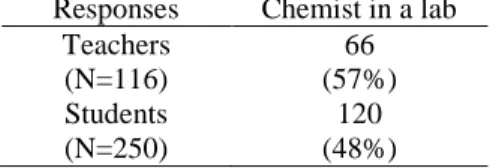
More than half of the participating teachers and almost half of the students hold the stereotypical image of a chemist working in the lab (see Table 3). The percentage of students possessing this stereotype increases with grade level (see Table 4).
Table 3. Stereotypical image of a chemist in a lab by teachers and their students Responses Chemist in a lab
Table 4. Students’ stereotypical image of a chemist in a lab as a function of grade level Grade 7
(n = 90)
Grade 8 (n = 85)
Grade 9 (n = 75)
Total (N = 250) Chemist in a lab 32 (35.5%) 43 (50.5%) 45 (60%) 120 (48%)
Most three frequent teacher responses to what scientists are doing in their drawings involve conducting experiments, applying previous experiments and searching (see Table 5).
Table 5. Most frequent teacher responses to what the scientists are doing Teacher
responses
Female (n= 86)
Male (n=30)
Total (N=116)
Conducting experiments 63 (73.2%) 21 (70%) 84 (72.4%)
Applying previous experiments 69 (80.2%) 24 (80%) 93 (80.1%)
Searching 56 (65.1%) 17 (56.7%) 73 (63%)
Writing reports 41 (47.7%) 14 (46.7%) 55 (47.4%)
Reading books 30 (34.9%) 11 (36.7%) 41 (35.3%)
Attending Conferences 4 (4.7%) 0 (0%) 4 (3.4%)
Doing Sports 3 (3.5%) 2 (6.7%) 5 (4.3%)
As for students, their most frequent three responses include conducting an experiment, conducting a chemistry experiment and making inventions in the field of technology (see Table 6). In addition, students’ responses show more variety than those of their teachers.
Table 6. Most frequent student responses to what the scientists are doing Student
responses
Total (N=250) Doing an experiment (steps of the scientific method) 53 (21.2%)
Doing a chemistry experiment 43 (17.2%)
Inventing/ inventing technology such as computer, radio, TV 39 (15.6%) Inventing/ physics and nuclear inventions/ inventing flying
machine
24 (9.6%)
Medical inventions for children 17 (6.8%)
Explaining about nature and life 11(4.4%)
Reading a book, an article 9 (3.6%)
Researching, publishing 8 (3.2%)
Writing books and articles 8(3.2%)
Poet, sculptor, farmer, astronaut 6 (2.4%)
Others: selling physical products, selling his books, relaxing, swimming, eating, doing sport, teaching, doing scientific trips, drawing, etc.
32 (12.8%)
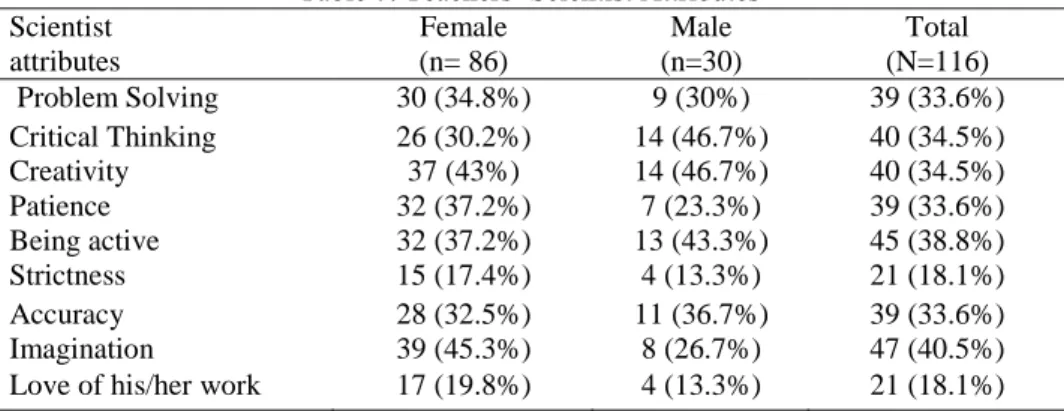
The participating teachers and students have provided mostly positive attributes for scientists (Tables 7 and 8). The teacher responses are more focused on work-related attributes of scientists compared to those of their students, who have provided several examples of humanistic attributes of scientists.
Table 7. Teachers’ Scientist Attributes Scientist
attributes
Female (n= 86)
Male (n=30)
Total (N=116)
Problem Solving 30 (34.8%) 9 (30%) 39 (33.6%)
Critical Thinking 26 (30.2%) 14 (46.7%) 40 (34.5%)
Creativity 37 (43%) 14 (46.7%) 40 (34.5%)
Patience 32 (37.2%) 7 (23.3%) 39 (33.6%)
Being active 32 (37.2%) 13 (43.3%) 45 (38.8%)
Strictness 15 (17.4%) 4 (13.3%) 21 (18.1%)
Accuracy 28 (32.5%) 11 (36.7%) 39 (33.6%)
Imagination 39 (45.3%) 8 (26.7%) 47 (40.5%)
Table 8. Students’ scientist attributes
Scientist attributes Total (N=250) Observation, analysis, thinker, reflection 20 (8%)
Creative 18 (7.2%)
Inventor 16 (6.4%)
Communicate with others/with students 16 (6.4%)
Loves his/her work 16 (6.4%)
Active/has a healthy life 16 (6.4%)
Organized 15 (6%)
Imagination 15 (6%)
Explorer 14 (5.6%)
Helps others 13 (5.2%)
Generous 13 (5.2%)
Cares for others 12 (4.8%)
Sociable 12 (4.8%)
Improves himself/herself 11(4.4%)
Explorer 10 (4%)
Hard worker 9 (3.6%)
Serious 7 (2.8%)
Manager 6 (2.4%)
Doesn’t sleep 6 (2.4%)
Stays alone 5 (2%)
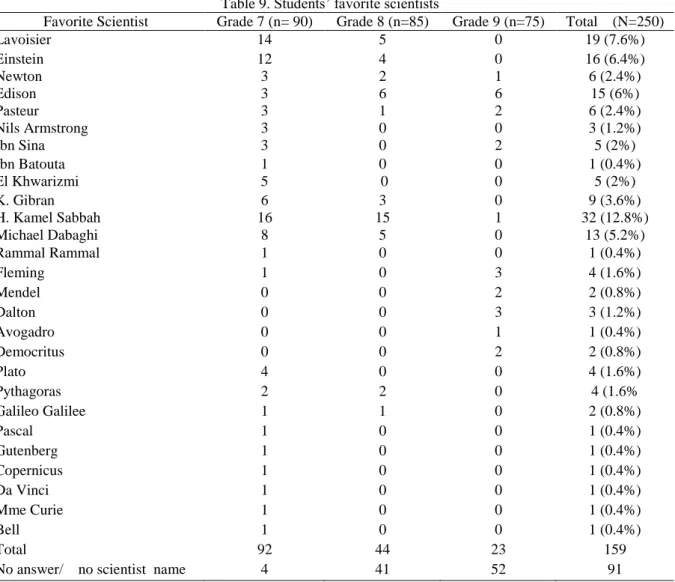
Table 9 shows that the participating students mostly named deceased scientists as their favourite ones. Table 9. Students’ favorite scientists
Favorite Scientist Grade 7 (n= 90) Grade 8 (n=85) Grade 9 (n=75) Total (N=250)
Lavoisier 14 5 0 19 (7.6%)
Einstein 12 4 0 16 (6.4%)
Newton 3 2 1 6 (2.4%)
Edison 3 6 6 15 (6%)
Pasteur 3 1 2 6 (2.4%)
Nils Armstrong 3 0 0 3 (1.2%)
Ibn Sina 3 0 2 5 (2%)
Ibn Batouta 1 0 0 1 (0.4%)
El Khwarizmi 5 0 0 5 (2%)
K. Gibran 6 3 0 9 (3.6%)
H. Kamel Sabbah 16 15 1 32 (12.8%)
Michael Dabaghi 8 5 0 13 (5.2%)
Rammal Rammal 1 0 0 1 (0.4%)
Fleming 1 0 3 4 (1.6%)
Mendel 0 0 2 2 (0.8%)
Dalton 0 0 3 3 (1.2%)
Avogadro 0 0 1 1 (0.4%)
Democritus 0 0 2 2 (0.8%)
Plato 4 0 0 4 (1.6%)
Pythagoras 2 2 0 4 (1.6%
Galileo Galilee 1 1 0 2 (0.8%)
Pascal 1 0 0 1 (0.4%)
Gutenberg 1 0 0 1 (0.4%)
Copernicus 1 0 0 1 (0.4%)
Da Vinci 1 0 0 1 (0.4%)
Mme Curie 1 0 0 1 (0.4%)
Bell 1 0 0 1 (0.4%)
Total 92 44 23 159
As seen from Table 9, all their favourite scientists are males with the exception of one grade 7 student who has cited Madame Curie. The list is more diverse for grade 7 students compared to that of grades 8 and 9. It contains higher number of names of Arab scientists as well as Lebanese doctors and scientists. Based on data reiteration, these names were mentioned by the grade 7 students irrelevant of the school location. Grade 9 students mentioned scientists such as Avogadro, Mendel and Dalton, which were absent in lower grades.
Table 10 shows that almost half of the participating students are positive about pursuing careers as scientists and almost two thirds of the students are positive about pursuing careers in technology.
Table 10. Frequency and percentages of students who like to be scientists and who like to work in technology (N=250)
Item Yes
I like to be a scientist 133 (53.2%) I like to work in technology 168 (67.2%)
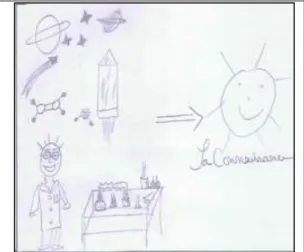
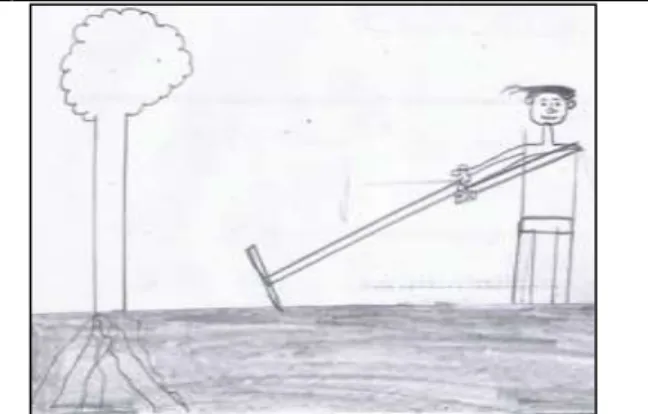
Figures 1 and 2 show sample drawings of teachers and students at different grade levels. The student drawings were richer and more diverse compared to their teachers’ drawings.
a. The scientist is preparing chemical reagents and he realizes identification tests
b. A scientist is enjoying his work while he makes lab investigations. He is trying to answer his question about the universe and he develops knowledge
c. A scientist thinks about possible solutions for environmental problems and how humans can live better
d. A happy chemist who made a new experiment with success
a. A scientist who builds aircrafts b. A farmer is a scientist, because he learned what are his land needs: water and nutrients
c. A scientist is doing an experiment to be applied in the future
d. Teacher doing an experiment to produce CO2
e. My teacher preparing mixtures f. Teacher doing a physics demonstration about electrolysis
Figure 2. Examples of students’ drawings (a: Grade 7 female students; b: Grade 7 male student; c: Grade 8 female student; d: Grade 8 male student; e: Grade 9 female student; f: Grade 9 male student)
Discussion and Conclusions
It is worth noting that the participating teachers and their students mostly held positive attitudes towards scientists. Not only did they give positive attributes to characterize scientists but also their drawings did not include mythical stereotypes such as dangerous, nerd and mad individuals isolated from society. This is aligned with the findings reported by El Takach (2018) within the context of pre-service science teachers in Lebanon and unlike studies conducted in other Western contexts (e.g., Archer et al., 2010; Koren & Bar, 2009). In addition, the participating students were usually positive about pursuing careers in science and technology. This is again unlike studies in certain Western contexts (e.g., Murphy & Beggs, 2005; Osborne, Simmons & Collins, 2003) but quite similar to the findings reported by DeWitt et al. (2010) within the context of ethnic minorities, where Asian students revealed high attitudes and aspirations in science. We believe that the immediate society of these students might have played a role here, considering that many perceive that careers in science and technology would facilitate upward mobility, provide better economic opportunities and easier access for immigration to developed countries. This is open for future research.
Compared to their teachers, more students thought that scientists make inventions in the field of technology. This is perhaps related to the fact that students are digital natives compared to their teachers (Autio, 2016; Gündoğmuş, Orhan, & Şahin, 2016; Koumachi, 2019; Prensky, 2001; Pambayun et al., 2019; Serhan, 2019; Walters, Gee, & Mohammed, 2019; Vu & Feinstein, 2017). Moreover, the images of scientists drawn by the students were rich and diverse, which can be due to the multicultural Lebanese society. However, the images were more diverse among students in lower grades compared to those in higher grades and to their teachers. In addition, more students, especially in grade 7, had a humanistic view of scientist, thus appreciating their human attributes in addition to their work-related characteristics.
The stereotypical images of scientists increased among students of higher grades. This finding is aligned with other findings in the literature (DeWitt, Archer & Osborne, 2013; Finson & Beaver, 1995; Narayan, Park, Peker, & Suh, 2013). Grade 9 students’ perceptions of scientists were more similar to their teachers’ perceptions compared to the grade 7 students’ perceptions. Particularly at lower grade levels, students’ perceptions about scientists were less similar to those of their teachers. These students do not seem to be directly influenced by their teachers’ perceptions of scientists even if the teachers might indirectly and implicitly transmit some of their perceptions to students. There may be several factors such as media, cartoons and movies that can shape the students’ perceptions of scientists. Future studies should target studying the impact of some of these factors.
There was almost complete absence of contemporary scientists and female scientists in the citations of students. Moreover, even though grade 7 students cited diverse range of scientists as their favorite ones, the diversity decreased with grade level. Grade 9 students’ preferences became more restricted to scientists of European decent as well as to scientists portrayed in their science textbooks. In fact in grade 9 the student perceptions of scientists and their drawings became more similar to the perceptions of the authors of the national science textbooks that they use as well as to the illustrations of scientists found inside those textbooks. These findings complement those reported by Yacoubian et al. (2017) within the context of K-9 national science textbooks used in Lebanon. The researchers reported absence of female as well as Lebanese and Arab scientists in Lebanese national science textbooks. This indicates that science textbooks have an important role in shaping students’ perceptions of scientists even if they are not the only source. Future research needs to target why students in younger grades are more prone to cite Lebanese scientists compared to their peers in higher grade levels. The present study has implications for classroom practice as well as for science teacher education. Based on the findings of this research it is recommended that science as a way of thinking becomes part of the explicit curriculum of school science and university science education courses. This entails integrating history, philosophy and sociology of science in developmentally appropriate ways. Learners need to be encouraged to reflect on their perceptions of science and scientists. Learners’ images of scientists say much about their understandings of the nature of science. Science teachers and university professors can make use of student images to engage the learners in explicit reflective discussions on the nature of science. This is important in order to target misinformed views about science that the learners might possess. Moreover, school teachers and university professors can develop their courses relying on material that embraces multiculturalism and that highlights the contributions of diverse scientists including female and non-Western scientists in science knowledge production.
References
Abu Karsh, S. (2018). New technology adoption by business faculty in teaching: Analyzing faculty technology adoption patterns. International Journal of Technology in Education and Science (IJTES), 2(1), 17-30. Ajai, J.T. & Imoko, I.I. (2015). Gender differences in mathematics achievement and retention scores: A case of
problem based learning method. International Journal of Research in Education and Science (IJRES), 1(1), 45- 50.
Akcay, B. (2011). Turkish elementary and secondary students’ views about science and scientist. Asia-Pacific Forum on Science Learning and Teaching, 12 (1). Article 5, p. 1.
Archer, L., DeWitt, J., Osborne, J., Dillon, J., Willis, B., & Wong, B. (2010). ―Doing‖ science versus ―being‖ a scientist: Examining 10/11-year-old schoolchildren’s constructions of science through the lens of identity. Science Education, 94(4), 617-639.
Autio, O. (2016). Traditional craft or technology education: Development of students’ technical abilities in Finnish comprehensive school. International Journal of Research in Education and Science (IJRES), 2(1), 75- 84.
Ayoubi, Z. (2017). Research in science education in Lebanon: Paper presented at the conference entitled ―In Arab Educational Periodicals in Science Education: A Critical Review in Light of International Trends”. Amman, Jordan, July 6, 2017. www.shamaa.org.
Ayoubi, Z., El Takach, S. & Rawas, M. (2017). Improving the pedagogical content knowledge (PCK) among cycle 3 in-service chemistry teachers attending the training program at the faculty of education, Lebanese University. Journal of Education in Science, Environment and Health (JESEH), 3(2), 196-212. DOI:10.21891/jeseh.326753.
Baldu, M. (2006). Young children’s perceptions of scientists: a preliminary study. Educational Research, 48(1), 121–132.
Barman, C. R. (1999). Students’ views about scientists and school science: Engaging k-8 teachers in a national study. Journal of Science Teacher Education, 10, 43-54.
BouJaoude, S. (2002). Balance of scientific literacy themes in science curricula: the case of Lebanon. International Journal of Science Education, 24(2), 139–156.
Bovina, I. B. & Dragul’Skaia, I. U. (2008). College students’ representations of science and the scientist. Russian Education and Society, 50(1), 44-64.
Camci-Erdogan, S. (2019). How do prospective elementary and gifted education teachers perceive scientists and distinguish science from pseudoscience? Journal of Education in Science, Environment and Health (JESEH), 5(1), 119-133. DOI:10.21891/jeseh.487304
Chambers, D. W. (1983). Stereotypic images of the scientist: the draw-a-scientist test. Science Education, 67(2), 255–265.
DeWitt, J., Archer, L., & Osborne, J. (2013). Nerdy, brainy and normal: children’s and parents’ constructions of those who are highly engaged with science. Research in Science Education, 43(4), 1455–1476.
Dewitt, J., Archer, L., Osborne, J., Dillon, J., Willis, B., & Wong, B. (2010). High aspirations but low progression: The science aspirations – careers paradox amongst minority ethnic students. International Journal of Science and Mathematics Education, 9(2):243-271.
El Takach, S. (2018). How Do Early Childhood Education Pre-service Teachers view Science and Scientists? The Eurasia Proceedings of Educational and Social Science, 9, 104-119. Retrieved from http://dergipark.org/epess/issue/38900/457749.
Elmas, D., Demirdogen, B., & Geban, O. (2011). Preservice chemistry teachers’ images about science teaching in their future classrooms. Hacettepe Üniversitesi Eğitim Fakültesi Dergisi (H. U. Journal of Education), 40, 164–175.
Erten, S., Kiray, S.A., & Sen-Gumus, B. (2013). Influence of scientific stories on students ideas about science and scientists. International Journal of Education in Mathematics, Science and Technology, 1(2), 122-137.
Finson, K. D., Beaver, J. B., & Cramond, B. L. (1995). Development of and field-test of a checklist for the draw-a-scientist test. School Science and Mathematics, 95(4), 195–205.
Finson, K. D., Thomas, J., & Pedersen, J. (2006). Comparing science teaching styles to students’ perceptions of scientists. Faculty Publications: Department of Teaching, Learning and Teacher Education. 88. https://digitalcommons.unl.edu./teachernfacpub/88
Fralick, B., Kearn, J., Thompson, S., & Lyons, J. (2009). How middle schoolers draw engineers and scientists. Journal of Science Education & Technology, 18(1), 60-73.
Gündoğmuş, N., Orhan, G., & Şahin, İ. (2016). Foreign language teaching with augmented reality application. The Eurasia Proceedings of Educational & Social Sciences, 4, 309-312.
Koren, P., & Bar, V. (2009). Science and its images—Promise and threat: From classic literature to contemporary students’ images of science and ―the scientist‖. Interchange, 40(2), 141–163.
Koumachi, B. (2019). The digital turn in higher education: ―Digital natives‖ mythbusted. International Journal of Technology in Education and Science (IJTES), 3(1), 56-62.
Mason, C. L., Kahle, J. B., & Gardner, A. L. (1991). Draw-a-scientist test: future implications. School Science and Mathematics, 91, 193–198.
McCarthy, D. (2015). Teacher candidates’ perceptions of scientists: images and attributes. Educational Review, 67, 389-413. DOI: 10.1080/00131911.2014.974510.
McDuffie, T. E. (2001). Scientists – geeks and nerds? Science and Children 38 (8): 16–19.
Moseley, C. & Norris, D. (1999). Preservice teachers’ views of scientists. Science and Children, 37(1), 50-56. Murphy, C. & Beggs, J. (2005). Primary science in the UK: A scoping study. Final report to the Wellcome
Trust. London: Wellcome Trust.
Narayan, R., Park, S., Peker, D., & Suh, J. (2013). Students’ images of scientists and doing science: An international comparison study. Eurasia Journal of Mathematics, Science & Technology Education, 9(2), 115-129.
Osborne, J. F., Simon, S. & Collins, S. (2003). Attitudes towards science: A review of the literature and its implications. International Journal of Science Education, 25(9), 1049–1079.
Painter, P. & Tretter, T. R. (2006). Pulling back the curtain: Uncovering and changing students’ perceptions of scientists. School Science and Mathematics, 106(4), 181-190.
Pajares, M. F. (1992). Teachers’ beliefs and educational research: cleaning up a messy construct. Review of Educational Research, 62(3), 307-332.
Pambayun, B., Wirjawan, J. V., Herwinarso, H., Wijaya, A., Untung, B., & Pratidhina, E. (2019). Designing Mobile Learning App to Help High School Students to Learn Simple Harmonic Motion. International Journal on Social and Education Sciences, 1(1), 24-29.
Schibeci, R.A. & Sorensen, I. (1983). Elementary school children's perceptions of scientists. School of Science and Mathematics, 83(1), 14-19.
Serhan, D. (2019). Web-Based Homework Systems: Students’ Perceptions of Course Interaction and Learning in Mathematics. International Journal on Social and Education Sciences, 1(2), 57-62.
She, H. C. (1998). Gender and grade level differences in Taiwan students’ stereotypes of science and scientists. Research in Science and Technological Education, 16(2), 125–135.
Sjøberg, S. & Schreiner, C. (2006). How do students perceive science and technology? Science in School, Issue 1: Spring 2006. Retrieved March 3, 2012, from: www.scienceinschool.org
Sjøberg, S. (2000). Science and scientists: the SAS study. Retrieved April 4, 2005, from http://folk.uio.no/sveinsj/SASweb.htm.
Song, J., & Kim, K. S. (1999). How Korean students see scientists: the images of the scientist. International Journal of Science Education, 21(9), 957–977.
Uhomoibhi, J. & Ross, M. (2018). Many-body approaches to cross-level and multidisciplinary initiatives for encouraging learners into STEM from primary to further and higher education. International Journal of Technology in Education (IJTE), 1(1), 29-34.
Ünver, A. O. (2010). Perceptions of scientists: A comparative study of fifth graders and fourth year student teachers. Necatibey Faculty of Education Electronic Journal of Science and Mathematics Education, 4(1), 11-28.
Vu, P. & Feinstein, S. (2017). An exploratory multiple case study about using game-based learning in STEM classrooms. International Journal of Research in Education and Science (IJRES), 3(2), 582-588. DOI: 10.21890/ijres.328087
Walters, M.G., Gee, D., & Mohammed, S. (2019). A literature review: Digital citizenship and the elementary educator. International Journal of Technology in Education (IJTE), 2(1), 1-21.
Wells, S. (2015). Why early childhood Education is so important. The Steven Spangler Science Website. Making Science Fun! Retrieved: 8.10.2015.
Yacoubian, H., Al-Khatib, L & Mardirossian, T. (2017). Analysis of the Image of Scientists Portrayed in the Lebanese National Science Textbooks. Science & Education, 26, 513–528.
Author Information
Suzanne El Takach
Science and Mathematics Department Faculty of Education, Lebanese University Beirut, Lebanon
Contact e-mail: [email protected]
Hagop A. Yacoubian