O R I G I N A L R E S E A R C H
Open Access
Active-reactive scheduling of active
distribution system considering interactive
load and battery storage
Qixin Chen, Xiangyu Zhao and Dahua Gan
*Abstract
Distributed generation (DG) are critical components for active distribution system (ADS). However, this may be a serious impact on power system due to their volatility. To this problem, interactive load and battery storage may be a best solution. This paper firstly investigates operation characteristics of interactive load and battery storage, including operation flexibility, inter-temporal operation relations and reactive power relations. Then, a multi-period coordinated active-reactive scheduling model considering interactive load and battery storage is proposed in order to minimize overall operation costs over a specific duration of time. The model takes into accounts operation characteristics of interactive load and battery storage and focuses on coordination between DGs and them. Finally, validity and effectiveness of the proposed model are demonstrated based on case study of a medium-voltage 135-bus distribution system.
Keywords:Active distribution system, Active-reactive scheduling, Interactive load, Battery storage
1 Introduction
Active distribution system (ADS) is defined as distribu-tion networks that have systems in place to control a combination of distributed energy resources (DERs), in-cluding distributed generators (DGs), battery storage, demand response, etc. [1]. In recent, high levels of DERs that could be efficiently scheduled are being integrated in order to achieve specific operational objectives, for example, costs minimization. Therefore, it would be necessary for the Distribution System Operators (DSOs) to transform from the traditional “passive” uni-directional flow operation approach to novel “active” bi-directional flow operation approach [2]. To this end, a critical challenge is to formulate the operation charac-teristics of different kinds of DERs and integrate them into the scheduling scheme of ADS.
At present, many interesting researches related to the operation of ADS have been conducted [3–6]. Pilo et al. [1] and Keane et al. [7] proposed models and method-ology to minimize system operation cost by optimizing the production of the local DGs, including the wind tur-bine, photovoltaic, considering power exchanges with
the main distribution system. As power outputs of DGs are always restricted by meteorological factors [7], the volatility characteristics become a heavy burden to the DSOs. In this case, battery storage could serve as an option for accommodating volatile outputs of DGs [8]. An optimal model for ADS proposed in [9] contains DGs and battery storage, but only take the capacity limi-tation of battery storage into consideration. Further, the relation between active-reactive power outputs of battery storage is considered in [10–12], and the active-reactive coordination model for DGs and battery storage is proposed.
Though battery storage could solve the volatility of DGs, their high investment cost may increase the total operation cost of the distribution system [13]. Therefore, demand response may be another solution. In fact, de-mand response is a price mechanism between DSOs and the local users, and interactive load is an important type of demand response. Under the agreement, the DSOs could change the original load shape, while users could get some payback from the DSOs. Compared to battery storage, demand response could achieve similar aims and, at the same time, there would be hardly no in-vestment cost. Dozens of demand response projects have been established and operated in many countries * Correspondence:[email protected]
State Key Lab of Power Systems; Dept. of Electrical Engineering, Tsinghua University, Beijing 100084, China
[14–18]. While an optimal model of ADS considering demand response and battery storage is not yet proposed.
Based on the above analysis, this paper focuses on multi-period coordinated active-reactive scheduling of ADS considering demand response and battery storage. Firstly, we design a new form of demand response, namely interactive load and the structure of battery stor-age is also analyzed. Then, the problem description and the mathematical model of interactive load and battery storage are presented. Based on these model, a novel multi-period active-reactive coordinated scheduling model is proposed for integrated operation of ADS, in order to minimize overall operation costs over a specific duration of time. The model takes into accounts oper-ation characteristics of various DERs and formulates multi-period operation of ADS. Finally, validity and ef-fectiveness of the proposed model are demonstrated based on case study of a medium-voltage 135-bus distri-bution system.
2 Flexible operation of interactive load and battery storage
2.1 Introduction to interactive load
According to the report of Federal Energy Regulatory Commission about demand response (DR) and advanced metering, DRs could be divided into 15 types on the basis of their response form, such as Direct Load trol, Interruptible Load, Critical Peak Pricing with Con-trol, etc.
Interactive Load designed in this paper is a combin-ation of Direct Load Control, Demand Bidding and Buy-back. Its basic feature is that the DSOs would obtain the right to invoke the electrical equipment according to the agreement, thus the shape of power load could be chan-ged to the most economical way. While at the same time, consumers could get economic compensation due to their participations in load shifting.
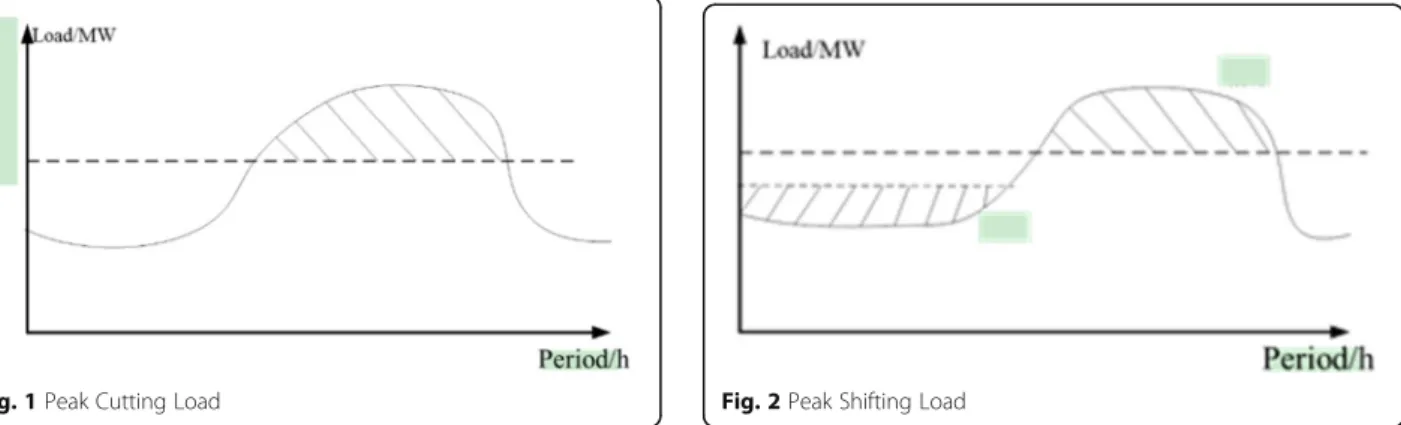
According to the effect on the load curve, interactive load could be divided into Peak Cutting Load and Peak Shifting Load. As shown Fig. 1, Peaking Cutting Load
would restrict power load during Peaking period and cause the loss of electricity consumption. While the load cut during peak period by Peak Shifting Load would be shifted to the valley period and the electricity consump-tion could be remained, as shown as Fig. 2. (Please delete the following‘Fig. 2 Peak Shifting Load’, it’s added automatically when building up the PDF and I cannot tell why).
In fact, Peak Cutting Load is another category of Peak Shifting Load whose load cut during peak period wouldn’t be compensated. And considering that Peak Cutting Load may cause uncontrollable load rebound during valley period, this paper focuses on the Shifting one. Furthermore, it could be divided into two types, namely Shapeable Load and Removable Load. Their characteristic and modeling will be presented in the fol-lowing chapters.
2.2 Characteristic and modeling of shapeable load 2.2.1 Introduction to shapeable load
As shown in Fig. 3, Shapeable Load could change the load shape during load shifting according to the agree-ment, but electricity consumption and the duration time of Shapeable load should be remained.
2.2.2 Load shifting potential analysis of shapeable load
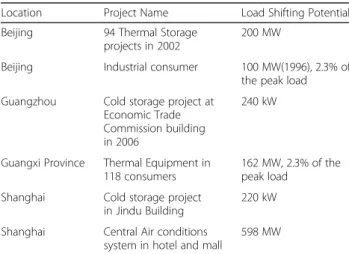
Thermal storage, such as large-scale central conditioning system, is an important resource of Demand Side Re-sponse. Its application could be described as Shapeable Load and its electrical characteristics is described in.
The thermal storage projects implemented in China are investigated in this paper and the load shifting po-tential is listed in Table 1.
2.3 Characteristic and modeling of removable load 2.3.1 Introduction to removable load
Compared with Shapeable Load, Removable Load has strict requirements when shifting. As shown in Fig. 4, it requires that load shape should stay the same.
2.3.2 Load shifting potential analysis of removable load
Removable Load can be used to describe the production process transfer of industrial user. Industrial production tend to have a relatively fixed production process. So when transferring their production process, their load shape should be the same.
This paper investigates load shifting potential of indus-trial users in Beijing, China. The results of the survey are shown in Table 2. Total load shifting potential is 90 ~ 120 MW, about 2.5% of the peak load. If all the load shifting potential of industrial users could be made full use of, power grid operation will be improved significantly.
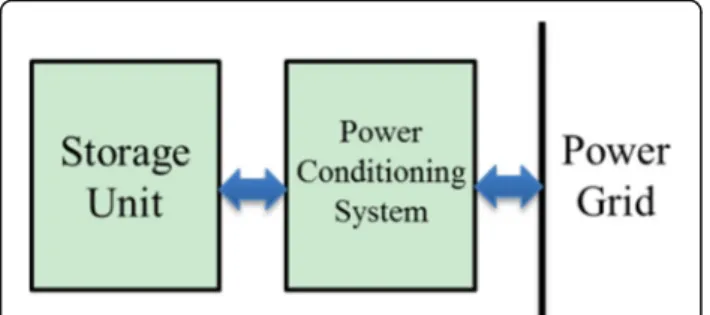
2.4 Characteristic and modeling of battery storage According to the energy storage form, battery storage can be divided into superconducting energy storage, chemical battery energy storage, flywheel energy storage, etc. Though their energy storage form are quite differ-ent, they share similar structure. As shown in Fig. 5, generally speaking, battery storage includes two compo-nents. Storage unit is used for energy storage, its cap-acity decides how much power energy can be stored in
the battery. Power conditioning system (PCS) is an elec-tric power device, which is used to exchange power en-ergy with the power grid. Its control mode decides active and reactive power of the battery.
3 Methods
3.1 Modeling of interactive load
This section is focus on formulations on operation char-acteristics of shapeable load and the removable one. The analyzed characteristics include load shifting cost curve, load shifting position and constraints for load shape and electricity consumption.
3.1.1 Load shifting cost curve
For describing the load shifting cost, load shifting cost curve is designed as shown in Fig. 6. The farther load is shifted, the heavier it changes the habit of users, so the cost will be more expensive. Thus, we can get a load shifting cost curve like a “tub”. The load shifting cost could be expressed as:
CIL¼X
T
i¼1
XNSL j¼1
λshift i;j PSL
;A i;j þ
XT i¼1
XNRL j¼1
λshift i;j
PRLi;j;A
ð1Þ
where CIL denotes total load shifting cost of interactive load, including two parts, the cost of shapeable load and it of removable load.Tdevotes the total period number.NSL Fig. 3Shapeable Load
Table 1Load shifting potential analysis of thermal storage in China
Location Project Name Load Shifting Potential
Beijing 94 Thermal Storage
projects in 2002
200 MW
Beijing Industrial consumer 100 MW(1996), 2.3% of
the peak load
Guangzhou Cold storage project at Economic Trade Commission building in 2006
240 kW
Guangxi Province Thermal Equipment in 118 consumers
162 MW, 2.3% of the peak load
Shanghai Cold storage project
in Jindu Building
220 kW
Shanghai Central Air conditions
system in hotel and mall
598 MW
As a conclusion, load shifting potential of Shapeable Load would be enormous as thermal storage projects are promoted widely in China
Fig. 4Removable Load
Table 2Load shifting potential analysis of industrial users in Beijing
Industrial User Name Load Shifting Potential(MW)
Shougang Corporation 50
Tegang Corporation 10 ~ 20
Yanhua Corporation 5 ~ 10
Chemical Industry 10 ~ 20
Building Materials Industry 10
andNRLrespectively denote the number of shapeable load and removable load. λshifti;j denotes the load shift cost of shapeable load or removable load jat period i. PSLi;j;A and PRLi;j;A respectively denote the load of shapeable loadjand
removable loadjat periodiafter their shifting.
3.1.2 Load shifting position
In order to describe load shifting position of interactive load, we introduce a set of state variables, ηSL
i;j and ηRLi;j,
respect-ively denoting whether the head of shapeable loadjand re-movable load jis shifted to periodi. It should be ensured that every head of shapeable load or removable load can be shifted to only one position. And in order to not affect oper-ation of next day, the state variables fromηSL
T−T0;jtoη
SL
T;jand
fromηRLT−T0;jtoηRLT;jare set to 0. It could be expressed as:
XT i¼1
ηSL i;j ¼1
XT i¼1
ηRL i;j ¼1
ηSL
i;j ¼0 i¼T−TSL0;jþ1;⋯T
ηRL
i;j ¼0 i¼T−TRL0;jþ1;⋯T
8 > > > > > > > > > < > > > > > > > > > :
ð2Þ
Where TSL0;j and ηRL0;j respectively denotes the length of shapeable loadjand removable loadj.
3.1.3 Constraints for load shape and electricity consumption
Load shape of shapeable load could be changed before and after shifting, but electricity consumption should be the same. While load shape of removable load should be the same. Load at periodicould be expresses as:
XT m¼1
PSLm;;jA¼
XTSL
0;j
m¼1 PSLm;;jB
PSLj
X
m¼i−TSL
0;jþ1 i
ηSL
m;j≤PSLi;j;A≤P
SL
j
X
m¼i−TSL
0;jþ1 i
ηSL m;j
PRLi;j;A¼
XTRL
0;j
m¼1
ηSL
i−mþ1;jP RL;B m;j
8 > > > > > > > > > > > > < > > > > > > > > > > > > :
ð3Þ
where PSLi;j;A and PRL ;A
i;j respectively denote the load of
shapeable load jand removable load jat periodi before their shifting. PjSL and PSLj denote the upper and lower
bounds of shapeable loadj.
The relation between active and reactive load of inter-active load is complicated. It’s assumed that their power factor stay the same before and after shifting. It could expressed as:
PSLi;j;A¼CSLj QSL ;A i;j
PSLi;j;B¼CSLj QSL ;B i;j
PRLi;j;A¼CRLj QRL ;A i;j
PRLi;j;B¼CRLj QRL ;B i;j
8 > > > > > > > < > > > > > > > :
ð4Þ
where CSLj and CRLj respectively denote the fixed
coeffi-cient between active load and reactive load of shapeable loadjand removable loadj.
3.2 Modeling of battery storage
This section is focus on formulations on operation characteristics of battery storage. The analyzed Fig. 5The Structure of Battery Storage (should be Fig. 5, it’s changed
to Fig. 1 after building the PDF and I cannot figure out why)
characteristics include operation cost for battery, con-straints for energy storage, power exchange and state transition number.
3.2.1 Constraints for energy storage
It must be insured that the stored energy is within the storage capacity limitation at any period. Besides power loss should also be taken into consideration, including the loss within charging process, discharging process and storage process. This paper converts all these losses into charging process in order to simplify the issue. Then the stored energy at final period should be equal to that at initial period after considering limitations. All these constraints could be expressed as:
ESj≤E S;pre
j þ
Xi n¼1
μS j PS
;C
n;j ΔT−PS ;D n;j ΔT
≤ESj
i¼1⋯T
XT n¼1
μS j PS
;C n;j−PS
;D n;j ¼0
8 > > > > > > < > > > > > > :
ð5Þ
whereEjS andES
j denote the upper and lower bounds of
storage capacity of battery storage j. ESj;pre denotes the
initial stored energy. PSi;;jC and PSi;;jD respectively denote
the active power charged or discharged between battery storage jand the grid at period i. uS
j is the loss rate of
the storage batteryjat charge process.
3.2.2 Constraints for power exchange
Device type and control mode of PCS decides the active and reactive power characteristics of battery storage. Now-adays, full-controlled electrical devices are widely used in battery storage, thus making the battery could operating in four-quadrant zone as shown in Fig. 7. Constraints for ac-tive and reacac-tive power could be expressed as:
PSi;;jC
2
þ QSi;j
2
≤ SSj 2
PSi;;jD
2
þ QSi;j
2
≤ SSj 2
PSi;;jC≥0
PSi;;jD≥0
8 > > > > > > > > < > > > > > > > > :
ð6Þ
where QSi;j denote reactive power of the battery storagej
at periodiandSSj denote the power bound to the battery
storagej.
3.2.3 Constraints for state transition number
Lifetime of battery storage is highly affected by their state transition number. To prolong the lifetime of bat-tery storage, only one cycle charge/discharge per day is
typically chosen for optimal operation. Considering the continuity of battery storage operation, as shown in Fig. 8, every storage would go through one charge/discharge state change and one discharge-charge state change. These constraints could be expressed as:
ηS;S i;j ;ηS
;CD i;j ;ηS
;DC i;j ∈f0;1g
ηS;S
i;j −ηiS−;S1;j−ηSi;j;CDþηSi;;jDC¼0
XT i¼1
ηS;CD i;j ¼1
XT i¼1
ηS;DC i;j ¼1
8 > > > > > > > > > > > < > > > > > > > > > > > :
ð7Þ
whereηSi;;jS denotes the state of battery storagejat period
i. It will be set to one when the battery is in discharge process, while zeros corresponds to the charge process.
ηS;CD
i;j and ηS ;DC
i;j respectively denote the operation state
change from charge process to discharge process and from discharge process to charge process. It’s guaranteed by the second sub-formula in (8) that ηSi;;jCD will be assigned as one if the operation state of battery storagej
is changed from charge process to discharge process at period i. While it will be zero at other period. Similar situation can be implemented to ηSi;;jDC as it will be assigned as one if the operation state of battery storagej is changed from discharge process to charge process at period i. Besides the third and fourth sub-formula guar-antee that the state transition number would be just one.
3.2.4 Operation cost for battery storage
Operation cost for battery storage includes the depreci-ation of investment cost and daily operdepreci-ation cost. The depreciation of investment cost could be expressed by a fixed constant and daily operation cost could be calcu-lated by the exchanged power. These relation could be expressed as:
CBSj ¼MjBS;Dþ
XT i¼1
λS;P j PS
;C i;j þλS
;Q j QSi;j
ð8Þ
whereCBSj andMjBS;D denote the total operation cost and
the depreciation of investment cost of battery storage j.
λjS;P and λjS;Q are the active and reactive cost coefficients
of battery storagej.
4 Multi-period coordinated scheduling model considering battery storage and interactive load 4.1 Decision variables
The decision variables include continuous ones for active and reactive power of source bus, distributed gen-eration, battery storage as well as interactive load, and “0–1” binary integer ones for operation states of battery storage and interactive load. Noted that there are two operation processes for battery storage, discharge and charge, three sets of decision variables would be assigned for each process.
4.1.1 Continues decision variables
Continues decision variables include PSou
i , QSoui , PDGi;j ,
QDGi;j , PSL;Ai;j , QSL;Ai;j , PRL;Ai;j , QRL;Ai;j , PS;Ci;j , PS;Di;j , QSi;j,Vi,j, θi,j,
where PSoui and QSoui denote the active and reactive
power of source bus at time intervaliandPDGi;j andQDGi;j
are the active and reactive power of distributed gener-ation jat time interval i. Vi,j andθi,j denote the voltage
amplitude and angle of busjat time intervali.
4.1.2“0–1”binary integer decision variables
“0–1” binary integer decision variables include ηSLi;j, ηS;Si;j ,
ηCD i;j ,ηDCi;j .
4.2 Objective function
The object is to minimize the overall operation costs of distribution system over a specific duration of time, in-cluding power generation/operation costs from source bus, distribution generation, and battery storage, load shifting cost of interactive load and investment costs of battery storage if it’s built by DSO. It can be expressed as:
min
XT i¼1
λSou;P
i PSoui þλSou ;Q i QSoui
þXT i¼1
XNG j¼1
λDG;P
j PDGi;j þλDG ;Q j QDGi;j
þXT i¼1
XNS j¼1
λS;P
j PSi;;jCþλSj;QQSi;j
þXNS j¼1
MBSj ;D
þXT i¼1
XNSL j¼1
λshift i;j
PSLi;j;Aþ
XT i¼1
X
NRL
j¼1
Cshifti;j PRL ;A i;j
)
8 > > > > > > > > > > > > > > > > > < > > > > > > > > > > > > > > > > > :ð9Þ
Where λdenotes cost coefficients. The superscripts of the variables and parameters in (10) are used to distin-guish different kinds of DERs (Sou,DGand S,P) and ac-tive and reacac-tive power output (P, Q). NG and NS respectively denote sets of distribution generation and battery storage.
In (9), generation costs of the source bus are related to its active and reactive power. The costs of reactive power might come from contracts or auxiliary markets, these two mechanisms could both be reflected by cost coefficients. The same situation would be implemented to distributed generations.
4.3 Constraints
Constraints mainly consist of two categories, respectively related to system operation and various DERs.
4.3.1 System operation constraints
for power balance, bus voltage and transmission power flow.
Power balance constraint on source bus is expressed as:
PSoui −Ploadi;s ¼F1ðVi;θiÞ
QSoui −Qloadi;s ¼F2ðVi;θiÞ
8 < :
ð10Þ
Power balance constraints on other buses are expressed as:
XNG
m¼1
m∈j
PDG
i;mþ XNS
m¼1
m∈j PSi;;mD−
XNS
m¼1
m∈j PSi;;mCþ
XNSL
m¼1
m∈j
PSLi;m;A−Ploadi;j
¼F1ðVi; ;θiÞ
XNG
m¼1
m∈j
QDGi;mþ XNS
m¼1
m∈j QSi;;mD−
XNS
m¼1
m∈j
QSi;;mCþ XNSL
m¼1
m∈j
QSLi;m;A−Qloadi;j
¼F2ðVi; ;θiÞ 8 > > > > > > > > > > > > > > > > > > > > < > > > > > > > > > > > > > > > > > > > > :
ð11Þ
where Ploadi;j and Qloadi;j respectively denote active and
re-active load of busjat time intervali. Viis vector of bus
voltage magnitude and θi is vector of bus voltage angle at time intervali.F1andF2are active and reactive power
flow functions.
Note that circuit parameters and operation state of distribution system are quite different from those of transmission system, transmission power flow should be calculated based on AC power flow.
Constraints on transmission power flow are expressed as:
Sjline
2
≤ Plinei;j
2
þ Qlinei;j
2
≤ Slinej
2
ð12Þ
WhereSlinej andSjlineare upper and lower capacity
limi-tations of linej. Plinei;j and Qlinei;j are the active and reactive
transmission power flow of linejat time intervali. Constraints on bus voltage are expressed as:
Vb≤Vi;j≤V
b
Vi;j¼Vs;set
θi;j¼0
8 > > < > > :
ð13Þ
where Vi,s and θi,s denote voltage magnitude and
angle of source bus. Vbj and V jb respectively denote
upper and lower limitation of voltage magnitude of bus j.
4.3.2 DER operation constraints
Operation constraint constraints on distributed gener-ation, battery storage and interactive load are established based on their operation characteristics.
The generation range and the relations on active-reactive power output are two important operation characteristics for distributed generation. The output range of wind turbine and photovoltaic is based on their power prediction, while power output of gas turbine should be adjusted within its generation cap-acity limitation. Distributed generation are always connected to distributed system through power elec-tronics equipment. Relations on active –reactive power output are mainly decided by types and control strategies of the equipment. And there are mainly two kinds of control strategies: constant voltage con-trol (CVC) and constant power factor concon-trol (CPFC). These relations could be formulated as:
PGi;j≤PGi;j≤P
G i;j
QGi;j≤QGi;j≤Q
G
i;j
CPFC: PGi;j¼CGj Qi;j G
CVC: VG
i;j¼VGj;set
8 > > > > > > < > > > > > > :
ð14Þ
wherePGi;j and QGi;j respectively denote the active and
re-active power output of distributed generationjat period
iandPGi;j,Pi;jG,Q
G
i;jandQi;jG are their upper and lower
bounds. CGj is the controlled power factor between
ac-tive and reacac-tive power of distributed generationj.VGi;jis
the bus voltage which distributed generation j is connected to and VjG;set indicates the controlled voltage
level.
Formulations on operation of interactive load and bat-tery storage have been discussed in chapter III including formula (2–8).
4.4 Solution method
Obviously the formulated multi-period coordinated scheduling model is essentially a typical nonlinear mixed integer programming problem. GAMS could be used to solve this problem.
5 Case study
5.1 Basic data 5.1.1 System data
The proposed model is implemented on the tested REDS (Repository of Distribution Systems) 135-bus distribu-tion system. The test system has been extended from single-period to multi-period, with 1 day as the sched-uled duration and 1 h as basic time interval.
The profile of system load is shown in Fig. 9. The curves with crosses denote active power load; while the ones with triangles denote reactive power load.
5.2 DER data
Eight DGs are added, including five GTs, two WTs and one PV; one SD and one CL are added as well.
Table 3 gives the characteristics of the distributed generators. The buses which DGs is connected to are listed in the second column. And the first two DGs are used to simulate wind turbine (W), the last one for photovoltaic (P) and the rest for gas turbine. The power factor of the DGs is set to 0.8 if existed
and the voltage is set to 1.05, ramp rate is 100 kW/ 15 min.
Table 4 gives the characteristics of the battery storage. There is one battery storage added to the case which is connected to bus 39. Its initial electricity is 4000kWh and maximum capacity is 8000kWh. Its maximum ex-changing power is 500 kW and power loss rate during charging is 0.05.
We design one removable load and one shapeable load in the case. Removable load is connected to bus 30, and shapeable load to bus 68. Their original load shape are shown in Figs. 10 and 11. We design the same load shift-ing cost curve for them shown in Fig. 12.
6 Results and discussion 6.1 Schedules of the source bus
The curve with crosses in Fig. 13 shows active power schedules of the source bus; while the one with triangles denotes the total load demand. The trends of the two curves are roughly consistent, with deviations reflecting power outputs from various DERs.
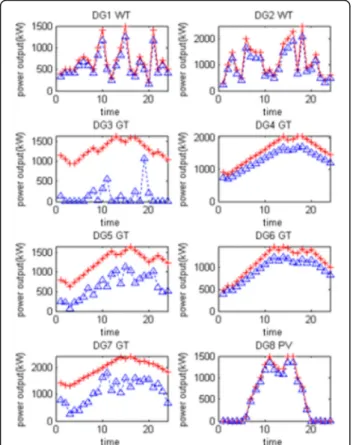
6.2 Schedules of the DGs
Figure 14 shows active and reactive power schedules of the DGs. The curves with crosses denote active power schedules; while the ones with triangles denote reactive power schedules.
Fig. 9The profile of system load
Table 3Characteristics of the distributed generators
Num Bus Type Power Factor Voltage Ramp Rate (kW/15 min)
1 2 W 0.8 -
-2 22 W 0.8 -
-3 37 G - 1.05 100
4 46 G 0.8 - 100
5 62 G - 1.05 100
6 86 G 0.8 - 100
7 101 G - 1.05 100
8 121 P 0.8 -
-Table 4Characteristics of the battery storage Num Bus Initial
electricity/kWh
Maximum capacity/kWh
Maximum exchanging power/kW
Power exchange loss
1 39 4000 8000 500 0.05
No curtailments are observed for WTs and PV, as their capacities are relatively low in this tested system; there-fore, the fluctuations could be easily offset by the source bus and the GTs. Reactive power schedules of DG 3, 5 and 7 are appropriately adjusted to keep the bus voltages at the set range, as they adopt CVC control strategy. Therefore, schedules of reactive power are independent of that of active power. However, For DG 4 and 6, as they adopt CPFC strategy, reactive power schedules are proportional to that of active output.
6.3 Schedules of the storage battery
Figure 15 shows active power schedule of the SD. Posi-tive values indicate charge state while negaPosi-tive indicate discharge. It could be observed that operation state of the SD is well scheduled, which is in charge state during
valley load periods and in discharge state during peak load periods. This schedule could smooth bus load curve and thus might be helpful to reduce overall distribution power losses to some extent.
6.4 Schedules of the interactive load
Figure 16 shows active power schedule of the removable load. The curves with crosses denote Original load curve; while the ones with triangles denote load curve after removing. They have the same shapes.
Figure 17 shows active power schedule of the shapeable load. The curves with crosses denote Original load curve; while the ones with triangles denote load curve after removing. Though their have the different shapes, their load stay the same.
Fig. 11The Profile of original removable load
Fig. 12The profile of load shifting cost
Fig. 13Active power schedules of the source bus
7 Conclusions
Implementation of DGs imposes great challenges on traditional distribution system operation. And interactive load and battery storage would reduce their volatility. So scheduling coordinated DG and them will be an import-ant research topic, which imposes remarkable impacts
on system economics and security. This paper firstly in-vestigates operation characteristics of interactive load and battery storage. Load shifting cost, load shifting positive, load shifting shape and the relation between ac-tive and reacac-tive load of interacac-tive load are respecac-tively discussed and formulated. And to battery storage, constraints for energy storage, power exchange, state transition number and operation cost are also formu-lated in detail. Then, a multi-period coordinated sched-uling model is proposed for integrated operation of ADS, with the object of costs minimizing. A tested case is studied, which is based on a 135-bus distribution system with eight DGs, one SD and one CL connected. Solution of the proposed model includes optimal sched-ules of the DERs, which help to smooth bus load and cut distribution losses in the premise of secure operation constraints.
Authors’contributions
QC: Initiated the research and established models and schedules used for this study, XZ: Cope with establishing the formulation on Operation of Interactive Load and Battery Storage. DG: Manipulated the load data and summarized results in the case study. All authors read and approved the final manuscript.
Competing interests
The authors declare that they have no competing interests.
Received: 18 April 2017 Accepted: 3 July 2017
References
1. Pilo, F., Pisano, G., & Soma, G. G. (2009).“Digital model of a Distribution Management System for the optimal operation of active distribution systems.”SmartGrids for Distribution, 2008. IET-CIRED.CIRED Seminar IEEE Xplore, 1–5.
2. Hidalgo, R., Abbey, C., & Joós, G. (2010). A review of active distribution networks enabling technologies.Power and Energy Society General Meeting IEEE, 1–9.
Fig. 15Active power schedule of the storage battery
Fig. 16Active power schedule of the Removable Load
3. Il-Keun, S., Won-Wook, J., Ju-Yong, K., et al. (2013). Operation schemes of smart distribution networks with distributed energy resources for loss reduction and service restoration.IEEE Transactions on Smart Grid, 4(1), 367–374.
4. Soares, J., et al. (2011). An optimal scheduling problem in distribution networks considering V2G.IEEE, 1–8.
5. Atwa, Y. M., El-Saadany, E. F., Salama, M. M. A., et al. (2010). Optimal renewable resources mix for distribution system energy loss minimization.
IEEE Transactions on Power Systems, 25(1), 360–370.
6. Pedrasa, M. A. A., Spooner, T. D., & Macgill, I. F. (2010). Coordinated scheduling of residential distributed energy resources to optimize smart home energy services.IEEE Transactions on Smart Grid, 1(2), 134–143. 7. Keane, A., & O’Malley, M. (2007). Optimal utilization of distribution networks
for energy harvesting.IEEE Transactions on Power Systems, 22(1), 467–475. 8. Tsikalakis, A. G., & Hatziargyriou, N. D. (2008). Centralized control for
optimizing microgrids operation.IEEE Transactions on Energy Conversion, 23(1), 241–248.
9. Wang, Q., & Choi, S. S. (2008). The Design of Battery Energy Storage System in a unified power-flow control scheme.IEEE Transactions on Power Delivery, 23(2), 1015–1024.
10. Borghetti, A., Bosetti, M., Grillo, S., et al. (2010). Short-term scheduling and control of active distribution systems with high penetration of renewable resources.IEEE Systems Journal, 4(3), 313–322.
11. Gabash, A., & Pu, L. (2012). Active-reactive optimal power flow in distribution networks with embedded generation and battery storage.IEEE Transactions on Power Systems, 27(4), 2026–2035.
12. Gabash A, Pu L. Active-reactive optimal power flow for low-voltage networks with photovoltaic distributed generation, 2012.
13. Gabash, A., & Li, P. (2012). Flexible optimal operation of battery storage Systems for Energy Supply Networks.IEEE Transactions on Power Systems, 99, 1–10. 14. Anderson, M. D., & Carr, D. S. (1993). Battery energy storage technologies.
Proceedings of the IEEE, 81(3), 475–479.
15. Cecati, C., Citro, C., & Siano, P. (2011). Combined operations of renewable energy systems and responsive demand in a smart grid.IEEE Transactions on Sustainable Energy, 2(4), 468–476.
16. Palensky, P., & Dietrich, D. (2011). Demand side management: Demand response, intelligent energy systems, and smart loads.IEEE Transactions on Industrial Informatics, 7(3), 381–388.
17. Rahimi, F., & Ipakchi, A. (2010). Demand response as a market resource under the smart grid paradigm.IEEE Transactions on Smart Grid, 1(1), 82–88. 18. Ruiz, N., Cobelo, I., & Oyarzabal, J. (2009). A direct load control model for