Economic Insights – Trends and Challenges No. 4/2012 121 - 128
The Annual Inflation Rate Analysis Using
Data Mining Techniques
M
ă
d
ă
lina C
ă
rbureanu
Petroleum-Gas University of Ploiesti, Bd. Bucuresti 39, Ploiesti, Romania e-mail: [email protected]
Abstract
Inflation, indicator of the unbalance that affects the national economies, proved to be through the years a permanent presence in economy. The inflation consequences that the population faces, such as the decrease in the buying capacity and not only, make necessary the annual inflation rate IPC analysis through the usage of various statistical techniques and methods, such as data mining techniques. In the present paper, for annual inflation rate IPC analysis and prediction it is used a set of data mining techniques, respectively the principal components analysis, decision trees and linear regression. The data mining techniques, respectively the statistical techniques are useful tools for economists, statisticians, financial analysts etc., in the analysis and prediction of various economic indicators.
Key words:inflation annual rate, principal components, regression, decision trees
JEL Classification: C38, C81
Introduction
The political, economic and social events from a certain period of time have a positive and negative effect on the annual inflation rate IPC evolution, with direct consequences on the population standard of living. Moreover, there is a set of factors that directly influences the annual inflation rate IPC evolution, such as: administrated prices, the fuels prices, the volatile prices of food stuffs (LFO), the adjusted CORE2 indicator (measure of the main inflation) and tobacco and alcohol beverages prices1.
The mentioned factors will be used in developing the annual inflation rate IPC analysis and prediction using a set of data mining techniques, such as: principal components analysis (PCA), decision trees and linear regression.
The paper is structured as follows:
o The data mining techniques as research instruments for analysis and prediction, in which
case the main applications and advantages of using such techniques in the economic field are presented;
1 Romanian National Bank, Report on inflation – may 2012, at http: // www .bnro .ro / Publication
o The IPC annual inflation rate analysis and prediction through the application of some data
mining techniques (principal components analysis, decision trees and linear regression);
o Concluding thoughts regarding the applicability and utility of some data mining techniques
such as PCA, decision tress and linear regression in the analysis and prediction of different economic indicators.
Data Mining Tehniques as Instruments for Analysis and Prediction
The various government institutions, especially the banks, for instance Romanian National Bank (BNR), are working with large data bases. If they do not employ adequate instruments the useful information extraction and analysis from the enormous data bases cannot be achieved. The data mining techniques represent a useful tool in solving the various problems from the economic domain, through correlation identification, rules, patterns etc., that can be traced throughout the analyzed data, thus helping the analyst to take the best decisions, and also to analyse and predict various economic indicators.
In the economic domain, the usage of some data mining techniques, as classification, regression, clustering etc., brings a set of advantages, such as the optimization of the institutional activity through the best decisions taking2. Moreover, in the literature it is presented a set of data mining
applications employed in the analysis, prediction and modeling of inflation behaviour3, in
inflation analysis measured through consuming prices4 etc.
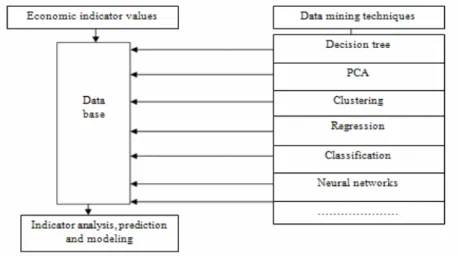
Among the data mining techniques, those that are most used in the economic domain, in order to predict the various indicators, are the ones presented in Figure 1.
Fig. 1. Data mining techniques
The ability to predict the evolution of an economic indicator with accuracy, as in the case of the annual rate inflation IPC, is essential for taking the most adequate decisions, measures to counter-attack the negative effects generated by a negative evolution of the analised economic
2 A n d r o n i e , M . , C r işa n , D . , Commercially Available Data Mining Tools used in the
Economic Environment, Database System Journal, Vol. I, No. 2/2010, pp. 45-54.
3 E r i c s s o n , N . , Constructive data mining:modeling australian inflation, at http: // www .
economics.smu.edu.sg/events/Paper/NeilEricssonAustralian.pdf
4 C a o , L . , e t a l , New Frontiers in applind data mining, Springer-Verlag, Berlin Heidelberg, 2012,
indicator. To that aim, the data mining tehniques can be a useful tool in taking the best decisions.
The Data Mining Techniques Application
Data mining techniques have wide applicability in many fields ranging from finances, economy, and marketing to medicine, astronomy, and meteorology4. From the multitude of the data
mining techniques, there have been chosen the principal components analysis (PCA), linear regression and decision trees, to be applied in IPC annual inflation rate analysis and prediction.
Principal Components Analysis
The economic-social reality is influenced by a large number of variables (indicators). The principal components analysis (PCA) aims at the reduction of the number of used variables, for obtaining a number of representative variables, named factors5.
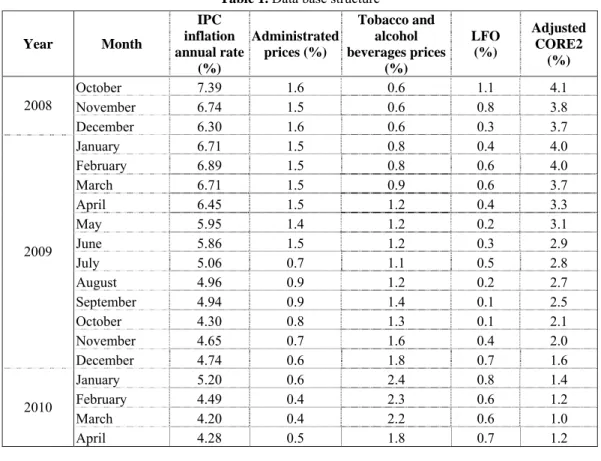
Table 1 presents the data base developed using the data supplied by Romanian National Bank (BNR) for the analyzed variables: IPC annual inflation rate, administrated prices, fuels prices, the volatile prices of food products (LFO), the adjusted CORE2 indicator (measure unit for base inflation) and tobacco and alcohol beverages prices6.
Table 1. Data base structure Year Month
IPC inflation annual rate
(%)
Administrated prices (%)
Tobacco and alcohol beverages prices
(%)
LFO (%)
Adjusted CORE2
(%)
October 7.39 1.6 0.6 1.1 4.1
November 6.74 1.5 0.6 0.8 3.8
2008
December 6.30 1.6 0.6 0.3 3.7
January 6.71 1.5 0.8 0.4 4.0
February 6.89 1.5 0.8 0.6 4.0
March 6.71 1.5 0.9 0.6 3.7
April 6.45 1.5 1.2 0.4 3.3
May 5.95 1.4 1.2 0.2 3.1
June 5.86 1.5 1.2 0.3 2.9
July 5.06 0.7 1.1 0.5 2.8
August 4.96 0.9 1.2 0.2 2.7
September 4.94 0.9 1.4 0.1 2.5
October 4.30 0.8 1.3 0.1 2.1
November 4.65 0.7 1.6 0.4 2.0
2009
December 4.74 0.6 1.8 0.7 1.6
January 5.20 0.6 2.4 0.8 1.4
February 4.49 0.4 2.3 0.6 1.2
March 4.20 0.4 2.2 0.6 1.0
2010
April 4.28 0.5 1.8 0.7 1.2
5 G o r u n e s c u , F . , Data mining. Concepte, modele şi tehnici, Editura Albastră, Cluj-Napoca, 2006,
pp. 23-24.
6 Romanian National Bank, Monthly bulletins, 2010-2012, at
Table 1 (cont.)
May 4.42 0.6 1.8 0.7 1.3
June 4.38 0.6 1.8 0.6 1.4
July 7.14 1.3 1.9 1.1 2.8
August 7.58 1.3 1.9 1.4 2.9
September 7.77 1.3 1.6 1.8 3.0
October 7.88 1.4 1.8 1.9 2.9
November 7.73 1.4 1.5 1.9 2.9
2010
December 7.96 1.4 1.4 2.2 3.0
January 6.99 1.2 0.9 2.3 2.6
February 7.60 1.2 0.9 2.7 2.8
March 8.01 1.2 0.9 3.0 2.9
April 8.34 1.3 1.0 3.1 2.9
May 8.41 1.3 1.1 3.1 2.9
June 7.93 1.3 1.1 2.6 2.9
July 4.85 0.8 0.6 1.6 1.9
August 4.25 0.9 0.5 1.0 1.9
September 3.45 0.9 0.5 0.3 1.8
October 3.55 1.0 0.5 0.4 1.7
November 3.44 1.0 0.5 0.3 1.6
2011
December 3.14 1.1 0.5 0.0 1.5
January 2.72 1.08 0.42 -0.34 1.56
February 2.59 1.06 0.42 -0.27 1.38
2012
March 2.40 1.03 0.43 -0.41 1.35
For the PCA analysis, the procedure Statistics-Data reduction-Factor from SPSS environment was applied. The statistical results are presented in Tables 2, 3 and 4.
Table 2. Correlation matrix
IPC PRICES TABACCO_ALCOHOL LFO CORE2
IPC 1.000 .680 .079 .768 .745
PRICES .680 1.000 -.464 .273 .880
TABACCO_ALCOHOL .079 -.464 1.000 .043 -.345
LFO .768 .273 .043 1.000 .253
Corre-lation
CORE2 .745 .880 -.345 .253 1.000
The correlation matrix indicates the correlations between the analyzed variables. As it can be observed, we have positive and also negative correlations between the analyzed variables. Meaningful positive correlations are between IPC and LFO (0.76), between PRICES and CORE2 (0.88) and between CORE 2 and IPC (0.74).
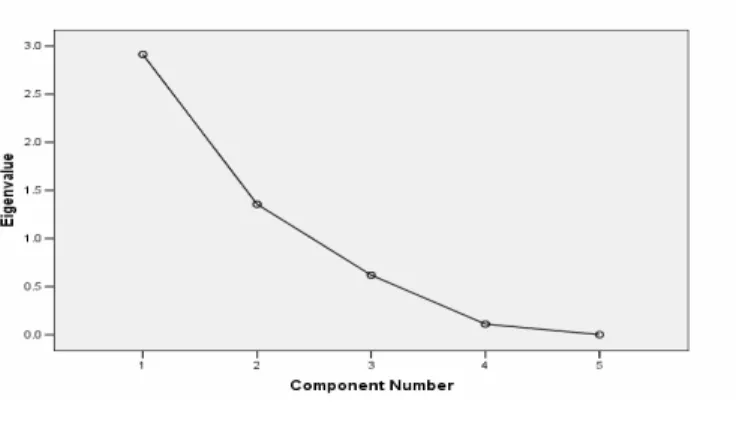
Table 3. Total variance explained Initial
Eigenvalues
Extraction Sums of Squared Loadings
Rotation Sums of Squared Loadings
Compo-nent Total % of
Variance
Cumulative
% Total
% of Variance
Cumulative
% Total
% of Variance
Cumulative %
1 2.914 58.284 58.284 2.914 58.284 58.284 2.196 43.920 43.920
2 1.357 27.133 85.416 1.357 27.133 85.416 2.075 41.496 85.416
3 .619 12.378 97.794
4 .110 2.198 99.992
The table Total Variance Explained brings the first specific information of factorial analysis. Five principal components (factors) were generated, but only two of them reached the selection criterion (Eigenvalue>=1). On the Extraction Sums of Squared Loadings columns, we have the Eigenvalues, the explained variance and cumulative variance for these two factors, in the context of initial solution (without rotation)7. The variance explained by each factor was
distributed as follows: factor I-58.284%, and factor II-27.133%. Together those two factors explain 85.416% from the analyzed values variation. On the Rotation Sums of Squared Loadings columns, we have the same values for these two factors, but after the application of rotation procedure. It can be noticed a redistribution of the variance explained by each factor (factor I-43.920%; factor II-41.496%) in the context of the same total variation (85.416%). As it can be observed, through the rotation method the first factor lowers its saturation degree, in favor of the second factor.
The Scree Plot (Figure 2) presents the Eigenvalues for all the principal components obtained through analysis, which are numerically represented in Table 3.
Fig. 2. Scree Plot
The factorial solution (after rotation) is presented in Table 4.
Table 4. Rotated Component Matrix(a)
Component 1 2
IPC .951 .297
LFO .860
PRICES .447 .845 TABACCO_ALCOHOL .301 -.813 CORE2 .510 .781
The data from Table 4 allows final conclusions regarding the analyzed variables factorial structure, as follows:
o Factor I is composed by IPC (0.95) and LFO (0.86) variables; o Factor II is composed by PRICES (0.84) and CORE2(0.78) variables.
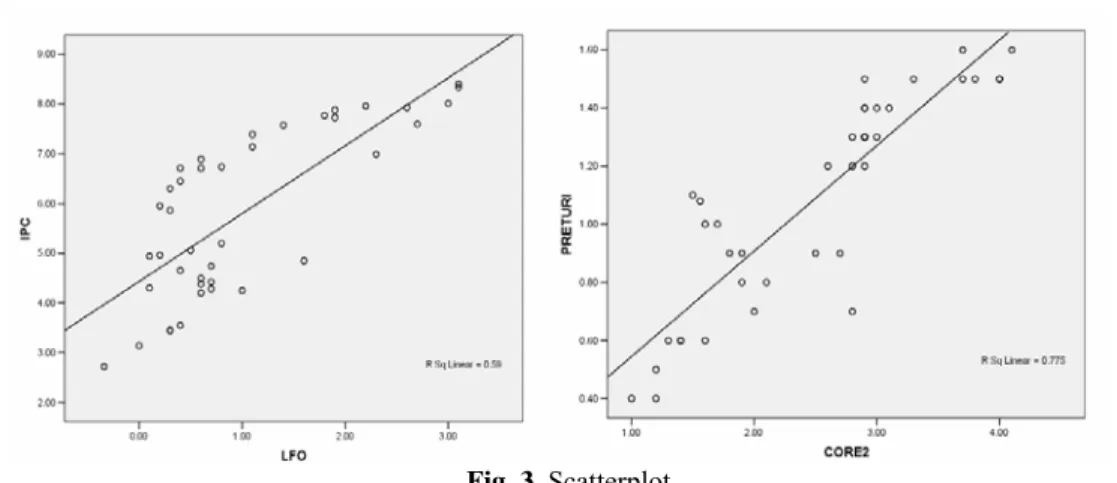
The character and intensity of the correlation between IPC and LFO and between PRICES and CORE2 is highlighted with the help of a graphical procedure, named scatterplot, as it can be observed in Figure 3.
7 P o p a . , M . , Analiza factorială exploratorie, at http://www mpopa .ro/statistica_master/14_
Fig. 3. Scatterplot
Using PCA, we have determined those factors that influence the IPC annual rate of inflation, factors between which there is a strong linear relation, as it can be observed in Figure 3.
The Simple Linear Regression
The simple linear regression is a SPSS procedure used to determine the model that establishes (through a regression equation) the association between a dependent variable (for instance IPC) and an independent one (for instance CORE2)8. The model obtained can be used to predict the
IPC annual rate of inflation (IPC). The simple linear regression model form is9:
(1)
where: β0 is the origin ordinate (shows the variable medium value), β1 is the line gradient, and ε
is a random variable that shows the deviation between the observed values and the model estimated values9.
The correlation (association) between IPC and CORE2 is presented in Figure 4.
Fig. 4. The correlation betweenIPC and CORE2
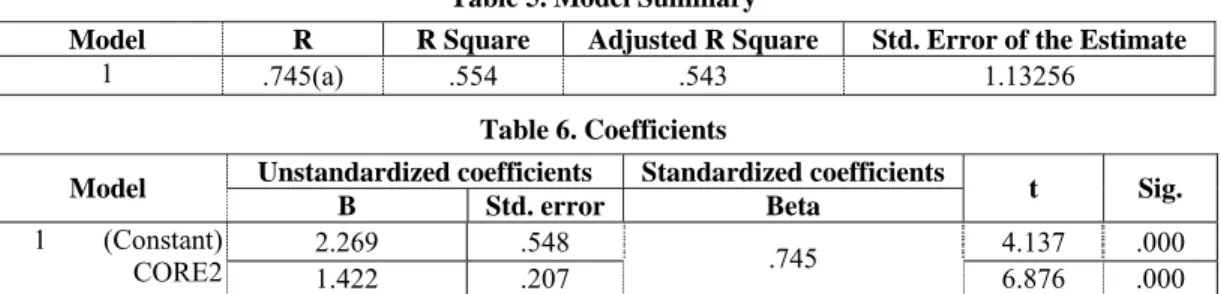
The most important results obtained through the application of SPSS regression procedure are presented in Table 5 and Table 6.
8 G o r u n e s c u , F . , Data mining. Concepte, modele şi tehnici, Editura Albastră, Cluj-Napoca, 2006,
pp. 23-24.
Table 5.Model Summary
Model R R Square Adjusted R Square Std. Error of the Estimate
1 .745(a) .554 .543 1.13256
Table 6.Coefficients
Unstandardized coefficients Standardized coefficients Model
B Std. error Beta t Sig.
2.269 .548 4.137 .000
1 (Constant)
CORE2 1.422 .207 .745 6.876 .000
The R Square values indicate that 55% from IPC variation is explained by the variation of CORE2. The Coefficients table contains the B coefficient (nonstandardized) and Beta coefficient (standardized), which can be used in the prediction equation. So the linear regression equation is:
(2) Using equation (2) and knowing the CORE2 value for a certain month, it can be predicted the IPC annual inflation rate (IPC). According BNR, the CORE2 value for April is 1.8%, so the IPC estimated value for the same month using equation (2) is 4.8286 %, value that corresponds to the National Institute of Statistics (INSSE) predictions10.
Decision Trees
One of the main data mining techniques is represented by the decision trees, used in the affiliation prediction of some instances to various categories11. For obtaining the decision tree
(decision rules), it was used the C5.0 algorithm implemented in See5 environment12. Applying
the C5.0 algorithm on the data from Table 1, there were obtained the following rules that compose the searched decision tree:
o if CORE2>2.1 then IPC=big;
o if CORE2<=2.1 AND PRICES>0.8 then IPC=medium;
o if CORE2<=2.1 AND PRICES<=0.8 AND LFO<=0.7 then IPC=medium; o if CORE2<=2.1 AND PRICES<=0.8 AND LFO>0.7 then IPC=big.
Using these decision rules, with the help of See5 we can make predictions of the IPC annual inflation rate, as it can be observed in Figure 5.
Fig. 5. Prediction of IPC using See5
In Figure 5 it can be observed that the predicted value for IPC annual rate of inflation for April 2012 is a medium one, namely it belongs to (2.5 4.5) interval, with a 88% probability.
10 INSSE, at http://www.insse.ro/cms/files/statistici/comunicate/ipc/a12/ipc04r12.pdf
11 G o r u n e s c u , F . , Data mining. Concepte, modele şi tehnici, Editura Albastră, Cluj-Napoca, 2006,
pp. 23-24.
12 K h o s r o w - P o u r , M . , Emerging Trends and Challenges in Information Technology Management,
Conclusions
This paper has highlighted the use of some statistical data mining techniques, as principal components analysis (PCA), simple linear regression and decision trees, in the evolution analysis and prediction of some economic indicators, such as IPC annual rate of inflation. So, using PCA we have been able to establish those factors that consistently influence the IPC annual inflation rate evolution, while through the usage of linear simple regression we have achieved the IPC annual inflation rate prediction for April 2012. Those are only a few of the advantages of employing statistical data mining techniques in the analysis of various economic indicators, being useful instruments for statisticians, economists etc.
References
1. A n d r o n i e , M . , C r işa n , D . , Commercially Available Data Mining Tools used in the Economic Environment, Database System Journal, Vol. I, No. 2/2010, pp. 45-54.
2. C a o , L . e t a l , New Frontiers in applind data mining, Springer-Verlag, Berlin Heidelberg, 2012, pp.179-181.
3 . E r i c s s o n , N . , Constructive data mining: modeling australian inflation, at http: // www . economics.smu.edu.sg/events/Paper/NeilEricssonAustralian.pdf
4. G o r u n e s c u , F . , D a t a m i n i n g . C o n c e p t e , m o d e l e şi t e h n i c i , Editura Albastră, Cluj-Napoca, 2006, pp. 23-24.
5. INSSE, at http://www.insse.ro/cms/files/statistici/comunicate/ipc/a12/ipc04r12.pdf.
6. J a b a , E . , Econometrie aplicată, Editura Universităţii Alexandru Ioan Cuza, Iaşi, 2008, pp. 6-15. 7. K h o s r o w - P o u r , M . , Emerging Trends and Challenges in Information Technology
Management, Editura Idea Group, 2006, pp. 282-283.
8. P o p a , M . , Analiza factorială exploratorie, at http://www mpopa .ro/statistica_master/14_ analiza_fact.pdf.
9. Romanian National Bank, Report on inflation – May 2012, at http: // www .bnro.ro /Publication Documents.aspx ? icid = 3922.
10. Romanian National Bank, Monthly bulletins, 2010-2012, at http://www.bnro.ro/Raportul-asupra-inflatiei-3342.aspx.
Analiza ratei anuale a infla
ţ
iei folosind tehnici de data mining
Rezumat
Inflaţia, indicator al dezechilibrului ce afectează economiile naţionale, s-a dovedit de-a lungul anilor a fi o prezenţă permanentă în cadrul economiei. Consecinţele inflaţiei pe care le suportă populaţia, precum scăderea puterii de cumpărare şi nu numai, fac necesară analiza permanentă a ratei anuale a inflaţiei IPC prin utilizarea unor variate metode şi tehnici statistice, ca de exemplu tehnicile de data mining. În prezenta lucrare, pentru analiza şi predicţia evoluţiei ratei anuale a inflaţiei IPC este utilizat un set de tehnici de data mining, respectiv analiza componentelor principale, arbori de decizie şi regresia liniară. Tehnicile de data mining, respectiv tehnicile statistice sunt instrumente utile economiştilor, statisticienilor, analiştilor financiari etc., în analiza şi predicţia diferiţilor indicatori economici.