E5071C ENA Network Analyzer
• 9 kHz to 4.5/6.5/8.5 GHz
• 100 kHz to 4.5/6.5/8.5 GHz (with bias tees)
• 300 kHz to 14/20 GHz (with bias tees)
E5092A Configurable Multiport Test Set
Agilent
Table of Contents
Options
...3
Definitions
...4
Boundary Conditions
...4
Corrected System Performance
...5
System dynamic range
...5
Corrected system performance with calibration kit
...
7
Uncorrected System Performance
...13
Test Port Output (Source)
...14
Test port output frequency
...14
Test port output power
...15
Test port output signal purity
...17
Test Port Input
...18
Test port input levels
...18
Test port input (compression)
...20
Test port input (trace noise)
...21
Test port input (stability)
...23
Test port input (dynamic accuracy)
...24
Test port input (group delay)
...26
General Information
...28
System bandwidths
...28
Front panel information
...28
Rear panel information
...29
LXI compliance
...31
EMC, safety and environment
...32
Analyzer environmental specifications and dimensions
...33
Measurement Throughput Summary
...37
Cycle time for measurement completion (ms)
...37
Cycle time (ms) vs. number of points
...42
Cycle time (ms) vs. IF bandwidth
...43
Cycle Time (ms) vs RF Range Fixed Mode
...44
Data transfer time (ms)
...45
E5092A Configurable Multiport Test Set
...46
Test set input/output performance
...46
Option E5092A-020 port performance
...46
Control line
...48
DC source
...48
Operating storage environment
...48
Non-operating storage environment
...48
Front panel information
...49
Rear panel information
...49
Test set dimensions and block diagram
...49
Corrected System Performance for 75 Ω Measurements with
11852B 50 to 75 Ω Minimum-Loss Pads
...53
Options
This document provides technical specifications for the E5071C ENA network
analyzer and the E5092A multiport test set.
E5071C-230 2-port test set, 9 kHz to 3 GHz without bias tees (Discontinued)
E5071C-235 2-port test set, 100 kHz to 3 GHz with bias tees (Discontinued)
E5071C-240 2-port test set, 9 kHz to 4.5 GHz without bias tees
E5071C-245 2-port test set, 100 kHz to 4.5 GHz with bias tees
E5071C-260 2-port test set, 9 kHz to 6.5 GHz without bias tees
E5071C-265 2-port test set, 100 kHz to 6.5 GHz with bias tees
E5071C-280 2-port test set, 9 kHz to 8.5 GHz without bias tees
E5071C-285 2-port test set, 100 kHz to 8.5 GHz with bias tees
E5071C-430 4-port test set, 9 kHz to 3 GHz without bias tees (Discontinued)
E5071C-435 4-port test set, 100 kHz to 3 GHz with bias tees (Discontinued)
E5071C-440 4-port test set, 9 kHz to 4.5 GHz without bias tees
E5071C-445 4-port test set, 100 kHz to 4.5 GHz with bias tees
E5071C-460 4-port test set, 9 kHz to 6.5 GHz without bias tees
E5071C-465 4-port test set, 100 kHz to 6.5 GHz with bias tees
E5071C-480 4-port test set, 9 kHz to 8.5 GHz without bias tees
E5071C-485 4-port test set, 100 kHz to 8.5 GHz with bias tees
E5071C-2D5 2-port test set, 300 kHz to 14 GHz with bias tees
E5071C-4D5 4-port test set, 300 kHz to 14 GHz with bias tees
E5071C-2K5 2-port test set, 300 kHz to 20 GHz with bias tees
E5071C-4K5 4-port test set, 300 kHz to 20 GHz with bias tees
E5092A Configurable multiport test set
Calibration kits and ECal modules
This E5071C data sheet also provides technical specifications for the
following calibration kits and ECal modules. For models not listed in
this data sheet, please download the free Uncertainty Calculator from
www.agilent.com/find/na_calculator
to generate the curves for your
calibration kit.
85032F
Calibration kit
85033E
Calibration kit
85052D
Calibration kit
85092C
Electronic calibration (ECal) module
85093C
Electronic calibration (ECal) module
Definitions
Specification (spec.):
Warranted performance. All specifications apply at 23 ºC (±5 ºC), unless
otherwise stated, and 90 minutes after the instrument has been turned on.
Specifications include guard bands to account for the expected statistical
performance distribution, measurement uncertainties, and changes in
performance due to environmental conditions.
Supplemental information is intended to provide information that is helpful for
using the instrument but that is not guaranteed by the product warranty.
Typical (typ.):
Describes performance that will be met by a minimum of 80% of all products.
It is not guaranteed by the product warranty.
Supplemental performance data (SPD):
Supplemental performance data represents the value of a parameter that is
most likely to occur; the expected mean or average. It is not guaranteed by the
product warranty.
General characteristics:
A general, descriptive term that does not imply a level of performance.
Note: The specifications in this data sheet also apply to the E5071CEP ENA
network analyzer express configuration. For more information about the Express
ENA, visit
www.agilent.com/find/express-e5071c
Boundary Conditions
In this data sheet, boundary conditions are given for the specifications. For
example, system dynamic range is 98 dB with the following boundary conditions.
Option:
485
Frequency:
10 MHz
IF bandwidth:
3 kHz
If the same boundary conditions fall under more than one category in a table,
apply the best value.
Corrected System Performance
The specifications in this section apply to measurements made with the
Agilent E5071C network analyzer under the following conditions:
• No averaging applied to data
• Environmental temperature of 23 °C (±5 °C) with less than 1 °C deviation
from the calibration temperature
• Response and isolation calibration performed
• RF Range Fixed Mode: OFF
System dynamic range
Table 1.
Option 230/235/240/245/260/265/280/285/430/435/440/445/
460/465/480/485
Description
Specification
SPD
System dynamic range1, 2, 3
9 kHz to 300 kHz 72 dB
300 kHz to 10 MHz IF bandwidth = 3 kHz 82 dB
10 MHz to 6 GHz 98 dB
6 GHz to 8.5 GHz 92 dB
9 kHz to 300 kHz 97 dB 115 dB
300 kHz to 10 MHz 107 dB 115 dB
10 MHz to 6 GHz IF bandwidth = 10 Hz 123 dB 130 dB
6 GHz to 7 GHz 117 dB 128 dB
7 GHz to 8 GHz 117 dB 126 dB
8 GHz to 8.5 GHz 117 dB 124 dB
Figure 1. System dynamic range (specification and actual measurement data example, IF bandwidth 10 Hz)
80 90 100 110 120 130 140 150 160
1.E+05 1.E+09 2.E+09 3.E+09 4.E+09 5.E+09 6.E+09 7.E+09 8.E+09
Test frequency [Hz]
System dynamic range [dB]
E5071C specification
1. The test port dynamic range is calculated as the difference between the test port rms noise loor and the source maximum output power. The effective dynamic range must take measurement uncertainty and interfering signals into account.
2. The speciication might not be met at 5 MHz or 50 MHz.
System dynamic range
(continued)
Table 2.
Option 2D5/2K5/4D5/4K5
Description
Speciication
SPD
System dynamic range1, 2
300 kHz to 1 MHz
IF bandwidth = 3 kHz
70 dB
1 MHz to 10 MHz 82 dB
10 MHz to 100 MHz 95 dB
100 MHz to 6 GHz 98 dB
6 GHz to 8.5 GHz 92 dB
8.5 GHz to 10.5 GHz 80 dB
10.5 GHz to 15 GHz 75 dB
15 GHz to 20 GHz 71 dB
300 kHz to 1 MHz
IF bandwidth = 10 Hz
95 dB 105 dB
1 MHz to 10 MHz 107 dB 115 dB
10 MHz to 100 MHz 120 dB 129 dB
100 MHz to 6 GHz 123 dB 130 dB
6 GHz to 8 GHz 117 dB 129 dB
8 GHz to 8.5 GHz 117 dB 127 dB
8.5 GHz to 10.5 GHz 105 dB 115 dB
10.5 GHz to 15 GHz 100 dB 111 dB
15 GHz to 20 GHz 96 dB 105 dB
Figure 2. System dynamic range (specification and actual measurement data example, IF bandwidth 10 Hz)
1. The test port dynamic range is calculated as the difference between the test port’s rms noise loor and the source’s maximum output power. Effective dynamic range must take measurement uncertainty and interfering signals into account.
2. The speciication might not be met at 5 MHz or 50 MHz.
Frequency [Hz]
Sy
st
em
dy
na
mi
c
ra
ng
e[
dB
]
E5071C-2D5/2K5/4D5/4K5 specification
0.0E+00 5.0E+09 1.0E+10 1.5E+10 2.0E+10 80
90 100 110 120 130 140 150 160
Corrected system performance with calibration kit
Option 230/235/240/245/260/265/280/285/430/435/440/445/460/465/480/485
Table 3.
Corrected system performance with type-N device connectors,
85032F calibration kit
Network analyzer: E5071C
Calibration kit: 85032F (Type-N, 50 Ω)
Calibration: full 2-port
IF bandwidth = 10 Hz, no averaging applied to data, environmental temperature = 23 °C (±5 °C ) with < 1 °C deviation from calibration temperature, isolation calibration performed
Description
Speciication (dB)
9 kHz to 300 kHz
300 kHz to 10 MHz
10 MHz to 3 GHz
3 GHz to 6 GHz
6 GHz to 8.5 GHz
Directivity 49 49 46 40 38
Source match 41 41 40 36 35
Load match 49 49 46 40 37
Relection tracking ±0.011 ±0.011 ±0.021 ±0.032 ±0.054
Transmission tracking ±0.027 ±0.015 ±0.018 ±0.056 ±0.088
Transmission uncertainty (specification)
Table 4.
Corrected system performance with type-N device connectors,
85092C electronic calibration (ECal) module
Network analyzer: E5071C
Calibration module: 85092C (Type-N, 50 Ω) Electronic calibration (ECal) module
Calibration: full 2-port
IF bandwidth = 10 Hz, no averaging applied to data, environmental temperature = 23 °C (±5 °C ) with < 1 °C deviation from calibration temperature , isolation calibration is not performed
Description
Speciication (dB)
300 kHz to 10 MHz
10 MHz to 3 GHz
3 GHz to 6 GHz
6 GHz to 8.5 GHz
Directivity 45 54 52 47
Source match 36 44 41 36
Load match 41 47 44 39
Relection tracking ±0.100 ±0.040 ±0.060 ±0.070
Transmission tracking ±0.055 ±0.039 ±0.068 ±0.136
Transmission uncertainty (specification)
Table 5.
Corrected system performance with 3.5 mm device connector type,
85033E calibration kit
Network analyzer: E5071C
Calibration kit: 85033E (3.5 mm, 50 Ω) Calibration: full 2-port
IF bandwidth = 10 Hz, no averaging applied to data, environmental temperature = 23 °C (±5 °C ) with < 1 °C deviation from calibration temperature, isolation calibration performed
Description
Speciication (dB)
9 kHz to 300 kHz
300 kHz to 10 MHz
10 MHz to 3 GHz
3 GHz to 6 GHz
6 GHz to 8.5 GHz
Directivity 46 46 44 38 38
Source match 43 43 40 37 36
Load match 46 46 44 38 38
Relection tracking ±0.006 ±0.006 ±0.007 ±0.009 ±0.010
Transmission tracking ±0.026 ±0.015 ±0.020 ±0.058 ±0.079
Transmission uncertainty (specification)
Table 6.
Corrected system performance with 3.5 mm device connector type,
85093C electronic calibration (ECal) module
Network analyzer: E5071C
Calibration module: 85093C (3.5 mm, 50 Ω) electronic calibration (ECal) module
Calibration: full 2-port
IF bandwidth = 10 Hz, no averaging applied to data, environmental temperature = 23 °C (±5 °C ) with < 1 °C deviation from calibration temperature, isolation calibration is not performed
Description
Speciication (dB)
300 kHz to 10 MHz
10 MHz to 3 GHz
3 GHz to 6 GHz
6 GHz to 8.5 GHz
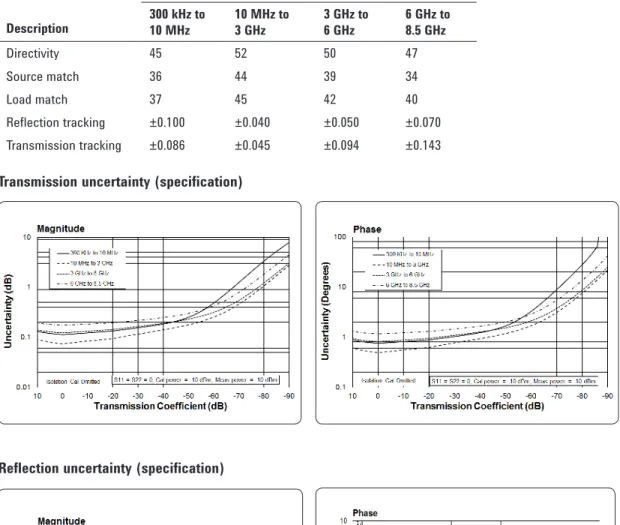
Directivity 45 52 50 47
Source match 36 44 39 34
Load match 37 45 42 40
Relection tracking ±0.100 ±0.040 ±0.050 ±0.070
Transmission tracking ±0.086 ±0.045 ±0.094 ±0.143
Transmission uncertainty (specification)
Option 2D5/2K5/4D5/4K5
Table 7.
Corrected system performance with 3.5 mm device connectors,
85052D calibration kit
Network analyzer: E5071C
Calibration kit: 85052D (3.5 mm, 50 Ω) Calibration: full 2-port
IF bandwidth = 10 Hz, no averaging applied to data, environmental temperature = 23 °C (±5 °C ) with < 1 °C deviation from calibration temperature, isolation calibration performed
Description
Speciication (dB)
300 kHz to 500 MHz
500 MHz to 2 GHz
2 GHz to 6 GHz
6 GHz to 20 GHz
Directivity 42 42 38 36
Source match 37 37 31 28
Load match 42 42 38 36
Relection tracking ±0.003 ±0.003 ±0.004 ±0.008
Transmission tracking ±0.068 ±0.034 ±0.100 ±0.208
Transmission uncertainty (specification)
Reflection uncertainty (specification)
0 .0 10 .1 1 1 0
-9 0
-8 0
-7 0
-6 0
-5 0
-4 0
-3 0
-2 0
-1 0 0 1 0
3 0 0 K H z to 5 0 0 M H z 5 0 0 M H z to 2 G H z 2 G H z to 6 G H z 6 G H z to 2 0 G H z
S11 = S22 = 0; Cal power = -10 dBm; Meas power = -10 dBm
U n c e rt a in ty ( d B )
Transmission Coefficient (dB) Magnitude
0 .1 1 1 0 1 0 0
-9 0 -8 0 -7 0 -6 0 -5 0 -4 0 -3 0 -2 0 -1 0 0 1 0
3 0 0 K H z to 5 0 0 M H z 5 0 0 M H z to 2 G H z 2 G H z to 6 G H z 6 G H z to 2 0 G H z
S11 = S22 = 0; Cal power = -10 dBm; Meas power = -10 dBm
Phase U n c e rt a in ty (D e g re e s )
T rans mis s ion C oeffic ient (dB )
0 0 .0 1 0 .0 2 0 .0 3 0 .0 4 0 .0 5
0 0 .2 0 .4 0 .6 0 .8 1
U n c e rt a in ty (li n e a r)
Reflection coefficient (linear) Magnitude
3 0 0 K H z to 5 0 0 M H z, 5 0 0 M H z to 2 G H z
2 G H z to 6 G H z
6 G H z to 2 0 G H z
S 2 1 = S 1 2 = 0 ; Cal power = -10 dBm; Meas power = -10 dBm
0 2 4 6 8 1 0
0 0 .2 0 .4 0 .6 0 .8 1
U n c e rt a in ty (de g re e s)
Reflection coefficient (linear) Phase
3 0 0 K H z to 5 0 0 M H z, 5 0 0 M H z to 2 G H z
2 G H z to 6 G H z
6 G H z to 2 0 G H z
Table 8.
Corrected system performance with 3.5 mm device connectors,
N4691B electronic calibration (ECal) module
Network analyzer: E5071C
Calibration module: N4691B (3.5 mm, 50 Ω) electronic calibration (ECal) module
Calibration: full 2-port
IF bandwidth = 10 Hz, no averaging applied to data, environmental temperature = 23 °C (±5 °C ) with < 1 °C deviation from calibration temperature, isolation calibration is not performed
Description
Speciication (dB)
300 kHz to 500 MHz
500 MHz to 2 GHz
2 GHz to 6 GHz
6 GHz to 20 GHz
Directivity 31 52 48 46
Source match 29 47 45 42
Load match 27 47 43 39
Relection tracking ±0.110 ±0.020 ±0.030 ±0.040
Transmission tracking ±0.355 ±0.026 ±0.043 ±0.130
Transmission uncertainty (specification)
Uncorrected System Performance
1
Table 9.
Option 230/235/240/245/260/265/280/285/430/435/440/445/
460/465/480/485
User correction: OFF, system correction: ON
Description
Speciication (dB)
9 kHz to 300 kHz
300 kHz to 3 GHz
3 GHz to 6 GHz
6 GHz to 8.5 GHz
Directivity 20 dB 25 dB 20 dB 15 dB
Source match 20 dB 25 dB 20 dB 15 dB
Load match2 12 dB 17 dB 12 dB 10 dB
Transmission tracking3 ±1.5 dB ±1.0 dB ±1.0 dB ±1.0 dB
Relection tracking ±1.5 dB ±1.0 dB ±1.0 dB ±1.0 dB
Table 10.
Option 2D5/2K5/4D5/4K5
User correction: OFF, system correction: ON
Description
Speciication (dB)
300 kHz to 1 MHz
1 MHz to 1 GHz
1 GHz to 3 GHz
3 GHz to 6 GHz
6 GHz to 8.5 GHz
8.5 GHz to 11 GHz
11 GHz to 20 GHz
Directivity 20 dB 25 dB 25 dB 20 dB 15 dB 15 dB 15 dB
Source match 20 dB 25 dB 25 dB 20 dB 15 dB 15 dB 15 dB
Load match 9 dB 17 dB 15 dB 11 dB 9 dB 8 dB 7 dB
Transmission
tracking ±1.0 dB ±1.0 dB ±1.0 dB ±1.0 dB ±1.0 dB ±1.0 dB ±1.0 dB
Relection
tracking ±1.0 dB ±1.0 dB ±1.0 dB ±1.0 dB ±1.0 dB ±1.0 dB ±1.0 dB
1. The speciication might not be met when Shift LO Mode is ON. 2. Load match may be degraded by 3 dB when RF Range Fixed Mode is ON.
Test Port Output (Source)
Test port output frequency
Table 11.
Option 230/235/240/245/260/265/280/285/430/435/440/
445/460/465/480/485/2D5/2K5/4D5/4K5
Description
Speciication
Typical
Frequency range Option 230/430 Option 240/440 Option 260/460 Option 280/480 Option 235/435 Option 245/445 Option 265/465 Option 285/485 Option 2D5/4D5 Option 2K5/4K5
9 kHz to 3 GHz 9 kHz to 4.5 GHz 9 kHz to 6.5 GHz 9 kHz to 8.5 GHz 100 kHz to 3 GHz 100 kHz to 4.5 GHz 100 kHz to 6.5 GHz 100 kHz to 8.5 GHz 300 kHz to 14 GHz 300 kHz to 20 GHz
Resolution 1 Hz
Source stability standard
Option 1E5 ±7 ppm (5 to 40 ºC)±0.05 ppm (5 to 40 ºC),
±0.5 ppm/year CW accuracy
standard
Option 1E5 ±7 ppm±0.45 ppm (Serial Number Prefix MY463/SG463 and above) ±1 ppm (Serial Number Preix MY462/SG462 and below)
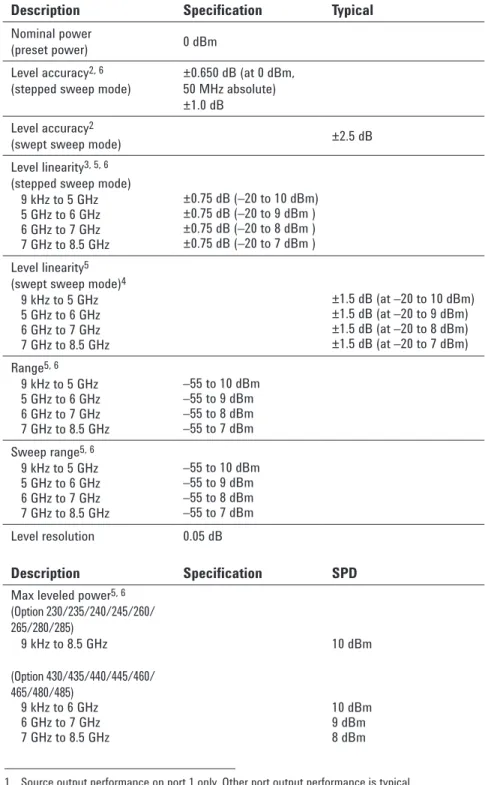
Test port output power
1Table 12.
Option 230/235/240/245/260/265/280/285/430/435/440/
445/460/465/480/485
Description
Speciication
Typical
Nominal power
(preset power) 0 dBm
Level accuracy2, 6
(stepped sweep mode) ±0.650 dB (at 0 dBm, 50 MHz absolute) ±1.0 dB
Level accuracy2
(swept sweep mode) ±2.5 dB
Level linearity3, 5, 6 (stepped sweep mode)
9 kHz to 5 GHz
5 GHz to 6 GHz 6 GHz to 7 GHz 7 GHz to 8.5 GHz
±0.75 dB (–20 to 10 dBm) ±0.75 dB (–20 to 9 dBm ) ±0.75 dB (–20 to 8 dBm ) ±0.75 dB (–20 to 7 dBm ) Level linearity5
(swept sweep mode)4
9 kHz to 5 GHz
5 GHz to 6 GHz 6 GHz to 7 GHz 7 GHz to 8.5 GHz
±1.5 dB (at –20 to 10 dBm) ±1.5 dB (at –20 to 9 dBm) ±1.5 dB (at –20 to 8 dBm) ±1.5 dB (at –20 to 7 dBm) Range5, 6
9 kHz to 5 GHz
5 GHz to 6 GHz 6 GHz to 7 GHz 7 GHz to 8.5 GHz
–55 to 10 dBm –55 to 9 dBm –55 to 8 dBm –55 to 7 dBm Sweep range5, 6
9 kHz to 5 GHz
5 GHz to 6 GHz 6 GHz to 7 GHz 7 GHz to 8.5 GHz
–55 to 10 dBm –55 to 9 dBm –55 to 8 dBm –55 to 7 dBm
Level resolution 0.05 dB
Description
Speciication
SPD
Max leveled power5, 6 (Option 230/235/240/245/260/ 265/280/285)
9 kHz to 8.5 GHz (Option 430/435/440/445/460/ 465/480/485)
9 kHz to 6 GHz 6 GHz to 7 GHz 7 GHz to 8.5 GHz
10 dBm
10 dBm 9 dBm 8 dBm 1. Source output performance on port 1 only. Other port output performance is typical. 2. Level accuracy is taken at 0 dBm, relative to 50 MHz reference unless otherwise stated. 3. Level linearity given is relative to 0 dBm.
4. The speciication might not be met at 5 MHz or 50 MHz.
5. The level accuracy speciication needs to be taken into account for test port output power level. 6. Power calibration using an external power meter improves level accuracy of the test port output power. Proper power meters/sensors, and the 82357B USB-GPIB interface are required to conduct power calibration.
Test port output power
7(continued)
Table 13.
Option 2D5/2K5/4D5/4K5
Description
Speciication
Typical
Nominal power (preset power) –5 dBm Level accuracy6
(stepped sweep mode)1
300 kHz to 1 MHz 1 MHz to 5 MHz 5 MHz to 8.5 GHz 8.5 GHz to 20 GHz
±0.650 dB (at –5 dBm, 50 MHz absolute) +2.0 dB, –6.0 dB
±2.0 dB ±1.0 dB ±2.5 dB Level accuracy
(swept sweep mode)2 300 kHz to 1 GHz 1 GHz to 8.5 GHz 8.5 GHz to 20 GHz
±5.0 dB ±2.5 dB +5.0 dB, –7.0 dB Level linearity5, 6
(stepped sweep mode)3 300 kHz to 1 MHz 1 MHz to 6 GHz 6 GHz to 8 GHz 8 GHz to 10.5 GHz 10.5 GHz to 15 GHz 15 GHz to 20 GHz
±0.75 dB (–25 to 8 dBm) ±0.75 dB (–25 to 10 dBm) ±0.75 dB (–25 to 9 dBm ) ±0.75 dB (–25 to 7 dBm ) ±0.75 dB (–25 to 3 dBm ) ±0.75 dB (–25 to 0 dBm ) Level linearity5
(swept sweep mode)3 300 kHz to 1 MHz 1 MHz to 6 GHz 6 GHz to 8 GHz 8 GHz to 10.5 GHz 10.5 GHz to 15 GHz 15 GHz to 20 GHz
±1.5 dB (–25 to 8 dBm) ±1.5 dB (–25 to 10 dBm) ±1.5 dB (–25 to 9 dBm ) ±1.5 dB (–25 to 7 dBm ) ±1.5 dB (–25 to 3 dBm ) ±1.5 dB (–25 to 0 dBm ) Range5, 6
300 kHz to 1 MHz 1 MHz to 6 GHz 6 GHz to 8 GHz 8 GHz to 10.5 GHz 10.5 GHz to 15 GHz 15 GHz to 20 GHz
–85 to 8 dBm –85 to 10 dBm –85 to 9 dBm –85 to 7 dBm –85 to 3 dBm –85 to 0 dBm Sweep range4, 5, 6
300 kHz to 1 MHz 1 MHz to 6 GHz 6 GHz to 8 GHz 8 GHz to 10.5 GHz 10.5 GHz to 15 GHz 15 GHz to 20 GHz (Source attenuator = 0 dB)
–25 to 8 dBm –25 to 10 dBm –25 to 9 dBm –25 to 7 dBm –25 to 3 dBm –25 to 0 dBm
Level resolution 0.05 dB
1. Level accuracy is taken at –5 dBm, relative to 50 MHz reference unless otherwise stated. 2. Level accuracy is taken at –5 dBm, relative to 50 MHz reference.
3. Level linearity given is relative to –5 dBm.
4. The sweep range shifts based on the selected source attenuator value (0 dB to 60 dB, 10 dB step). 5. The level accuracy speciication needs to be taken into account for test port output power level. 6. Power calibration using an external power meter improves level accuracy of the test port output power. Proper power meters/sensors, and the 82357B USB-GPIB interface are required to conduct power calibration. 7. Source output performance on port 1 only. Other port output performance is typical.
Test port output power
6(continued)
Table 13.
Option 2D5/2K5/4D5/4K5
Description
Speciication
SPD
Max leveled power3, 4 300 kHz to 1 MHz 1 MHz to 10 GHz 10 GHz to 13 GHz 13 GHz to 15 GHz 15 GHz to 18 GHz 18 GHz to 20 GHz
9 dBm 10 dBm 9 dBm 7 dBm 5 dBm 4 dBm
Test port output signal purity
Table 14.
Option 230/235/240/245/260/265/280/285/430/435/440/
445/460/465/480/485
Description
Speciication
Typical
Harmonics (2nd or 3rd) 9 kHz to 2 GHz 2 GHz to 8.5 GHz
< –25 dBc (at 5 dBm) < –20 dBc (at 5 dBm) Non-harmonic spurious
9 kHz to 8.5 GHz < –30 dBc (at 5 dBm)
Table 15.
Option 2D5/2K5/4D5/4K5
Description
Speciication
Typical
Harmonics (2nd to 5th)1 300 kHz to 1 GHz
1 GHz to 20 GHz
< –12 dBc (at maximum
output power)5
< –15 dBc (at maximum
output power)5 Non-harmonic spurious2
300 kHz to 20 GHz < –30 dBc (at –5 dBm)
1. This includes 6th and 7th harmonics when the test frequency is from 1 MHz to 1 GHz. 2. The carrier ±1/8th spurious is excluded from 8.76 GHz to 17.52 GHz.
3. The level accuracy speciication needs to be taken into account for test port output power level. 4. Power calibration using an external power meter improves level accuracy of the test port output power. Proper power meters/sensors, and the 82357B USB-GPIB interface are required to conduct power calibration. 5. Maximum output power is the maximum power of "Range" in Table 13 Test port output power.
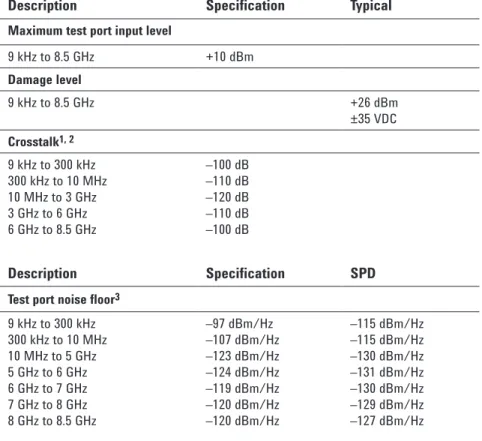
Test Port Input
Test port input levels
Table 16.
Option 230/235/240/245/260/265/280/285/430/435/440/
445/460/465/480/485
Description
Speciication
Typical
Maximum test port input level
9 kHz to 8.5 GHz +10 dBm
Damage level
9 kHz to 8.5 GHz +26 dBm
±35 VDC
Crosstalk1, 2
9 kHz to 300 kHz 300 kHz to 10 MHz 10 MHz to 3 GHz 3 GHz to 6 GHz 6 GHz to 8.5 GHz
–100 dB –110 dB –120 dB –110 dB –100 dB
Description
Speciication
SPD
Test port noise loor3
9 kHz to 300 kHz 300 kHz to 10 MHz 10 MHz to 5 GHz 5 GHz to 6 GHz 6 GHz to 7 GHz 7 GHz to 8 GHz 8 GHz to 8.5 GHz
–97 dBm/Hz –107 dBm/Hz –123 dBm/Hz –124 dBm/Hz –119 dBm/Hz –120 dBm/Hz –120 dBm/Hz
–115 dBm/Hz –115 dBm/Hz –130 dBm/Hz –131 dBm/Hz –130 dBm/Hz –129 dBm/Hz –127 dBm/Hz
1. The speciication might not be met at 5 MHz or 50 MHz.
2. Cross talk may be degraded by 10 dB when RF Range Fixed Mode is ON . 3. Test port noise loor may be degraded by 10 dB when RF Range Fixed Mode is ON.
Test port input levels
(continued)
Table 17.
Option 2D5/2K5/4D5/4K5
Description
Speciication
Typical
Maximum test port input level
300 kHz to 20 GHz +10 dBm
Damage level
300 kHz to 20 GHz +26 dBm
or ±35 VDC
Crosstalk1
300 kHz to 1 MHz 1 MHz to 5 MHz 5 MHz to 10 MHz 10 MHz to 45 MHz 45 MHz to 4 GHz 4 GHz to 6 GHz 6 GHz to 8.5 GHz 8.5 GHz to 15 GHz 15 GHz to 20 GHz
–68 dB –70 dB –100 dB –110 dB –118 dB –123 dB –120 dB –112 dB –106 dB
Description
Speciication
SPD
Test port noise loor
300 kHz to 1 MHz 1 MHz to 10 MHz 10 MHz to 100 MHz 100 MHz to 6 GHz 6 GHz to 8 GHz 8 GHz to 8.5 GHz 8.5 GHz to 10.5 GHz 10.5 GHz to 15 GHz 15 GHz to 20 GHz
–97 dBm/Hz –107 dBm/Hz –120 dBm/Hz –123 dBm/Hz –118 dBm/Hz –120 dBm/Hz –108 dBm/Hz –107 dBm/Hz –106 dBm/Hz
–110 dBm/Hz –115 dBm/Hz –129 dBm/Hz –130 dBm/Hz –130 dBm/Hz –130 dBm/Hz –120 dBm/Hz –120 dBm/Hz –119 dBm/Hz
Test port input (compression level)
Table 18.
Option 230/235/240/245/260/265/280/285/430/435/440/
445/460/465/480/485
Description
Speciication
SPD
Compression level Magnitude
9 kHz to 5 GHz 5 GHz to 8.5 GHz
(maximum test port input level = +10 dBm)
0.08 dB 0.1 dB
Phase
9 kHz to 3 GHz 3 GHz to 5 GHz 5 GHz to 8.5 GHz
(maximum test port input level = +10 dBm)
0.3 deg 0.6 deg 1.0 deg
Table 19.
Option 2D5/2K5/4D5/4K5
Description
Speciication
SPD
Compression level Magnitude
300 kHz to 10 MHz 10 MHz to 10 GHz 10 GHz to 15 GHz 15 GHz to 20 GHz
(maximum test port input level = +10 dBm)
0.3 dB 0.182 dB 0.712 dB 1.87 dB
Phase
300 kHz to 5 GHz 5 GHz to 10 GHz 10 GHz to 15 GHz 15 GHz to 20 GHz
(maximum test port input level = +10 dBm)
2.3 deg 4.3 deg 17.3 deg 20.3 deg
Test port input (trace noise)
Table 20.
Option 230/235/240/245/260/265/280/285/430/435/440/
445/460/465/480/485
Description
Speciication
3SPD
Trace noise magnitude1
9 kHz to 30 kHz (IFBW = 3 kHz) 0.004 dB rms 0.001 dB rms
30 kHz to 100 kHz (IFBW = 3 kHz) 0.003 dB rms 0.001 dB rms
100 kHz to 10 MHz (IFBW = 3 kHz) 0.003 dB rms 0.0005 dB rms
10 MHz to 4.38 GHz (IFBW = 10 kHz) 0.0005 dB rms
4.38 GHz to 8.5 GHz (IFBW = 10 kHz) 0.0006 dB rms
10 MHz to 4.38 GHz (IFBW = 70 kHz) 0.004 dB rms
(Relection) 0.001 dB rms
0.003 dB rms (Transmission)
4.38 GHz to 5 GHz (IFBW = 70 kHz) 0.006 dB rms 0.0012 dB rms
5 GHz to 6 GHz (IFBW = 70 kHz) 0.006 dB rms 0.0012 dB rms
6 GHz to 7 GHz (IFBW = 70 kHz) 0.006 dB rms 0.0012 dB rms
7 GHz to 8.5 GHz (IFBW = 70 kHz)
(at maximum output power level of sweep range) 0.006 dB rms 0.0012 dB rms
Trace noise phase2
9 kHz to 30 kHz (IFBW = 3 kHz) 0.035 deg rms
30 kHz to 10 MHz (IFBW = 3 kHz) 0.020 deg rms
10 MHz to 4.38 GHz (IFBW = 70 kHz) 0.035 deg rms 4.38 GHz to 5 GHz (IFBW = 70 kHz) 0.050 deg rms
5 GHz to 6 GHz (IFBW = 70 kHz) 0.050 deg rms
6 GHz to 7 GHz (IFBW = 70 kHz) 0.050 deg rms
7 GHz to 8.5 GHz (IFBW = 70 kHz)
(at maximum output power level of sweep range) 0.050 deg rms
1. The speciication might not be met at the following frequencies: 333.333 kHz, 406.25 kHz, 857.143 kHz, 928.571 kHz, 1.3 MHz, 2.4 MHz and 4.333333 MHz.
2. The speciication might not be met at 5 MHz or 50 MHz. 3. When RF Range Fixed Mode is ON, multiply by 2.3.
Test port input (trace noise)
(continued)
Table 21.
Option 2D5/2K5/4D5/4K5
Description
Speciication
SPD
Trace noise magnitude1, 3
300 kHz to 1 MHz (IFBW = 3 kHz) 1 MHz to 10 MHz (IFBW = 3 kHz) 10 MHz to 4.38 GHz (IFBW = 70 kHz) 4.38 GHz to 8.5 GHz (IFBW = 70 kHz) 8.5 GHz to 13.137 GHz (IFBW = 70 kHz) 13.137 GHz to 17 GHz (IFBW = 70 kHz) 17 GHz to 20 GHz (IFBW = 70 kHz) (at maximum output power level of sweep range)
0.006 dB rms 0.003 dB rms 0.004 dB rms 0.006 dB rms 0.009 dB rms 0.013 dB rms 0.023 dB rms
0.0009 dB rms 0.0005 dB rms 0.0010 dB rms 0.0012 dB rms 0.0024 dB rms 0.0040 dB rms 0.0065 dB rms
Trace noise phase2, 3
300 kHz to 1 MHz (IFBW = 3 kHz) 1 MHz to 10 MHz (IFBW = 3 kHz) 10 MHz to 4.38 GHz (IFBW = 70 kHz) 4.38 GHz to 8.5 GHz (IFBW = 70 kHz) 8.5 GHz to 13.137 GHz (IFBW = 70 kHz) 13.137 GHz to 17 GHz (IFBW = 70 kHz) 17 GHz to 20 GHz (IFBW = 70 kHz) (at maximum output power level of sweep range)
0.040 deg rms 0.020 deg rms 0.035 deg rms 0.050 deg rms 0.064 deg rms 0.095 deg rms 0.165 deg rms
0.0120 deg rms 0.0025 deg rms 0.0075 deg rms 0.0150 deg rms 0.0250 deg rms 0.0320 deg rms 0.0520 deg rms
1. The speciication might not be met at the following frequencies: 406.25 kHz, 666.667 kHz, 722.222 kHz, 857.143 kHz, 928.571 kHz, 1.444444 MHz, 1.714286 MHz, 1.8 MHz, 1.857143 MHz, 1.95 MHz, 2.4375 MHz, 2.571429 MHz, 3.714286 MHz, 4.8 MHz, 5 MHz, 5.416667 MHz, 7.583333 MHz, 10 MHz, 10.833333 MHz, 12.5 MHz.
2. The speciication might not be met at 5 MHz or 50 MHz. 3. Trace noise SPD is deined with transmission measurements only.
Test port input (stability)
1Table 22
. Option 230/235/240/245/260/265/280/285/430/435/440/
445/460/465/480/485
Description
Speciication
SPD
Stability magnitude
9 kHz to 3 GHz ±0.005 dB/°C
3 GHz to 6 GHz ±0.01 dB/°C
6 GHz to 8.5 GHz ±0.04 dB/°C
Stability phase
9 kHz to 3 GHz ±0.1 deg/°C
3 GHz to 6 GHz ±0.2 deg/°C
6 GHz to 8.5 GHz ±0.8 deg/°C
Table 23.
Option 2D5/2K5/4D5/4K5
Description
Speciication
SPD
Stability magnitude
300 kHz to 3 GHz 3 GHz to 6 GHz 6 GHz to 20 GHz
±0.005 dB/°C
±0.01 dB/°C
±0.04 dB/°C
Stability phase
300 kHz to 3 GHz 3 GHz to 6 GHz 6 GHz to 20 GHz
±0.1 deg/°C
±0.2 deg/°C ±0.8 deg/°C
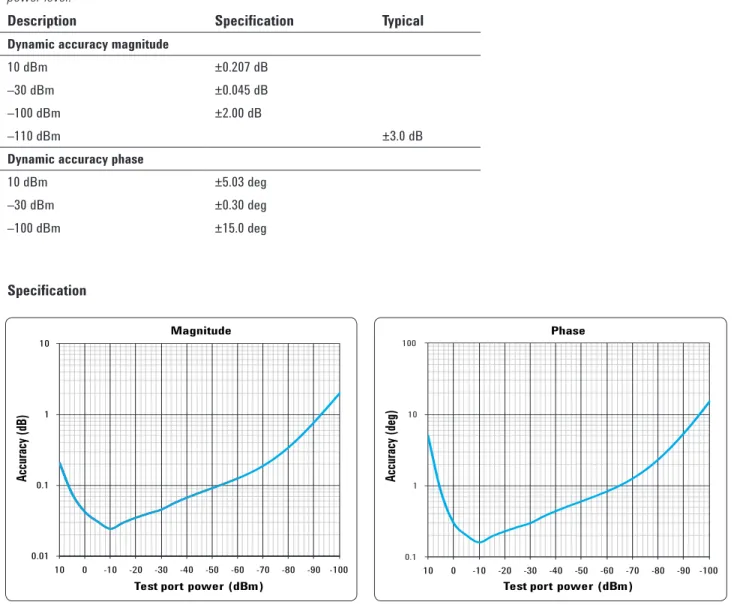
Test port input (dynamic accuracy)
1, 2Table 24
. Option 230/235/240/245/260/265/280/285/430/435/440/
445/460/465/480/485
Accuracy of the test port input power reading is relative to –10 dBm reference input
power level.
Description
Speciication
Typical
Dynamic accuracy magnitude
10 dBm ±0.207 dB
–30 dBm ±0.045 dB
–100 dBm ±2.00 dB
–110 dBm ±3.0 dB
Dynamic accuracy phase
10 dBm ±5.03 deg
–30 dBm ±0.30 deg
–100 dBm ±15.0 deg
Specification
±3.0 dB (at –110 dBm, Ref.= –10 dBm, typical) 0.01
0.1 1 10
-100 -90 -80 -70 -60 -50 -40 -30 -20 -10 0 10
Accuracy (dB)
Test port power (dBm) Magnitude
Accuracy (deg)
Test port power (dBm) Phase
0.1 1 10 100
-100 -90 -80 -70 -60 -50 -40 -30 -20 -10 0 10
1. Dynamic accuracy is verified with the following measurements: • compression over frequency
• IF linearity at two frequencies (1 MHz and 1.195 GHz) using a reference level of –10 dBm for an input power range of 0 to –100 dBm. For value below –60 dBm, refer to "VNA Receiver Dynamic Accuracy Specifications and Uncertainties N5247-90003"
http://cp.literature.agilent.com/litweb/pdf/N5247-90003.pdf
Test port input (dynamic accuracy)
1(continued)
Table 25.
Option 2D5/2K5/4D5/4K5
Accuracy of the test port input power reading is relative to –10 dBm reference input
power level.
Description
Speciication
Typical
Dynamic accuracy magnitude
10 dBm ±2.49 dB
–30 dBm ±0.046 dB
–100 dBm ±2.00 dB
–110 dBm ±3.0 dB
Dynamic accuracy phase
10 dBm ±20.6 deg
–30 dBm ±0.30 deg
–100 dBm ±15.0 deg
Specification
±3.0 dB (at –110 dBm, Ref.= –10 dBm, typical) Test port power (dBm)
Accuracy (dB)
Magnitude
0.01 0.1 1 10
-100 -90 -80 -70 -60 -50 -40 -30 -20 -10 0 10
Test port power (dBm)
Accuracy (deg)
Phase
0.1 1 10 100
-100 -90 -80 -70 -60 -50 -40 -30 -20 -10 0 10
1. Dynamic accuracy is verified with the following measurements: • compression over frequency
• IF linearity at two frequencies (1 MHz and 1.195 GHz) using a reference level of -10 dBm for an input power range of 0 to -60 dBm. For value below -60 dBm, refer to "VNA Receiver Dynamic Accuracy Specifications and Uncertainties N5247-90003"
Test port input (group delay)
1Table 26.
Option 230/235/240/245/260/265/280/285/430/435/440/
445/460/465/480/485
Description
Speciication
Supplemental information
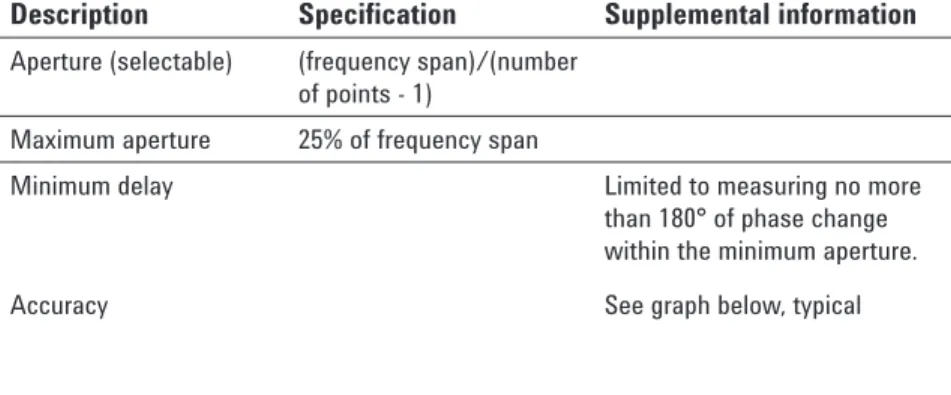
Aperture (selectable) (frequency span)/(number of points - 1)
Maximum aperture 25% of frequency span
Minimum delay Limited to measuring no more
than 180° of phase change within the minimum aperture.
Accuracy See graph below, typical
The following graph shows group delay accuracy with type-N connectors, full 2-port calibration and a 10 Hz IF bandwidth, RF Range Fixed Mode: OFF
Calibration kit (85032F). Insertion loss is assumed to be < 2 dB.
In general, the following formula can be used to determine the accuracy, in seconds, of a speciic group delay measurement:
±phase accuracy (degrees) / [360 x aperture (Hz)]
Accuracy (nSec)
Aperture (MHz)
0.01 0.1 1 10 100
100
10
1
0.1
0.01
0.001
C al pow er = -10 dB m ; M eas pow er = -10 dB m ; E lectrical Length = 10 m Frequency = 1 G H z
1. Group delay is computed by measuring the phase change within a speciied step (determined by the frequency span and the number of points per sweep).
Test port input (group delay)
1(continued)
Table 27.
Option 2D5/2K5/4D5/4K5
Description
Speciication
Supplemental information
Aperture (selectable) (frequency span)/(number of points - 1)
Maximum aperture 25% of frequency span
Minimum delay Limited to measuring no more
than 180° of phase change within the minimum aperture.
Accuracy See graph below, typical
The following graph shows group delay accuracy with 3.5 mm (male) connectors, full 2-port calibration and a 10 Hz IF bandwidth.
Calibration kit (85052D). Insertion loss is assumed to be < 2 dB.
In general, the following formula can be used to determine the accuracy, in seconds, of a speciic group delay measurement:
±phase accuracy (degrees) / [360 x aperture (Hz)] C al pow er = -10 dB m ; M eas pow er = -10 dB m ; E lectrical Length = 10 m Frequency = 1 G H z
Ac
cur
acy
(n
S
ec)
Aperture (MHz)
0 .0 0 1 0 .0 1 0 .1 1 1 0 1 0 0
0 .0 1 0 .1 1 1 0 1 0 0
1. Group delay is computed by measuring the phase change within a speciied step (determined by the frequency span and the number of points per sweep).
General Information
Table 28.
System bandwidth
Description
General characteristics
IF bandwidth settings
Range 10 Hz to 1.5 MHz
Nominal settings are:
10, 15, 20, 30, 40, 50, 70, 100, 150, 200, 300, 400, 500, 700, 1 k, 1.5 k, 2 k, 3 k, 4 k, 5 k, 7 k, 10 k, 15 k, 20 k, 30 k, 40 k, 50 k, 70 k, 100 k, 150 k, 200 k, 300 k, 400 k, 500 kHz, 700 kHz, 1 MHz, 1.5 MHz
Table 29.
Front panel information
Description
Typical
General characteristics
RF connectors
Option 230/235/240/ 245/260/265/280/285/ 430/435/440/445/460/ 465/480/485
Option 2D5/2K5/4D5/4K5
Type-N, female, 50 Ω
3.5 mm (male), 50 Ω nominal
Probe power
Connector 3 terminal connector x 2
Voltage & maximum
current +15 V ±2% (400 mA)–12.6 V ±5% (300 mA) (Combined load for both probe connections)
Display
Type 10.4 in TFT color LCD
with touch screen
Resolution XGA (1024 x 768)1
1. Valid pixels are 99.99% and more. Below 0.01% (approx. 30 points) of fixed points of black, blue, green or red are not regarded as failure.
Table 30.
Rear panel information
Description
Typical
General characteristics
External trigger input connector
Type BNC, female
Input level Low threshold voltage: 0.5 V
High threshold voltage: 2.1 V Input level range: 0 to + 5 V
Pulse width ≥ 2 μsec
Polarity Positive or negative
External trigger output connector
Type BNC, female
Maximum output current 50 mA
Output level Low level voltage: 0 V
High level voltage: 5 V
Pulse width 1 μsec
Polarity Positive or negative
External reference signal input connector
Type BNC, female
Input frequency 10 MHz ±10 ppm
Input level –3 to + 10 dBm
Internal reference signal output connector
Type BNC, female
Output frequency 10 MHz ±7 ppm
Signal type Sinewave
Output level 0 dBm ±3 dB into 50 Ω
Output impedance 50 Ω
Internal reference signal oven connector
Type BNC, female
Output frequency 10 MHz ±1 ppm
Table 31.
Rear panel information
(continued)
Description
Typical
General characteristics
Bias tee input connector
Type BNC, female (for each port)
Maximum voltage ±35 VDC
Maximum current (no degradation in RF speciications) ±200 mA
Maximum current (damage level) ±500 mA
Fuse 500 mA, bi-pin style
Video output 15-pin mini D-Sub; female;
drives XGA compatible monitors
GPIB 24-pin D-Sub (Type D-24),
female; compatible with IEEE-488 interface speci-ication is designed to be used in environment where electrical noise is relatively low. LAN or USBTMC inter-face is recommended to use at the higher electrical noise environment.
USB-host port
Universal serial bus jack, Type A coniguration (4 contacts inline, contact 1 on left); female; provides connection to printer, ECal module, USB/GPIB interface or multiport test set
Contact 1 Vcc: 4.75 to 5.25 VDC, 500
mA, maximum
Contact 2 – Data
Contact 3 + Data
Contact 4 Ground
USB (USBTMC1) interface port
Universal serial bus jack, Type B coniguration (4 contacts inline); female; provides connection to an external PC; compatible with USBTMC-USB488 and USB 2.0.
LAN 10/100/1000 BaseT
Ether-net, 8-pin coniguration; auto selects between the two data rates
Handler I/O port 36-pin centronics, female;
provides connection to handler system
Description
Typical
General characteristics
Line power2
Frequency 47 Hz to 63 Hz
Voltage 90-264 VAC (Vpeak > 120 V)
VA max 350 VA max.
Power Consumption
Option 230/235/240/245/260/265/280/285 Option 430/435/440/445/460/465/480/485 Option 2D5/2K5
Option 4D5/4K5
130 W (SPD) 155 W (SPD) 160 W (SPD) 185 W (SPD)
Description
Speciication
General characteristics
AUX input connector
Type BNC, female x 2
Input range ±1 V or ±10 V selectable
Accuracy 1 % + 1 mV for ±1 V input
1 % + 10 mV for ±10 V input
Table 33.
LXI compliance
Description
General characteristics
Class C (only applies to units that are shipped with irmware revision A.08.00 or later)
Table 32.
Rear panel information
(continued)
1. USB Test and Measurement Class (TMC) interface that communicates over USB, complying with the IEEE 488.1 and IEEE 488.2 standards.
Table 34.
EMC, safety and environment
Description
General characteristics
EMC
European Council Directive 2004/108/EC IEC 61326-1:2005
EN 61326-1:2006 CISPR 11:2003+A1:2004 EN 55011:2007 Group 1, Class A
IEC 61000-4-2:1995 +A2:2000 EN 61000-4-2:1995 +A2:2001 4 kV CD / 8 kV AD IEC 61000-4-3:2006 EN 61000-4-3:2006
1-3 V/m, 80-1000 MHz / 1.4 GHz - 2.7 GHz, 80% AM IEC 61000-4-4:2004
EN 61000-4-4:2004
1 kV power lines / 0.5 kV signal lines IEC 61000-4-5:2005
EN 61000-4-5:2006
0.5 kV line-line / 1 kV line-ground IEC 61000-4-6:2003 + A1:2004+ A2:2006 EN 61000-4-6:2007
3 V, 0.15-80 MHz, 80% AM IEC 61000-4-11:2004 EN 61000-4-11:2004 0.5-300 cycle, 0% / 70% ICES-001:2006 Group 1, Class A AS/NZS CISPR11:2004 Group 1, Class A
Safety
European Council Directive 2006/95/EC IEC 61010-1:2001 / EN 61010-1:2001 Measurement Category I
Pollution Degree 2 Indoor Use
CAN/CSA C22.2 No. 61010-1-04 Measurement Category I Pollution Degree 2 Indoor Use
Environment
This product complies with the WEEE Directive (2002/96/EC) marking requirements. The afixed label indicates that you must not discard this electrical/electronic product in domestic household waste. Product Category: With reference to the equipment types in the WEEE Directive Annex I, this product is classed as a “Monitoring and Control instrumentation” product.
Do not dispose in domestic household waste.
To return unwanted products, contact your local Agilent ofice, or see www.agilent.com/environment/product/ for more information.
Table 35.
Analyzer environmental specifications and dimensions
Description
General characteristics
Operating environment
Temperature +5 °C to +40 °C
Error-corrected temperature range 23 °C (±5 °C) with < 1 °C deviation from calibration temperature
Humidity 20% to 80% at wet bulb temperature < +29 °C (non-condensation)
Altitude 0 to 2,000 m (0 to 6561 feet)
Vibration 0.21 G maximum, 5 Hz to 500 Hz
Non-Operating storage environment
Temperature –10 °C to +60 °C
Humidity 20% to 90% at wet bulb temperature < +40 °C (non-condensation)
Altitude 0 to 4572 m (0 to 15,000 feet)
Vibration 0.5 G maximum, 5 Hz to 500 Hz
Dimensions See next page. Weight (net)
Option 230/240/260/280 (2-port) Option 235/245/265/285 (2-port) Option 430/480/440/460 (4-port) Option 435/445/465/485 (4-port) Option 2D5/2K5 (2-port) Option 4D5/4K5 (4-port)
18.2 kg 18.3 kg 19.9 kg 20.0 kg 19.8 kg 21.8 kg
Figure 3. Dimensions (front view, E5071C with Option 230/235/240/245/260/265/280/285, in millimeters)
Figure 4. Dimensions (front view, E5071C with Option 430/435/440/445/460/465/480/485, in millimeters)
426
58 20 51 122 37
27
222
22
19
22
426
58 20 51 41 41 41 37
27
222
22
19
426
58 20 51 122 37
27
222
26
19
22
Figure 5. Dimensions (front view, E5071C with Option 2D5/2K5, in millimeters)
Figure 7. Dimensions (rear view with Option 1E5, in millimeters)
Figure 8. Dimensions (side view, E5071C Option 230/235/240/245/260/265/280/285/430/435/440/445/460/465/480/485 , in millimeters)
Figure 9. Dimensions (side view, E5071C with Option 2D5/2K5/4D5/4K5, in millimeters)
18
215
15
235
13
222
472 417
32 23.4
48 21 96 422
426 128
167 292
25
25 25 25
2 2
25
58
144
159
179 190
217
64
109
147
25 25
472
32 417 23
14
215
18
222
13
Measurement Throughput Summary
1, 2
Cycle time for measurement completion
(ms)
Table 36.
Option 240/245/260/265/280/285/440/445/460/465/480/485
Sweep mode: Swept, analyzer display turned off with: DISP:ENAB OFF, number of traces = 1, system error correction: OFF
Number of points
51
201
401
1601
Start 1 GHz, stop 1.2 GHz, 500 kHz IF bandwidth
Uncorrected 4 5 7 17
2-port cal 6 9 12 33
4-port cal 12 17 24 66
Start 1 GHz, stop 1.2 GHz, 100 kHz IF bandwidth
Uncorrected 4 5 7 19
2-port cal 7 9 13 37
4-port cal 12 18 26 73
Start 1 GHz, stop 1.2 GHz, 1 kHz IF bandwidth
Uncorrected 53 200 395 1562
2-port cal 106 400 790 3123
4-port cal 211 799 1579 6245
Start 100 kHz, stop 4.5 GHz, 500 kHz IF bandwidth
Uncorrected 11 13 14 23
2-port cal 20 25 27 45
4-port cal 40 49 53 95
Start 100 kHz, stop 4.5 GHz, 100 kHz IF bandwidth
Uncorrected 11 13 14 25
2-port cal 21 25 27 49
4-port cal 40 50 54 102
Start 100 kHz, stop 4.5 GHz, 1 kHz IF bandwidth
Uncorrected 56 205 402 1581
2-port cal 111 409 804 3162
4-port cal 222 818 1608 6323
1. Supplemental performance data.
Start 100 kHz, stop 8.5 GHz, 500 kHz IF bandwidth
Uncorrected 14 18 19 23
2-port cal 28 35 37 45
4-port cal 55 69 74 90
Start 100 kHz, stop 8.5 GHz, 100 kHz IF bandwidth
Uncorrected 14 18 19 25
2-port cal 28 35 37 49
4-port cal 55 69 74 98
Start 100 kHz, stop 8.5 GHz, 1 kHz IF bandwidth
Uncorrected 56 205 403 1581
2-port cal 112 410 805 3162
4-port cal 224 820 1609 6322
Number of points
51
201
401
1601
Start 1 GHz, stop 1.2 GHz, 500 kHz IF bandwidth
Uncorrected 4 8 11 28
2-port cal 8 14 22 55
4-port cal 16 28 42 109
Start 1 GHz, stop 1.2 GHz, 100 kHz IF bandwidth
Uncorrected 5 9 14 40
2-port cal 9 18 28 80
4-port cal 17 34 55 159
Start 1 GHz, stop 1.2 GHz, 1 kHz IF bandwidth
Uncorrected 53 200 395 1562
2-port cal 106 400 790 3123
4-port cal 211 799 1579 6245
Start 100 kHz, stop 4.5 GHz, 500 kHz IF bandwidth
Uncorrected 7 12 18 47
2-port cal 14 24 36 94
4-port cal 27 48 71 187
Table 37.
Option 240/245/260/265/280/285/440/445/460/465/480/485
Sweep mode: Stepped, analyzer display turned off with: DISP:ENAB OFF, number of traces = 1, system error correction: ON
Start 100 kHz, stop 4.5 GHz, 100 kHz IF bandwidth
Uncorrected 8 14 21 60
2-port cal 14 27 42 118
4-port cal 28 54 83 236
Start 100 kHz, stop 4.5 GHz, 1 kHz IF bandwidth
Uncorrected 56 205 403 1581
2-port cal 111 409 804 3162
4-port cal 222 818 1608 6323
Start 100 kHz, stop 8.5 GHz, 500 kHz IF bandwidth
Uncorrected 8 13 19 47
2-port cal 14 25 36 94
4-port cal 28 49 72 187
Start 100 kHz, stop 8.5 GHz, 100 kHz IF bandwidth
Uncorrected 8 14 22 59
2-port cal 15 28 43 118
4-port cal 30 56 85 236
Start 100 kHz, stop 8.5 GHz, 1 kHz IF bandwidth
Uncorrected 56 205 403 1581
2-port cal 112 410 805 3162
Table 38.
Option 2D5/2K5/4D5/4K5
Sweep mode: Swept, analyzer display turned off with: DISP:ENAB OFF, number of traces = 1, system error correction: OFF
Number of Points
51
201
401
1601
Start 11 GHz, stop 12 GHz, 500 kHz IF bandwidth
Uncorrected 3 3 5 15
2-port cal 6 6 9 29
4-port cal 10 11 18 65
Start 11 GHz, stop 12 GHz, 100 kHz IF bandwidth
Uncorrected 3 3 5 17
2-port cal 6 6 10 33
4-port cal 11 12 20 71
Start 11 GHz, stop 12 GHz, 1 kHz IF bandwidth
Uncorrected 52 199 395 1565
2-port cal 103 397 789 3128
4-port cal 205 794 1577 6256
Start 8 GHz, stop 18 GHz, 500 kHz IF bandwidth
Uncorrected 17 21 22 22
2-port cal 33 42 43 44
4-port cal 66 82 85 88
Start 8 GHz, stop 18 GHz, 100 kHz IF bandwidth
Uncorrected 17 21 22 24
2-port cal 34 42 43 47
4-port cal 67 83 86 93
Start 8 GHz, stop 18 GHz, 1 kHz IF bandwidth
Uncorrected 57 206 403 1581
2-port cal 114 411 805 3162
4-port cal 227 822 1610 6323
Start 300 kHz, stop 20 GHz, 500 kHz IF bandwidth
Uncorrected 22 36 39 43
2-port cal 44 71 77 84
4-port cal 88 141 153 168
Start 300 kHz, stop 20 GHz, 100 kHz IF bandwidth
Uncorrected 23 36 39 43
2-port cal 45 71 78 85
4-port cal 89 142 154 169
Start 300 kHz, stop 20 GHz, 1 kHz IF bandwidth
Uncorrected 60 210 408 1590
2-port cal 118 420 816 3179
Table 39.
Option 2D5/2K5/4D5/4K5
Sweep mode: Stepped, analyzer display turned off with: DISP:ENAB OFF, number of traces = 1, system error correction: ON
Number of Points
51
201
401
1601
Start 11 GHz, stop 12 GHz, 500 kHz IF bandwidth
Uncorrected 3 6 11 31
2-port cal 5 12 20 61
4-port cal 10 24 40 120
Start 11 GHz, stop 12 GHz, 100 kHz IF bandwidth
Uncorrected 3 8 14 43
2-port cal 6 15 26 85
4-port cal 11 30 52 170
Start 11 GHz, stop 12 GHz, 1 kHz IF bandwidth
Uncorrected 52 199 395 1565
2-port cal 103 397 789 3128
4-port cal 205 794 1577 6256
Start 8 GHz, stop 18 GHz, 500 kHz IF bandwidth
Uncorrected 9 13 19 47
2-port cal 16 26 37 94
4-port cal 32 51 73 187
Start 8 GHz, stop 18 GHz, 100 kHz IF bandwidth
Uncorrected 9 15 22 60
2-port cal 17 29 43 118
4-port cal 33 58 86 236
Start 8 GHz, stop 18 GHz, 1 kHz IF bandwidth
Uncorrected 57 206 403 1581
2-port cal 114 411 805 3162
4-port cal 227 822 1610 6323
Start 300 kHz, stop 20 GHz, 500 kHz IF bandwidth
Uncorrected 11 18 24 56
2-port cal 21 35 47 111
4-port cal 41 68 94 221
Start 300 kHz, stop 20 GHz, 100 kHz IF bandwidth
Uncorrected 11 19 27 68
2-port cal 21 38 53 135
4-port cal 42 74 106 270
Start 300 kHz, stop 20 GHz, 1 kHz IF bandwidth
Uncorrected 60 210 408 1590
2-port cal 118 420 816 3179
Cycle time (ms) vs. number of points
Table 40.
Option 240/245/260/265/280/285/440/445/460/465/480/485
Start 1 GHz, stop 1.2 GHz, 500 kHz IF bandwidth, error correction: OFF, display update: OFF, number of traces = 1
Number of points Sweep mode: Swept, System error correction: OFF
Sweep mode: Stepped, System error correction: ON
51 4 4
201 5 8
401 7 11
1601 17 28
Table 41.
Option 2D5/2K5/4D5/4K5
Start 11 GHz, stop 12 GHz, 500 kHz IF bandwidth, error correction: OFF, display update: OFF, number of traces = 1
Number of points Sweep mode: Swept, System error correction: OFF
Sweep mode: Stepped, System error correction: ON
51 3 3
201 3 6
401 5 11
Cycle time (ms) vs. IF bandwidth
Table 42.
240/245/260/265/280/285/440/445/460/465/480/485
Sweep mode: Swept, analyzer display turned off with: DISP: ENAB OFF,
number of traces = 1, system error correction: OFF, Frequency = 4 GHz, NOP = 201
IF BW [Hz] Cycle time [ms] IF BW [Hz] Cycle time [ms] IF BW [Hz] Cycle time [ms] IF BW [kHz] Cycle time [ms] IF BW [kHz] Cycle time [ms] IF BW [kHz] Cycle time [ms]
10 19300 100 1933 1000 196 10 22 100 5 1000 5
15 12868 150 1290 1500 132 15 16 150 5 1500 5
20 9652 200 968 2000 100 20 13 200 5
30 6436 300 647 3000 68 30 9 300 5
40 4827 400 486 4000 52 40 8 400 5
50 3863 500 389 5000 42 50 7 500 5
70 2737 700 277 7000 30 70 6 700 5
Table 43.
Option 2D5/2K5/4D5/4K5
Sweep mode: Swept, analyzer display turned off with: DISP: ENAB OFF,
number of traces = 1, system error correction: OFF, Frequency = 10 GHz, NOP = 201
IF BW [Hz] Cycle time [ms] IF BW [Hz] Cycle time [ms] IF BW [Hz] Cycle time [ms] IF BW [kHz] Cycle time [ms] IF BW [kHz] Cycle time [ms] IF BW [kHz] Cycle time [ms]
10 19328 100 1931 1000 194 10 20 100 3 1000 3
15 12890 150 1288 1500 130 15 14 150 3 1500 3
20 9670 200 966 2000 98 20 11 200 3
30 6448 300 645 3000 66 30 7 300 3
40 4836 400 484 4000 50 40 6 400 3
50 3868 500 387 5000 40 50 5 500 3
Cycle time (ms) vs. RF Range Fixed Mode
Table 44.
Option 230/235/240/245/260/265/280/285/430/435/440/445/46
0/465/480/485
Sweep mode: Swept, analyzer display turned off with: DISP:ENAB OFF,
number of traces = 1, system error correction: OFF, Start 1 GHz, stop 1.2 GHz, 500 kHz IF bandwidth
Number of points
51
201
401
1601
RF Range Fixed Mode: ON
Uncorrected 2 3 5 15
2-port cal 2 5 8 29
4-port cal 4 9 16 58
RF Range Fixed Mode: OFF
Uncorrected 4 5 7 17
2-port cal 6 9 12 33
4-port cal 12 17 24 66
Sweep mode: Swept, analyzer display turned off with: DISP:ENAB OFF,
number of traces = 1, system error correction: OFF, Start 1 GHz, stop 1.2 GHz, 100 kHz IF bandwidth
Number of points
51
201
401
1601
RF Range Fixed Mode: ON
Uncorrected 2 3 5 17
2-port cal 3 5 9 33
4-port cal 4 10 18 65
RF Range Fixed Mode: OFF
Uncorrected 4 5 7 19
2-port cal 7 9 13 37
Data transfer time (ms)
1, 2Table 45.
All options
Number of points
51
201
401
1601
SCPI over GPIB3
64-bit loating point 4 12 23 88
32-bit loating point 3 7 12 45
ASCII 9 34 68 267
SCPI over 1 Gbps LAN (Socket)3
REAL 64 1 1 1 2
REAL 32 1 1 1 2
ASCII 6 21 40 155
SCPI over 1 Gbps LAN (SICL-LAN)3
REAL 64 4 4 4 5
REAL 32 4 4 4 4
ASCII 4 6 9 25
SCPI over USB (SICL-USB)3
REAL 64 2 2 2 2
REAL 32 2 2 2 2
ASCII 2 6 10 38
SCPI over GPIB/USB (82357B)
REAL 64 8 15 24 85
REAL 32 6 10 15 45
ASCII 75 282 561 2235
COM4
Variant type 1 1 1 1
1. Supplemental performance data. Data transfer time varies depending on the type of PC and control software. 2. Measured with irmware version B.12.03 with serial number preix MY465.
3. Transferred complex S11 data, using :CALC{1-36}:DATA:FDAT?.
E5092A Configurable multiport test set
The section provides test input/output performance without calibration by the E5071C.
Table 46.
Test set input/output performance
Description
Speciication
Typical
Frequency range 50 MHz to 20 GHz
Damage level 20 dBm, ±35 VDC
Table 47.
Option E5092A-020 port performance
Description
Speciication
Typical
Load match (selected port) SPDT switch1
50 MHz to 2 GHz 2 GHz to 4 GHz 4 GHz to 8 GHz 8 GHz to 10 GHz 10 GHz to 18 GHz 18 GHz to 20 GHz
17 dB 11 dB 8 dB 7 dB 4 dB 4 dB
SP4T switch2
50 MHz to 2 GHz 2 GHz to 3 GHz 3 GHz to 8 GHz 8 GHz to 10 GHz 10 GHz to 18 GHz 18 GHz to 20 GHz
17 dB 11 dB 8 dB 7 dB 4 dB 4 dB
Load match (unselected port) SPDT switch1
50 MHz to 3 GHz 3 GHz to 10 GHz 10 GHz to 16 GHz 16 GHz to 18 GHz 18 GHz to 20 GHz
17 dB 11 dB 8 dB 6 dB 4 dB
SP4T switch2
50 MHz to 3 GHz 3 GHz to 10 GHz 10 GHz to 16 GHz 16 GHz to 18 GHz 18 GHz to 20 GHz
17 dB 11 dB 8 dB 6 dB 4 dB
1. SPDT: Single-pole-double-throw switches. Applies to SW5, SW6, SW7, SW8, SW9 and SW10 in the E5092A. (See Figure 20.) 2. SP4T: Single-pole-four-throw switches. Applies to SW1, SW2, SW3 and SW4 in the E5092A. (See Figure 20.)
Description
Speciication
Typical
Load match (common port) SPDT switch1
50 MHz to 2 GHz 2 GHz to 4 GHz 4 GHz to 8 GHz 8 GHz to 10 GHz 10 GHz to 20 GHz
16 dB 11 dB 8 dB 7 dB 4 dB
SP4T switch2
50 MHz to 1.3 GHz 1.3 GHz to 4 GHz 4 GHz to 8 GHz 8 GHz to 10 GHz 10 GHz to 20 GHz
16 dB 11 dB 8 dB 7 dB 4 dB Insertion loss SPDT switch1
50 MHz to 100 MHz 100 MHz to 2 GHz 2 GHz to 3 GHz 3 GHz to 4 GHz 4 GHz to 6 GHz 6 GHz to 8 GHz 8 GHz to 10 GHz 10 GHz to 14 GHz 14 GHz to 18 GHz 18 GHz to 20 GHz
4 dB 3.5 dB 4.5 dB 5 dB 5.5 dB 7 dB 8 dB 8.5 dB 10 dB 11.5 dB
SP4T switch2
50 to 100 MHz 100 MHz to 2 GHz 2 GHz to 3 GHz 3 GHz to 4 GHz 4 GHz to 6 GHz 6 GHz to 8 GHz 8 GHz to 10 GHz 10 GHz to 14 GHz 14 GHz to 18 GHz 18 GHz to 20 GHz
4 dB 3.5 dB 4.5 dB 5.5 dB 6 dB 7.5 dB 8.5 dB 9.5 dB 10.5 dB 12 dB
Stability per switch
Condition: Enviroment Temperature +23 °C ±3 °C and Internal DC source: ≤ 100 mA (Sum of 4 channels), no heat source and no wall close to the unit.
50 M to 4 GHz 4 G to 12 GHz 12 G to 20 GHz
Condition: besides the above 50 M to 4 GHz
4 G to 12 GHz 12 G to 20 GHz
0.003 dB/°C (SPD) 0.005 dB/°C (SPD) 0.008 dB/°C (SPD) 0.007 dB/°C (SPD) 0.012 dB/°C (SPD) 0.017 dB/°C (SPD)
Isolation3
50 MHz to 500 MHz 500 MHz to 1 GHz 1 GHz to 2 GHz 2 GHz to 6 GHz 6 GHz to 10 GHz 10 GHz to 18 GHz 18 GHz to 20 GHz
65 dB 80 dB 85 dB 90 dB 85 dB 75 dB 65 dB
(Over arbitrarily test ports)
Table 48.
Option E5092A-020 port performance
(continued)
1. SPDT: Single-pole-double-throw switches. Applies to SW5, SW6, SW7, SW8, SW9 and SW10 in the E5092A. (See Figure 20.) 2. SP4T: Single-pole-four-throw switches. Applies to SW1, SW2, SW3 and SW4 in the E5092A. (See Figure 20.)
Table 49.
Control line
Description
Speciication
Typical
Number of groups 4
Group A: 8 bits Group B,C,D: 4 bits Input voltage range1 0 V to +5 V (positive input)
–5 V to 0 V (negative input)
Maximum current Group A, B: 50 mA in total of each group Group C, D: 500 uA in total of each group
Impedance Group A, B: < 10 ohm
Group C, D: < 200 ohm
Table 50.
DC source
Description
Speciication
Typical
Number of sources 4
Output voltage range 0 V to +5.2 V (nominal)2
Output voltage accuracy ±3 % of setting (+1 V to +5 V) at 1 M ohm load impedance
Voltage resolution 10 mV (nominal)3
Maximum current 150 mA for each source
Output impedance < 5 ohm
Table 51.
Operating storage environment
Description
General characteristics
Temperature +5 °C to +40 °C
Humidity 20 to 80 % at wet bulb temperature
< +29 °C (non-condensing)
Altitude 0 to 2,000m (0 to 6,561 feet)
Vibration 0.21 G max., 5 to 500 Hz
Table 52.
Non-operating storage environment
Description
General characteristics
Temperature –10 °C to +60 °C
Humidity 20 to 90 % at wet bulb temperature
< +40 °C (non-condensing)
Altitude 0 to 4,572 m (0 to 15,000 feet)
Vibration 0.5 G max., 5 Hz to 500 Hz
1. Input voltage will be clipped at about ±5.2 V when over this range. 2. The output voltage can be set in this range.
Table 53.
Front panel information
Description
General characteristics
RF connectors SMA (Female)
Test ports 38 ports
Control line 15-pin D-sub, female
25-pin D-sub, female
Table 54.
Rear panel information
Description
General characteristics
USB port Type B-receptacle, provide
connection to the E5071C Line power1
Frequency Voltage VA max
47 to 63 Hz
90 to 132 VAC, or 198 to 264 VAC (automatically switched) 300 VA max.
Table 55.
Test set dimensions and block diagram
Description
General characteristics
Dimensions
E5092A Option 020 See Figures 16, 17, 18 and 19
Weight
E5092A Option 020 9 kg
Figure 10. Dimensions (front view, with Option E5092A-020, in millimeters, nominal) 426
129 192
133
18
Figure 11. Dimensions (pitch between switches, with Option E5092A-020, in millimeters, nominal)
Figure 12. Dimensions (rear view, with Option E5092A-020, in millimeters, nominal)
Figure 13. Dimensions (side view, with Option E5092A-020, in millimeters, nominal)
129 37
133
51
83
36.8
132.72
18.57
17
27 27
65.34
23.38
23.38
40.6 40.6 40.6
13.5 27 69.8
27 27
27
27 27.8
146
13
133
18
126
144
472
Figure 14. Switch coniguration (E5092A-020)
Figure 15. DC control line (E5092A-020)
Control Line 1 (Group A) Control Line 2 (Group A) Control Line 3 (Group A) Control Line 4 (Group A)
Control Line 8 (Group A) :
Control Line 2 (Group B) Control Line 3 (Group B) Control Line 4 (Group B) Control Line 1 (Group B)
Control Line 1 (Group C) Control Line 2 (Group C) Control Line 3 (Group C) Control Line 4 (Group C)
Control Line 1 (Group D) Control Line 2 (Group D) Control Line 3 (Group D) Control Line 4 (Group D) :
: DC Source (Group A)
Control Line 1 (Group A)
DC Source (Group B)
DC Source (Group C)
DC Source (Group D)
Control Line 2 (Group B)
Control Line 2 (Group C)
Control Line 2 (Group D) Positive Input (High)
Negative Input (Low) Positive Input (High)
Negative Input (Low) Positive Input (High)
Negative Input (Low)
DC Source Output DC Source Output DC Source Output DC Source Output
Impedance Negative Input
(Low)
Max Current Positive Input
(High) Output
Impedance Output
Voltage
S W 6 6A 6B
6C O M S W 7
7C O M 7A 7B
S W 8 8A 8B
8C O M
S W 9
9C O M 9A 9B
S W 1010A 10B
10C O M
S W 5 5A
5C O M 5B S W 1
1A 1B 1C 1D P O R T 1
S W 2
2A 2B 2C 2D P O R T 2
S W 3
3A 3B 3C 3D P O R T 3
S W 4
4A 4B 4C 4D P O R T 4